Research Article Page 4 of 5
Sunspot numbers: Implications on Eastern African rainfall
and perhaps a prolonged drought of the Sahelian type. Judging from the symmetry of the Modern Maximum, a drought of the type experienced in the early 1930s will most likely occur in 2020±2 after the passage of the current Cycle 24. This observation is also consistent with model SMS12.12 results as shown in Figure 4. Because Kenya’s rainfall is influenced by the Sahel climate, it is likely that the decline in rainfall volumes may be experienced in the Eastern Africa region and perhaps the Sahel region, including the Greater Horn of Africa.
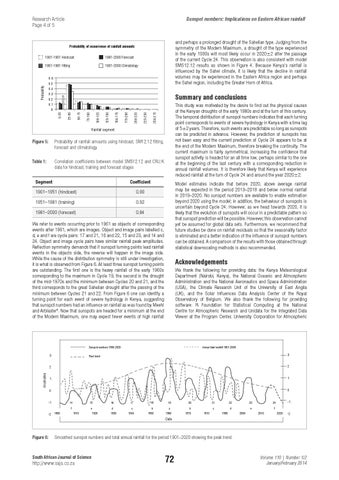
Probability of occurrence of rainfall amounts 1901-1951 Hindcast
1981-2000 Forecast
1951-1981 Fitting
1901-2000 Climatology
Probability
0.6 0.5 0.4 0.3
Summary and conclusions
0.2
This study was motivated by the desire to find out the physical causes of the Kenyan droughts of the early 1980s and at the turn of this century. The temporal distribution of sunspot numbers indicates that each turning point corresponds to events of severe hydrology in Kenya with a time lag of 5±2 years. Therefore, such events are predictable so long as sunspots can be predicted in advance. However, the prediction of sunspots has not been easy and the current prediction of Cycle 24 appears to be at the end of the Modern Maximum, therefore breaking the continuity. The current maximum is fairly symmetrical, increasing the confidence that sunspot activity is headed for an all time low, perhaps similar to the one at the beginning of the last century with a corresponding reduction in annual rainfall volumes. It is therefore likely that Kenya will experience reduced rainfall at the turn of Cycle 24 and around the year 2020±2.
0.1 250-275
225-250
200-225
175-200
150-175
125-150
100-125
75-100
50-75
25-50
0-25
0
Rainfall segment
Figure 5:
Probability of rainfall amounts using hindcast, SM12.12 fitting, forecast and climatology.
Table 1: Correlation coefficients between model SMS12.12 and CRU.K data for hindcast, training and forecast stages
Segment
Coefficient
1901–1951 (hindcast)
0.90
1951–1981 (training)
0.92
1981–2000 (forecast)
0.84
Model estimates indicate that before 2020, above average rainfall may be expected in the period 2013–2018 and below normal rainfall in 2019–2020. No sunspot numbers are available to enable estimation beyond 2020 using the model; in addition, the behaviour of sunspots is uncertain beyond Cycle 24. However, as we head towards 2020, it is likely that the evolution of sunspots will occur in a predictable pattern so that sunspot prediction will be possible. However, this observation cannot yet be assumed for global data sets. Furthermore, we recommend that future studies be done on rainfall residuals so that the seasonality factor is eliminated and a better indication of the influence of sunspot numbers can be obtained. A comparison of the results with those obtained through statistical downscaling methods is also recommended.
We refer to events occurring prior to 1961 as objects of corresponding events after 1961, which are images. Object and image pairs labelled c, d, e and f are cycle pairs: 17 and 21, 16 and 22, 15 and 23, and 14 and 24. Object and image cycle pairs have similar rainfall peak amplitudes. Reflection symmetry demands that if sunspot turning points lead rainfall events in the objects side, the reverse will happen in the image side. While the cause of the distribution symmetry is still under investigation, it is what is observed from Figure 6. At least three sunspot turning points are outstanding. The first one is the heavy rainfall of the early 1960s corresponding to the maximum in Cycle 19, the second is the drought of the mid-1970s and the minimum between Cycles 20 and 21, and the third corresponds to the great Sahelian drought after the passing of the minimum between Cycles 21 and 22. From Figure 6 one can identify a turning point for each event of severe hydrology in Kenya, suggesting that sunspot numbers had an influence on rainfall as was found by Meehl and Arblaster4. Now that sunspots are headed for a minimum at the end of the Modern Maximum, one may expect fewer events of high rainfall
Acknowledgements We thank the following for providing data: the Kenya Meteorological Department (Nairobi, Kenya), the National Oceanic and Atmospheric Administration and the National Aeronautics and Space Administration (USA), the Climate Research Unit of the University of East Anglia (UK), and the Solar Influences Data Analysis Center of the Royal Observatory of Belgium. We also thank the following for providing software: R Foundation for Statistical Computing at the National Centre for Atmospheric Research and Unidata for the Integrated Data Viewer at the Program Center, University Corporation for Atmospheric
Sunspot numbers 1900-2020
Anomalies
3
Annual total rainfall 1901-2000
3
Peak trend
2
2
1
1
0
0
-1 -2 1900
14
15
16
17
18
19
20
21
22
23
24
f
e
d
c
b
a
b
c
d
e
f
1910
1920
1930
1940
1950
1960
1970
1910
1990
2000
2010
-1 2020
-2
Date
Figure 6:
Smoothed sunspot numbers and total annual rainfall for the period 1901–2020 showing the peak trend.
South African Journal of Science
http://www.sajs.co.za
72
Volume 110 | Number 1/2 January/February 2014