Science Explorations
Saint Ann’s School
VOLUME 12
2022-2023

A Return to the Aether: Retracing the Michelson-Morley Experiment and its Impact on the Pursuit
Hungry Hitchhikers: The Egg-Laying Patterns Of The Spotted Lanternfly
Anna M. Mentor: Liz V.Abstract
Spotted Lanternflies are an invasive insect that most likely arrived to the U.S. as stowaways on a shipment of stone in 2012. In 2014, the first infestation was discovered in Pennsylvania. Now, it is 2023 and they have spread to 14 states in only 11 years. Due to their large size and ample appetite for their diet of plant sap, these bugs cost the U.S. hundreds of millions of dollars annually, not to mention the decimation of plant life not equipped to handle their presence. Squishing them is one way to help fight this ecological disaster, but I was curious as to how they could spread so effortlessly, as they are somewhat clumsy fliers. I learned that they are hitchhikers, catching rides around the country either as live adults or as eggs. I was interested mainly in their egg-laying patterns, because to squish one spotted lanternfly is to squish one spotted lanternfly, but to squish an egg mass is to squish up to 60.
I began my research in the fall by capturing egg-laying adults to see what surfaces they preferred for laying. Two laid egg masses in the cage, and over the winter I collected more from a local arborist. I then set up an experiment to expose the egg masses to different amounts of light and heat. While I waited for the eggs to hatch, I went on a few expeditions to sites where eggs were laid around the city. I recorded their preferences for certain plant species and conditions, learning that they largely prefer to lay on the underside of tree branches or other surfaces, rather than vertical surfaces. This is most likely for the shelter that a more horizontal angle offers.
Then, in late January, the egg masses in the lab began to hatch, several months earlier than they would have in the wild. After conducting these experiments (and a few others along the way) I observed a few key pieces of information. I observed that they have some preferences for what surfaces they like to lay on, and at what angle. I observed that the adults infest some species of trees far more than others. I observed that the heat exposure of being indoors for those first months of early winter appears to be a temperature cue to hatch, meaning that if they spread to a climate that is warmer during the winter, they could hatch and mature much earlier in the year.
Researching invasive species is important, as we can help slow the progress of environmental crises like this one. Ultimately, however, we must remember that it was human movement that brought them here, even if it was an accident.
Introduction
Spotted Lanternflies (SLFs) are a species of the order Hemiptera, also known as true bugs. They are closely related to cicadas, aphids, and leafhoppers, and much like these other members of their order they feed with mouths designed to pierce into plants and suck out the sap within⁴ . Spotted lanternflies are relatively large insects (about an inch long). This means that they make quick work of their plant food sources, causing significant injury and often the death of even the hardiest. This is why their arrival to new habitats, like the United States, presents a threat to our native flora. Considering the U.S. has nearly 900 acres of farmland⁵ , a new pest is quite troubling.
Spotted Lanternflies are native to China, arriving in Pennsylvania on a shipment of rocks in September of 2014. They have since spread to 14 states¹; Connecticut, Delaware, Indiana, Maryland, Massachusetts, Michigan, New Jersey, New York, North Carolina, Ohio, Pennsylvania, Rhode Island, Virginia, and West Virginia. They arrived in New York City in July of 2020. Their life cycle is as follows; the eggs hatch in May or June, live through several nymph stages until they are mature flying adults in July, by November they lay eggs and start the cycle all over again. I became aware of them the following summer, and when I was deciding what to research for my Independent Science Research project they quickly came to mind. I knew I wanted to study an invasive species, and the effect of this particular organism was unfolding in real time. This made it a pertinent area of research. Additionally, the study of these insects is much easier in a city setting. While there are significant infestations in our city’s parks, they are quite easy to examine up close on, for example, a sidewalk tree. This would not be possible in a more rural environment, or behind the fences walling farmland. This was specifically useful because I was often observing well-camouflaged egg masses high in the tree canopy
Materials and Methods
Phase 1:
I wanted to test if Spotted Lanternflies have a preference for what texture or color of surface they lay on. I set up two bug enclosures; the first one with two smooth paper panels, one brown one white, to test color preference. I chose brown and white because egg masses are bright white when laid and then shift to a gray-brown as they mature. The second bug enclosure had two panels; one was smooth paper, the other was covered with bark collected from a London Plane tree. This was to test texture preference.
I collected live Spotted Lanternfly adults, mostly from a wild grape vine on the corner of Middagh & Willow street. I caught them using a butterfly net, a small plastic box, and my hands. The insects were relatively slow, as they were reaching the end of their life cycle as the weather got colder. I collected these insects in groups of five to seven at a time. I then brought them to
the enclosures and released them inside. I tried to collect mostly females that looked like they were about to lay eggs, meaning that they had a larger and more pronounced abdomen than usual. I also collected a few males and a small ailanthus plant to give the semblance of normal surroundings for the insects.


Phase 2:
I went on multiple walking trips to various locations around the city; one to Prospect Park, two to sidewalk tree infestations, one to a backyard, and one to a dog park. I used binoculars to better see the egg masses. I collected data concerning the tree species, the bark roughness, the height from ground, the bark color/ laying site color, and the orientation of the egg mass. This also gave me a chance to better understand what egg masses look like at all stages of development.
Phase 3:
I dissected several of the adults after they had passed away in the enclosures. I used a dissection microscope, tweezers, and dissection scissors.

Phase 4:
I was curious to see what environmental trigger causes egg masses to hatch. I set up my bug enclosures from earlier in the research process to test how several factors affected the hatching process. There were four sections in the three cages (one larger one holding two sections), as pictured:
Figure 1 is light no heat (the control), Figure 2 is heat and light, Figure 3 is heat no light (the heat is provided by the heat lamp pictured above, the black box within the larger cage is a crate with black cloth draped over it), and Figure 4 is Extended light no heat (a light on a timer of 5:00 AM to 7:00 PM lengthens the day to replicate the light exposure of their normal hatch time of late spring). There were approximately eight good condition egg masses in total on the tree limbs pictured here, two in each experiment. Two were laid in the lab by adults collected by me, the rest were obtained from a local arborist. I recorded the temperature next to the egg masses in each experiment each day until hatching.

Results
Note: Some of the graphs only contain data collected from Prospect Park. This is because it was the trip with the greatest number of sites and data to compare.


Discussion
Phase 1:
Spotted Lanternflies are voracious eaters, and unfortunately this meant that the one plant I placed in the enclosure was not enough to keep them alive for more than a few days. Nearly all died before laying. In the end, only two laid egg masses in the enclosures, both on the London plane bark of the texture enclosure. This reflects what I observed in the field, that a preferred laying site seems to be a bark with some texture, rather than a completely smooth surface. This does not necessarily mean that they won’t lay on many different surfaces, but if a better one is available they will choose it.
This phase really assisted me in becoming more familiar with the anatomy and behavior patterns of the species. The more time I spent with them, the easier it was to tell if they were male or female, about to lay eggs, or about to spring into the air and away from my net.

Phase 2:
From my walking expeditions I observed several things. The first is that the Spotted Lanternfly’s favorite tree species by far to lay on is the Ailanthus, or Tree of Heaven. This is an invasive species of tree that is already quite established in Brooklyn, and it also originally comes from China. In my analysis of the lanternfly’s relationship with certain tree species, I observed a phenomenon wherein the lanternfly would lay egg masses on a tree with a vine nearby Vines are much easier for nymphs to feed from, as they are softer and easier to puncture. You’ll often find nymphs feeding on young plants and vines rather than adult trees because of this. Whether the laying adults intentionally placed their future nymphs near a suitable food source, or were simply feeding on the vine and chose to lay close by I cannot say Both options are possible.

Another observation that I made was that in nearly 90% of the data I took, the egg masses were laid on the underside of tree branches rather than the trunk. This is most likely to provide protection against weather conditions. I also found that at two different sites that I surveyed (one in a backyard, one on a private sidewalk tree) there were masses laid on the underside of brownstone window sills. In at least one of the instances, I could directly observe that the trees nearby were either too crowded with masses or too far away to reach for tired, end of the life cycle adults. This is an issue distinct to the sidewalk sites, in that there is often a very low density of trees and plants to lay on. The windowsill was close by, and it was available real estate.
In terms of height that the insects laid from the ground, there was no discernable pattern. Generally, if the tree was taller, egg masses were laid higher off the ground and up into the canopy, but it was also difficult for us to confirm this as we could only see so much with our binoculars. There were also sites with tall trees and eggs laid barely off the ground. The bark color of the laying sites, as we observed, was often more on the gray side of brown, like the bark of the Ailanthus tree. I never observed an egg mass laid on a white surface to match the early stage egg mass.

Overall, these field examinations let me observe how spotted lanternflies lay their eggs; there is often one preferred tree, often an Ailanthus, that the adults had been feeding off of, and then when it comes time to lay they lay right on that tree. The trouble is that these insects live in great numbers, and there is never enough space for everybody. So, the egg laying adults clumsily fly to the surrounding trees (or window sills, or rock, or a number of other recorded surfaces) and lay there instead, in less concentrated clusters of egg masses. This makes it apparent, with practice, which tree was the one that might have first drawn them to this area.
Phase 3:
When dissecting the deceased specimens from our enclosures, we observed that a female that had already laid an egg mass had residue on the rear of her abdomen that appeared to be the egg mass adhesion substance. This was interesting to note because it provides a way to tell if a female has already laid without opening up her abdomen.

Phase 4:
Almost immediately after the set up of our entire heat and light exposure factor experiment, egg masses began hatching with no discernible distinction of which section they were part of. The masses had been inside our warm lab classroom for a few months, and the first to hatch was one of the egg masses laid in our lab (the other one never hatched, I’m not sure why). The rest were soon to follow in the coming few weeks. The first hatched on January 20th, 2023, and was laid on October 11, 2022. This January hatch date is four to five months earlier than they hatch in the wild. The nymphs showed no signs of maldevelopment, they even jumped and hid, exhibiting a strong survival instinct.
This shows that the egg masses most likely rely on a temperature cue to hatch, and this is concerning. If the Spotted Lanternflies are able to hitchhike farther south, to regions of the United States and other countries where the winters are milder or nonexistent, these insects could potentially hatch much earlier in the year, mature much earlier in the year, and do even more damage. To slow their spread, we need to instead spread information about their presence, so that actions can be taken to prevent further migration. What I learned most of all from this research project is that invasive species are living organisms. In the case of the Spotted Lanternfly, it is our fault as humans that they are here and damaging other species. It is our responsibility to try and undo what we’ve done, and to be more careful in the future regarding the haphazard and often destructive organism exchange that we have facilitated across the globe. We shouldn’t have to squish bugs.
References:
1. USDA APHIS | Spotted Lanternfly
2. Oten, Kelly, Spotted lanternfly confirmed in North Carolina | NC State Extension.
3. Virginia Tech, Virginia State University, Virginia Cooperative Extension, Spotted Lanternfly in Virginia
4. Cornell CALS, Spotted Lanternfly Biology and Lifecycle | CALS
5. USDA, Farms and Land in Farms - 2021 Summary February 2022
Melody and Memory: Music Therapy in Alzheimer’s Care
Kamala G.Mentor: Teresa C.
Abstract
Dementia is the general term for a condition that leads to the unnatural loss of cognitive function as one ages. Symptoms of dementia include memory loss, confusion, difficulty speaking or expressing thoughts, impulsive behavior, loss of interest in activities, and hallucinations. Alzheimer’s disease, which is the most common form of dementia, affects roughly 10.7% of the US population aged 65 or older. The amyloid hypothesis–one of the leading hypotheses for the cause of AD–proposes that AD is caused by the excessive buildup of amyloid beta and phosphorylated tau proteins, leading to neuron death and brain atrophy. This paper reviews current literature—including studies, reviews, and meta-analyses—focused on the efficacy of music-based interventions (MBIs) in AD and dementia care. Music has shown potential in both preventing and mitigating the effects of dementia. Studies have shown, for example, that musicians were 64% less likely than non-musicians to develop mild cognitive impairment or dementia, and MBIs can alleviate some symptoms of dementia, including cognitive decline, mood, and lack of sleep. Music therapy is the clinical and therapeutic application of music to accomplish individualized goals ranging from psychosocial development to physical rehabilitation. Currently, research on the efficacy of music therapy varies, with some studies reporting weak findings while others report positive outcomes relating to mood, sleep, cognition, and general quality of life. Through literature research, as well as direct observation and participation in actual sessions, this paper discusses the efficacy of music therapy in AD care in the following categories: cognitive function (memory and speech), behavioral and psychological symptoms of dementia, physical function, and social function. While music therapy can improve symptoms of AD and quality of life, there is a lack of evidence to support an increase in general daily function and independence in AD patients. In the future, however, MBIs may be able to incorporate emerging therapies, like gamma-frequency sensory stimulation–which has demonstrated an ability to modify AD in mouse models–and increase their efficacy in treating AD patients.
Introduction
Dementia is the general term for a condition that leads to the unnatural loss of cognitive function as one ages. Symptoms of dementia include memory loss, confusion, difficulty speaking or expressing thoughts, impulsive behavior, loss of interest in activities, and hallucinations. While approximately one third of people aged 85 or older may have some form of dementia, it is an abnormal aging process.1 The four main diagnosable types of dementia are frontotemporal dementia, Lewy body dementia, vascular dementia, and Alzheimer’s disease (AD), the focus of this paper. Forms of dementia can also coexist in a condition called mixed dementia.2 This paper discusses current AD research and the potential use of music therapy and music-based interventions to mitigate symptoms or even treat AD.
Frontotemporal dementia impacts cognition due to neuron damage in the frontal and temporal lobes of the brain. It is rare, mainly affecting people between the ages of 45 and 64.3 Lewy body dementia affects over a million Americans and is characterized by the buildup of alpha-synuclein protein deposits. These deposits, called Lewy bodies, lead to the loss of the neurotransmitters acetylcholine and dopamine. Symptoms include visual hallucinations, changes in focus, and cognitive decline.4 Vascular dementia is caused by damage to blood vessels in the brain, impeding blood and oxygen flow, and changes in the white matter of the brain. These changes, often visible on magnetic resonance imaging (MRI) scans, impact memory, cognition, and behavioral patterns.5 Researchers have recently discovered another type of dementia, limbic predominant age-related TDP-43 encephalopathy (LATE), in brain autopsies, but are yet to diagnose the condition in a living person.1
Alzheimer’s Disease
As of 2022, 10.7% of the US population aged 65 or older, roughly 6.5 million people, suffer from AD.6 Once diagnosed with AD, patients have an average lifetime expectancy of four to eight years. However, the disease does not have a set course, and some might suffer from AD for up to 20 years. AD is a particular concern given the phenomenon of population aging: when the number of people 65 and older steadily increases relative to the number of people 64 and younger. This process is mainly due to a decrease in fertility as well as a reduction in mortality rates for the elderly. By 2030, a projected 74 million Americans will be 65 or older, meaning that roughly one in five Americans will be elderly. By 2060, a projected 13.8 million elderly people will have AD.7
AD research and awareness have substantially increased in the last forty years, and currently, AD is the seventh leading cause of death in the US. The number of recorded deaths from AD increased by 145.2% from 2000 to 2019. The cause for this increase is not only due to population aging, but also due to decreased death rates of other prevalent conditions in the elderly population, including heart disease and stroke, as well as the clinical advancements related to AD over the last twenty years.7
Onset and Progression of AD
The disease first appears in the lateral entorhinal cortex,8 a region of the brain central to learning and memory. After spreading through the cortex (the perirhinal cortex and posterior parietal cortex), the disease then spreads to the hippocampus–responsible for long-term memory formation. Degeneration first appears in the temporal and parietal lobes, the orbitofrontal cortex, and neocortical regions.9 One of the leading hypotheses about the cause of AD is the amyloid hypothesis, which proposes that AD is caused by the excessive buildup of the proteins amyloid beta (Aβ) and phosphorylated tau (tau), leading to neuron death and brain atrophy
The progression of AD involves several phases. The first phase, called the cellular phase, involves changes that can begin around 20 years before diagnosis (preclinical). During this phase of the disease, symptoms are not yet evident, but elevated Aβ and tau levels are detectable through positron emission tomography (PET) scans and cerebrospinal fluid tests. Aβ is a normal product of the breakdown of APP, a type I transmembrane protein found in tissues and organs throughout the body and the central nervous system. The enzymes β-secretase and γ-secretase
split APP into two peptide fragments: Aβ and soluble amyloid precursor protein (sAPP). Aβ, which is 37 to 49 amino acids long,10 is likely involved in neuron plasticity,11 repairing damage (including leaks in the blood-brain barrier), and maintaining synaptic activity.12 Imprecise γ-secretase cleavage of Aβ at the C terminus leads to the creation of Aβ42–the main component of amyloid plaques–and Aβ40. The relationship between these two isoforms plays an essential role in AD–an increased Aβ42/Aβ40 ratio serves as a catalyst for the disease.13 Aβ monomers can form into protofibrils, amyloid fibrils, and oligomers. Amyloid fibrils are large and insoluble, and can later form into senile plaques, a trademark characteristic of AD. Recent research suggests, however, that Aβ oligomers–smaller, soluble clumps of Aβ that spread throughout the brain–are more responsible for toxic changes in the brain that lead to cognitive decline.14 Changes in neurons, microglia, astroglia, neuroinflammation, vascular failure, and glymphatic dysfunction occur in tandem with the aggregation of Aβ. 15
Once the level of Aβ reaches a certain point, tau accumulation is triggered, and the microtubule-associated protein (MAP) tau begins to form into tangles.16 Tau, which has six isoforms, is normally responsible for stabilizing microtubules in neurons and maintaining the parallel structure of intracellular transport systems.17 Aβ causes increased tau protein kinase I (glycogen synthase kinase 3, or GSK3) activity, leading to increased phosphorylated tau. The phosphorylated tau then mostly likely undergoes conformational change and polymerization in order to form into paired helical filaments, which comprise the neurofibrillary tangles characteristic of AD. These tangles bind to metabolic proteins and might also sequester other MAPs, leading to cytoskeleton weakness and neuron death due to the loss of essential proteins.18

Figure 1. Hallmark characteristics of AD. This figure contrasts (a) a healthy brain with (b) a brain with severe AD, with the formation of tau tangles and Aβ plaques in individual neurons, and overall tissue shrinkage in the brain. Image (c) compares a model of a healthy brain with a brain with severe Alzheimer’s, demonstrating severe tissue loss. Image was adapted from [19, 20].
For many, the first symptoms of AD fall under the category of mild cognitive impairment, which occurs when brain damage due to the buildup of Aβ and tau overwhelms the brain to an extent that it can no longer function normally. Within the span of five years post-diagnosis, roughly a third of patients with mild cognitive impairment due to AD develop dementia.7 These first symptoms involve a decline in non-memory related cognition. The mild stage of the disease can cause wandering, lead to difficulty handling expenses, and personality shifts, including depression and apathy. The regions of the brain controlling reasoning, language, conscious thought, and sensory processing are damaged in the moderate phase of the disease, which leads to symptoms such as general confusion and memory decline, trouble recognizing people, inability to learn new skills, trouble with daily routines, hallucinations, delusions, and paranoia.19 This stage of the disease is normally the longest, lasting from 2-10 years. Late-stage AD, which can last from 1-5 years, is the final and most severe stage, during which patients can no longer live without significant assistance. At this point, brain tissue significantly shrinks, especially in the cortex, due to neuron breakdown from the spread of amyloid plaques and tau tangles.17 Patients struggle to communicate, lose most of their awareness, and become susceptible to infection.21
Risk Factors for AD
Age is the most significant risk factor for AD once one reaches the age of 65, the likelihood of developing AD doubles every five years,22 going from 5% at age 65 to 33.2% by age 85.7 Genetics also seems to play a role in the disease’s development. Around 1-6% of AD patients suffer from early-onset AD (EOAD), the form of the disease developed between the ages of 30 and 65. Most EOAD patients have familial AD, meaning that they have more than one family member in more than one generation with AD. The majority of these cases are inherited in an autosomal dominant pattern. Mutations in the genes presenilin-1 (PSEN1) and presenilin-2 (PSEN2) increase the Aβ42/Aβ40 ratio significantly, thus leading to increased Aβ accumulation and the onset of AD.20 Mutations in these genes almost guarantee the development of the disease, normally in the EOAD form.7, 23
The likelihood of developing late-onset AD (LOAD) also has a significant correlation to genetics; the risk of developing the Alzheimers is 60-80% related to heritable factors. Out of the thirty known mutations of the APP gene, twenty five are associated with AD and cause the increased accumulation of Aβ. The gene apolipoprotein E (APOE), on chromosome 19, has three isoforms; the APOEε4 allele can increase the risk of developing AD (both LOAD and EOAD) by 300 - 400%,15 while the APOEε2 allele is related to a lower risk of developing AD.20 Results based on racial and ethnic groups have also produced inconsistencies.7
Sex is another factor that affects one’s risk of developing AD, as women are more likely to develop AD than men. Around two-thirds of Americans with AD are women. This difference is likely due in part to the fact that women on average have a longer lifespan than men, thus leading to a greater lifetime likelihood of developing AD Women are also 1.7 times more likely
than men to have a high tau burden, and thus a heightened AD risk. The gene that codes for the enzyme ubiquitin-specific peptidase 11 (USP11) is located on X chromosomes. USP11 removes the protein tag ubiquitin, which marks proteins to be degraded, from certain proteins, including tau. The lack of ubiquitin allows these proteins to aggregate. USP11 is one of the roughly 10-20% of genes not affected by X inactivation, meaning that women have two copies of this gene, and thus have an increased likelihood of tau accumulation.24 Other factors contributing to the increased risk for women are still unclear, and studies currently have mixed results.
People with trisomy 21 (Down syndrome) also face an elevated risk of AD because the APP gene is located on chromosome 21. This extra chromosome 21 in people with Down syndrome usually heightens the production of Aβ, often leading to EOAD. Around 30% of people in their 50s with Down syndrome AD, and close to 50% of people in their 60s with Down syndrome have AD.25
Environmental factors and comorbidities can also impact one’s risk for developing AD. Air pollution has been shown to damage one’s frontal cortex. Exposure leads to oxidative stress, neuroinflammation, increased Aβ42, and thus neurodegeneration. It is also linked to respiratory and cardiovascular diseases. Certain metals may also increase risk. For example, lead and cadmium can cross the blood-brain barrier and have been associated with heightened Aβ levels. For many years, it was believed that aluminum could cause AD, but concrete evidence for this theory is yet to emerge.
Diet is another important risk factor which researchers have recently begun to focus on while taking antioxidants, vitamins, polyphenols, and fish decrease AD risk, ingesting saturated fat and excess calories increases risk. The processing of these foods degrades crucial nutrients while producing toxic byproducts, like advanced glycation end products (AGEs), which can lead to oxidative stress, neuroinflammation, and neurological damage.20 Cardiovascular conditions increase the likelihood of the presentation of AD (due to Aβ and tau), but can be mitigated by a healthy diet, and regular exercise, among other factors.
Lifestyle interventions are key to reducing one’s risk of developing AD. An observational study involving 2765 participants evaluated five lifestyle factors that promote health: at least 2.5 hours of moderate-to-vigorous physical activity, not smoking, the adoption of the Mediterranean-Dietary Approaches to Stop Hypertension Intervention for Neurodegenerative Delay diet, and the maintenance of intellectual engagement through late-life cognitive exercise. Researchers concluded that people who maintained two or three of the healthy lifestyle factors had a 37% decreased AD risk, and people who maintained four or five healthy lifestyle factors had a 60% decreased AD risk, compared to people who maintained none or only one of the healthy lifestyle factors.26, 27
Traumatic brain injuries (TBI) are also risk factors for AD. Mild TBI and AD both lead to cortical thinning, causing memory loss, decrease in verbal fluency, and decrease in information processing. Within the first year of experiencing a TBI, the likelihood of being diagnosed with dementia is four to six times higher than in people without TBI. However, TBI can impact dementia risk even 30 years after occurance. Seniors who experience moderate TBI throughout their lifetime (commonly due to sports like football, boxing, soccer, and hockey) have a 2.3 times greater risk than older adults who have never had TBI this risk is 4.5 times greater when the regular TBI are severe.28
Diagnosis of AD
Diagnosing AD is a multi-step process. Health care providers initially review patients’ medical history, including psychiatric, psychological, and family history, as well as medication information. Blood or urine samples are tested to rule out other conditions with similar symptoms to dementia, like thyroid issues and vitamin deficiencies.29 A mood test is conducted to rule out mental health disorders, like depression, that present similar symptoms. Neurological tests are then used to evaluate speech, coordination, balance, muscle tone, reflexes, and hearing. Cognitive, functional, and behavioral tests are used to assess memory, problem-solving skills, thinking ability, focus, and executive function. These tests are meant to evaluate whether cognitive limitations impact the patient on a daily basis or in a significant manner.
An emerging diagnostic tool is the assessment of specific biomarkers–such as Aβ, hyperphosphorylated tau, and neuronal injury–through brain imaging, cerebrospinal fluid (CSF) taps, and blood tests. Biomarkers can be used to identify the disease in its early stages, and can be measured and standardized through highly precise automated assays.30

MRI scans or computed tomography (CT) scans can rule out tumors, strokes, fluid buildup, or other brain damage that might cause similar symptoms to AD. MRI scans, which use radio waves and have magnetic fields, can also be used to see if brain tissue has shrunk. MRI scans are preferred to CT scans (which generate cross-sectional images of the brain through X-rays) for the diagnosis of AD.30 PET scans use radioactive tracers to view specific areas of the brain; both amyloid and tau PET scans, which test for the abnormal burden of Aβ and tau, respectively, are used mainly in research settings. Fluorodeoxyglucose PET (FDG-PET) scans show areas of low glucose metabolization, a sign of dementia, and can be used to differentiate between frontotemporal dementia and AD.31 Amyloid PET scans, while able to detect the presence of AD, are unable to provide information about the severity of the disease and cognitive ability compared to tau PET scans and FDG-PET scans.32
CSF is the fluid that insulates, protects, and nourishes the brain and spinal cord. The three CSF biomarkers used to diagnose AD are Aβ42, phosphorylated tau (referred to as p-tau),
Figure 2. Brain PET sc low amyloid and tau and the middle and tau, but not at the threshold of AD. The image on the right depicts levels of amyloid and tau past the threshold of healthy, leading to an AD diagnosis.33and total tau (referred to as t-tau). Abnormal Aβ42 levels are detectable in the CSF before they are visible on amyloid PET scans. Typically, a 50% decrease in Aβ42 concentration is the level of Aβ42 that indicates AD, as it signifies that Aβ42 has accumulated in the functional tissue of the brain. However, Aβ42 CSF levels alone are not accurate enough to lead to a diagnosis of AD; a 200% increase of p-tau concentration and 300% increase of t-tau concentration also evidences AD.29 The CSF Aβ42/Aβ40 ratio can also provide more information than levels alone Aβ42; Aβ40 is the most abundant amyloid peptide in CSF and does not show significant change during the development of AD, and can be used to reliably normalize Aβ42. The three main CSF biomarkers have shown a diagnostic sensitivity of 95% to predict AD in its prodromal phase and identify AD as opposed to regular mild cognitive impairment (MCI) and other dementias.34
While blood is a more accessible medium for biomarkers than CSF, which is accessed through a lumbar puncture, biomarkers exist in very low concentrations in blood, and plasma proteins are likely to interfere with their measurement. The Aβ42/Aβ40 ratio in plasma has been shown to correlate with CSF and PET biomarkers, with a decrease of 14.3% in subjects with amyloidosis. Plasma levels of axonal neurofilament light (NFL) proteins also predict neurodegeneration, cognitive decline, and familial AD roughly 6.8 years before the onset of symptoms, but have a low specificity. Aβ42, p-tau, t-tau, and lactoferrin, have been proposed as possible AD biomarkers in saliva, a bodily fluid easily accessed through non-invasive procedure.31 Synapses and presynaptic proteins also have potential as biomarkers for AD. Unlike Aβ and tau, synaptic impairment and degeneration directly leads to cognitive impairment, and the measurement of levels of proteins such as the presynaptic vesicle proteins synaptotagmin and rab3a, the presynaptic membrane protein SNAP-25, and the dendritic protein neurogranin might be used to measure the effectiveness of potential AD drugs.
Current Treatments for AD
Most treatments developed for AD aim to treat the symptoms of the disease as opposed to modifying it. In the early stages of the disease, cholinesterase inhibitors, such as galantamine, rivastigmine, and donepezil, work to mitigate cognitive and behavioral decline.35 Current research has shown that this is most likely due to their prevention of the decomposition of acetylcholine, a neurotransmitter chemical that affects muscle movement, normal body function, learning, memory, and focus.36 In later stages of the disease, patients are prescribed memantine, an N-methyl D-aspartate (NMDA) receptor antagonist. People with AD disease have too much glutamate, a neurotransmitter which passes calcium to neurons, leading to excess calcium and an increased speed of cell death. Memantine blocks overactive NMDA receptors in order to decrease glutamate levels, and is used to slow decreases in quality of life for people with severe AD. Cholinesterase inhibitors and memantine can be used in tandem to slow cognitive decline.37
Out of the many trials of disease-modifying drugs currently in progress or development, two drugs aiming to reduce Aβ buildup have received widespread coverage. Aducanumab (Aduhelm) is an IgG1 monoclonal antibody administered through intravenous infusion that targets Aβ aggregates. In 2019, two highly similar clinical trials of Aduhelm that began in 2015 were halted after an independent monitor committee determined that the drug had no benefit.38 Biogen later concluded that in one of the trials, high Aduhelm dosage slowed cognitive decline, but only very slightly The Clinical Dementia Rating Sum of Boxes (CDR-SB)
score is an outcome measure scored on a 18-point scale, with 6 sections of even weight used to measure the cognitive abilities and functions of drug trial participants. A score of 0.5 to 6 indicates an early stage of AD, with a higher score indicating a worse condition. Aduhelm participants had on average a score decrease of 0.39. 40% of trial participants developed swelling or bleeding in their brains, in some cases so severe that they ended their trial participation. A total of 6% of total participants of both trials dropped out of the trials before they were shut down.39 Despite these findings, Biogen met with the FDA to renew development of Aduhelm two months after the trials ended, ultimately leading to its accelerated approval in 2021, the first FDA approval of an AD drug since 2003. An 18- month investigation by the House Energy and Commerce Committee and the House Committee on Oversight and Reform concluded in late December of 2022 that the approval process for Aduhelm had been faulty.40 Biogen is also partially funding lecanemab, a humanized IgG1 monoclonal antibody that targets Aβ protofibrils sponsored by pharmaceutical company Eisai. The conclusions of the phase 3 trial were published in the New England Journal of Medicine in late November of 2022. On January 6th of 2023, the FDA approved lecanemab, or Leqembi, through the Accelerated Approval pathway.41 Enrolled in the trial were 1795 people with early AD between the ages of 50 and 90 with an average CDR-SB of 3.2. 898 participants received lecanemab and 897 received a placebo. The adjusted average difference from CDR-SB score at start was 1.21 among participants receiving lecanemab and 1.66 among participants receiving the placebo. 14% of the lecanemab recipients and 11.3% of the placebo recipients experienced serious adverse effects, most commonly infusion-related amyloid related imaging abnormalities (ARIA). 12.6% of lecanemab recipients experienced edemas (ARIA-E) and 17.3% of lecanemab recipients experienced hemorrhaging (ARIA-H). 6.9% of lecanemab recipients discontinued the trial due to adverse reactions.42 While in recent years, disease-modifying drugs have demonstrated potential, their efficacy is questionable and their approval controversial.
Music-based Interventions in AD Care
Music, a cognitively stimulating activity, has shown potential in terms of both preventing and mitigating the effects of dementia. A twin study found that, after accounting for sex, education, and physical activity, musicians were 64% less likely than non-musicians to develop MCI or dementia. On cognitive assessments, musicians in general had a 29% higher likelihood than non-musicians of performing cognitively in or above the 90th percentile; and musicians who play frequently were found to have the best cognition, with an 80% higher likelihood than non-musicians of performing in or above the 90th percentile.43 This suggests that music can decrease one’s likelihood of developing dementia, and studies have shown that it can also benefit those who have dementia.
Music-based interventions (MBIs) have been used to alleviate symptoms of dementia, including cognition, mood, and sleep. One particular form of MBI is music therapy, which is the clinical and therapeutic application of music to accomplish individualized goals ranging from psychosocial development to physical rehabilitation. Music therapists use musical activities and interactions to foster interaction, enthusiasm, and confidence; the American Music Therapy Association listed some of their “healthcare and educational goals” as “promot[ing] wellness, manag[ing] stress, alleviat[ing] pain, express[ing] feelings, enhanc[ing] memory,” and “improv[ing] communication.”44 These activities can be receptive musical activities (listening to
music) or active musical activities (making music). Receptive music therapy is mainly used as a method of relaxation and as a form of reminiscence therapy, a therapeutic intervention for Alzheimer’s that uses prompts to discuss a patient’s past. Active music therapy is used to promote a positive mindset and an increase in the self-confidence of the patients.45 Currently, research on the efficacy of MBIs varies, with some studies reporting weak findings while others reporting positive outcomes relating to mood, sleep, cognition, and general quality of life.46 There are several different types of memory, with which music and AD have different and complex relationships. Memories can be characterized as either short-term or long-term. A key form of short-term memory is working memory, which is the momentary recollection of something during the duration of a task. The prefrontal cortex is responsible for short-term memory; in particular, based on MRIs, scientists believe that the left side of the prefrontal cortex is responsible for the verbal aspect of working memory while the right side controls spatial working memory. Long term memory falls into two broad categories: explicit memory, which is conscious recollection, and implicit, which is the unconscious influence of past experiences on one’s behavior. Explicit memory can be either episodic, which is the recollection of specific events, or semantic, which is the recollection of facts, definitions, and information. Episodic memories form in the hippocampus, with general knowledge information transferred from the hippocampus to the neocortex during sleep. The amygdala is responsible for maintaining the emotional significance of memories as well as generating new, fear-based memories, as clear from studies on patients with post-traumatic stress disorder and anxiety. Implicit memory can be procedural, which is the recollection of motor-related skills, or can be linked to priming, which is the connection of different concepts over time.47 The main regions of the brain associated with memory are the amygdala, the hippocampus, the cerebellum, and the prefrontal cortex. The basal ganglia are responsible for the coordination of motor skills, while the cerebellum is responsible for fine motor skills.48 Memories are formed through the reactivation of patterns of neurons, which happens due to synaptic plasticity, which are the changes that take place at synapses.49 Memories are initially fragile, but are strengthened through the process of memory consolidation.50 When a certain pathway experiences frequent reactivation, it is strengthened and has long-term potentiation.51 The ability for one to retain new knowledge peaks in one’s twenties.52 After that, the ability to remember new knowledge declines, with a loss of 5% of neurons in the hippocampus every decade.53 There are several different types and aspects of musical memory, and each of these systems relates to a different area of the brain. Episodic musical memory has been found to have some basis in the temporal cortex, the medial and lateral prefrontal cortices, the superior temporal sulcus, the superior temporal gyrus, and the auditory cortex.9 Musical memories, particularly implicit musical memories, have been found to be very well preserved even in the late stages of AD. Long-term musical memories were found to be encoded in the caudal anterior cingulate gyrus and the ventral pre-supplementary motor area. FDG-PET scans have shown that these regions of the brain do not experience severe cortical atrophy and disrupted glucose-metabolism. (These regions, however, have relatively similar levels of Aβ accumulation compared to the rest of the brain).9
Figure 3. Regions of the brain encoding long-term musical memories do not overlap with regions of damage from AD. Regions of the brain that encode long-term musical memories (outlined in white) experience minimal atrophy or hypermetabolism relating to AD. Warmer colors represent more significant brain damage due to AD 9

Materials and Methods
Research for this project was primarily conducted through a literature review using papers available on PubMed and Google Scholar. Key search terms included “Alzheimer’s,” “dementia,” “music therapy,” “music-based interventions,” “cognitive function,” “anxiety,” “depression,” “brain,” and “study.”
The second aspect of this project involved direct observations of group music therapy at the Memory Care Unit of the senior residence The Watermark at Brooklyn Heights, interviews with music therapists leading the sessions, and weekly flute performances of familiar tunes, folk songs, and popular music (like songs by The Beatles). The music therapists hold sessions once a week for 1.5 hours. Around 10 residents participate each week; there are some consistent participants but no fixed group. The goals are measured qualitatively, based on how people respond in situations over time. They can be broken up into four categories relating to the symptoms of AD. The questions asked to the music therapists were:
1. What is your music therapy training/background?
2. What are the goals of music therapy treatment for The Watermark residents?
3. What are the techniques that you use, and do you use any specific methods when working with AD/memory care patients?
4. How do you measure the progression of your patients?
5. What non-music techniques do you use in sessions?
NOTE: The Watermark at Brooklyn Heights is a very “cultivated” environment compared to other environments in which the music therapists have worked. It is a high-end facility, with ample space, peace, and attention given to each resident. In less advantaged communities, elderly members of the community have the option to attend a day habilitation/social adult daycare facility. At locations like these, there are often 20 to 50 people in a group, therapy sessions take
place in the open, without a quiet atmosphere, and often have the additional goal of providing a sense of peace and “focus” to the recipients.
Results and Discussion
Music Therapy and Cognitive Function
Studies on the effects of music therapy (with a trained music therapist) and MBIs (which can involve a variety of musical activities, sometimes integrated into therapeutic practices) are generally inconclusive because of the lack of standardization of methodology. Differences between studies include varying genres of music, levels of individualized music selection, types of interaction with recipients, and musical formats.45 Several studies and meta-analyses have reported weak or inconclusive results in support of music therapy in AD care, while others have produced positive results.46 A meta-analysis of four studies focused on the cognitive effects of music therapy in AD care found a mean effect size of 1.56 (with a confidence interval of 95%), where an effect size of 0.2 was small, an effect size between 0.2 and 0.6 was considered medium, and 0.6 and above was considered large.45 A study among 201 Japanese adults with MCI found that hour-long music-making groups over a period of 40 weeks led to an improvement in scores on the Mini-Mental State Examination (MMSE), a cognitive function test that evaluates orientation, attention and concentration, memory, and language and motor skills. The highest possible score is 30, with a normal score being 25 or above and a score of 24 or below considered abnormally low. People who participated in the weekly musical instrument session had a mean change of .46 (standard deviation of 2.1) on the MMSE, compared to a mean change of -.36 (standard deviation of 2.3) in the control group.54 Another study, in Spain, which involved 42 patients with a mild to moderate form of dementia based on CDR scores, also used the MMSE to analyze change in cognitive function. In this study, participants attended twelve music therapy sessions (designed by two music therapists) that each lasted for 45 minutes and took place twice weekly over a period of 6 weeks. Patients with mild dementia began with a mean MMSE score of 18.33 (standard deviation of 5.84) and ended with a mean MMSE score of 22 (standard deviation of 4.64). Patients with moderate dementia had a mean MMSE score of 12.5 (standard deviation of 3.02) before the start of the study and ended with a mean score of 17.88 (standard deviation of 4.03). This study determined that its findings are in line with research on music’s activation of networks key to brain plasticity and right hemisphere pathways associated with communication and comprehension. However, it also highlighted the lack of evidence relating to long-term changes in cognitive improvement and the lack of an improvement in the functional dependence of patients.55 A study focused on people with MCI combining exercise therapy with movement music therapy using repetitive rhythmic motions found that this combination led to an increased task-related concentration of oxygenated hemoglobin, especially in the medial prefrontal cortex. Frontal Assessment Battery (FAB) scores, which reflect frontal lobe function through the assessment of prefrontal-related tasks, also increased. Overall, this study found that the combination of exercise therapy and movement music therapy increased the functional connectivity of the prefrontal cortex, thus improving cognitive and executive function.56
Music Therapy and Behavioral/Psychological Effects
The effectiveness of music therapy to mitigate the behavioral and psychological symptoms of dementia (BPSD) has been assessed by several studies and meta-analyses. One systematic review found that out of 7 included studies, the majority found an improvement in mood and in anxiety, depression, or both.57 A meta-analysis found that depression showed minimal signs of reduction directly after music therapy, but decreased after 6 months, demonstrating the potential for music therapy to be used as a treatment for long-term depression associated with dementia.58 However, other studies have found positive results directly after treatment. A study analyzing the effects of 30 minute music therapy sessions twice a week for 6 weeks found an immediate and consistent improvement in depression, particularly in participants with mild and moderate forms of dementia.59 The study on music therapy based in Spain found an improvement in anxiety and depression based on patients’ Hospital Anxiety and Depression Scale (HADS) scores, and also found an improvement in anxiety based on the Neuropsychiatric Inventory (NPI).55 A study on the effects of singing and listening to music on BPSD over a period of ten weeks found that listening to music improves behavior related to dementia, like agitation and disinterest, while singing was shown to especially improve physical presentations of depression, like weight loss and low energy.60 Another study on individual, receptive music therapy involving validation in AD care found that between the 4th week and the 16th week of treatment, anxiety and depression decreased, a positive change that lasted for up to 8 weeks after the last session.62
While studies, meta-analyses, and reviews have concluded positive results in terms of cognition and BPSD, MBIs have not shown a significant impact on daily function. In the Spanish study, scores on the Barthel Index, which is used to determine an individual’s level of dependency by evaluating their ability to complete basic daily tasks, did not show marked improvement. They explained that the participants’ level of dependency was so severe that it likely would have only improved after significant cognitive and motor rehabilitation.55 Another
 Figure 4. Changes in Neuropsychiatric Inventory scores within the groups (mild dementia and moderate dementia) before and after 6 weeks of consistent music therapy sessions, broken down by symptom.55
limiting factor in the research of music therapy is the lack of standardization in studies, such as differences in active music therapy vs. music listening, live vs. recorded music, selected vs. individual music, group vs. personal intervention, and classical/relaxation music vs. pop/native music.45 The lack of consistent practices in studies results in a lack of consensus on the effectiveness of music therapy in AD care.
Direct Observations
For this project, I interviewed two licensed music therapists who, as part of the music therapy program at the Brooklyn Conservatory of Music, lead group music therapy sessions in the Memory Care Unit of The Watermark at Brooklyn Heights. I observed several sessions led by each music therapist, and performed flute (mostly the Beatles, as well as other familiar tunes) for half an hour every week for several months. While I was unable to determine any change in anxiety and depression, I did notice an increase in verbal engagement throughout the music therapy sessions. Additionally, many of the songs in the music therapy sessions and several of the songs that I played on the flute prompted the entire group (normally around 8 people) to sing along loudly. While around one to two people fell asleep in each of the music therapy sessions, the majority of the group stayed engaged, playing simple rhythmic instruments and responding to prompts from the therapist. When I played the flute, independent of the music therapy sessions, the majority of the group would clap after each piece, and several would hum or sing quietly to the songs they knew. This behavior increased when the group was larger; several times, people fell asleep when the group was only two or three people. Almost the entire group would sing along loudly to classic tunes and folk songs like “Take Me Out to the Ball Game” and “This Land is Your Land.” After speaking with the music therapists, I was able to develop an understanding of the goals of their sessions and the effects that music has on the participating residents of the Memory Care Unit, and have summarized my understandings and observations in Table 1.
Table 1. Goals outlined by two music therapists working in the Memory Care unit of The Watermark at Brooklyn Heights, a senior living facility. Music therapists hold sessions once a week for 1.5 hours. Around 10 residents participate each week; there are some consistent participants but no fixed group. The goals are measured qualitatively, based on how people respond in situations over time. They can be broken up into four categories relating to the symptoms of AD.
GOALS & OBSERVED PRACTICES
Goal: By playing familiar songs to the recipients and involving them in the music, music therapists seek to promote happy memories and enthusiasm
MEMORY (COGNITIVE FUNCTION)
Observations:
● Trivia questions about songs and musical matching games give participants the opportunity to interact and recall memories.
○ When singing White Christmas, the music therapist plays a recording of the song and asks participants who performed it. Afterwards, he shows them a picture of the singer, Bing Crosby
SPEECH (COGNITIVE FUNCTION)
○ For example, every week Participant B repeats stories about the history of Brooklyn and musicians like Barbra Streisand and Neil Diamond. This prompts others in the group to speak.
○ Participants respond to recordings familiar to them (like Frank Sinatra’s rendition of New York, New York and Harry Belifante’s recording of The Banana Boat Song)
● People are likely to remember songs from their childhood/adolescence because those years are very formative Precomposed songs revive memories, help recipients process experiences, and prompt conversations
○ When I play Take Me Out to the Ball Game on the flute, everyone sings along.
○ When singing familiar songs like Jingle Bells, music therapists are silent during some verses to allow the participants to remember the lyrics themselves.
Goal: Through song, the music therapists seek to prompt speaking/interaction
Observations:
● The music therapists observe differences between sessions including that people who were catatonic and people with impaired speech begin to sing.
● Participants focus on the rhythm of the song and the chords when singing
Goal: By providing recipients with accessible and easy instruments, music therapists seek to promote movement and encourage excitement about the music, without recipients feeling like there is a risk of failure
Observations:
● People say, “I don’t have musical talent/background,” and have memories of music being something they quit. Because of this, music therapists pick instruments where people can be successful.
PHYSICAL
○ Tung drums (metal drums): in the key of c, which is often the most familiar key to people Music therapists sometimes transpose songs into the key of c to match the drums They are easy to play and there is no such thing as a wrong note
○ Shaker eggs: non-intimidating, lightweight.
● Physical reactions: people dance, stationary people move to beat, even with complicated rhythms and counter rhythms. Other reactions: closed eyes and tilted heads, facial expressions (dementia patients normally have slack facial expression)
● At the end of the session, one of the music therapists leads an exercise: shaking out hands, rolling out shoulders, moving heads side to side, taking deep breaths
Goal: By recreating precomposed songs with recipients, music therapists seek to stimulate social interaction, bring people into conversations, and create exchanges between recipients Music therapy supports emotional awareness, intragroup awareness, community building, and open discussions.
Observations:
● Promote socialization (music therapists don’t tend to interrupt conversations).
SOCIAL INTERACTIONS
● Try to steer things back to the music, especially when recipients are distressed (for example, when Participant A was getting used to moving into The Watermark)
● Conflicts are pretty mild At other facilities, people with dementia and mental health issues may have much bigger and more physical conflicts
● Music leads to smiles, looks of surprise, and the act of recognizing people around them. It can cut through the isolation often experienced by people with dementia. Involving dementia patients in the community around them can reduce the feeling dementia patients have of being stuck in their own heads
Neurobiological basis for MBIs for AD patients
Music and MBIs are connected to several neurobiological processes that might support their use as a therapeutic modality for AD patients. A study on the preservation of musical memory in AD patients examined blood oxygen level-dependent activations on functional MRI (fMRI) scans of healthy, young controls, analyzing the areas of the brain active during long-familiar songs, recently-heard songs, and unfamiliar songs. Researchers compared these to scans from probable AD patients (with positive Aβ and neurodegeneration biomarkers), and analyzed the scans for cortical atrophy, hypermetabolism, and Aβ deposits. Cortical atrophy and hypermetabolism related to AD had extremely minimal effects on the caudal anterior cingulate gyrus and the ventral pre-supplementary motor area (pre-SMA), regions of the brain found to encode implicit long-term musical memory.
MBIs are also viewed as effective mediums for clinical treatment because they engage patients, possibly due to the connection between auditory and reward networks, which lasts through the prodromal and MCI stage of AD. Positive reception of music from the superior temporal gyrus, an auditory region, leads to activity in the reward-related areas of the dopaminergic network, including the caudate, nucleus accumbens, insula, and amygdala. The connections between the auditory networks and reward networks are both functional and structural. Listening to familiar music leads to activity in regions of the brain related to reward circuitry, emotional processing, and auditory prediction (like the anterior cingulate cortex). One study proposed that this link could be used to change the behavior and increase motivation in AD patients, particularly through the use of MBIs with individualized music selections, which have been shown to be more efficacious than generalized practices.46
Music holds potential as a therapeutic modality for AD, especially when addressing problems relating to quality of life. These benefits can range from improvements in BPSD, interactions and social engagement, and the stimulation of long-term memories related to music. Additionally, the apparent preservation of implicit, long-term musical memories in AD suggests that music is an effective stimulant for AD patients. An appealing aspect of MBIs is that they are non-invasive and non-pharmacological, reducing the likelihood of negative side-effects, and easily adaptable to patients’ individual needs. Most studies, reviews, and meta-analyses suggest that there are little downsides to the incorporation of MBIs in an AD patients’ routine. Additionally, MBIs range from active music therapy, led by a professionally-trained music therapist, to receptive interactions with music through recordings, making the modality easily accessible. Research on the efficacy of MBIs, however, is still generally inconclusive, due to the lack of standardization of practices between studies. As a disease-modifying treatment, MBIs have also not shown significant efficacy in terms of improving the dependency and functionality of AD patients. While MBIs show promise as a measure to improve the quality of life of AD patients, on their own, they have not demonstrated significant potential to modify the course of the disease.
Developing Treatments for AD Involving MBIs
Despite the fact that MBIs might not be significantly and demonstrably efficacious on their own, a recent study combining non-invasive Gamma-frequency sensory stimulation with MBIs in animal models suggests that this combined treatment could lead to neurological and behavioral improvements. Researchers found that sensory (auditory and visual) stimulation at the frequency of 40 Hertz (Hz), corresponding with the Gamma rhythm in the brain, reduced
AD biomarker levels and improved cognitive and behavioral function in animal models of AD. In AD, the accumulation of Aβ disrupts neurons and decreases neuron synchronization, altering frequency bands in the brain (Alpha, Beta, Gamma, Delta, and Theta). The Gamma rhythm, a band of neural oscillation between 30-100 Hz sparked by “excitatory and fast-spiking inhibitory neurons,” is related to cognition, memory processes like encoding and retrieval, as well as short-term, working, and episodic memory.46 Some research has shown that irregular Gamma rhythm precedes and relates to Aβ accumulation, with both of these processes leading to further development of AD. Gamma-frequency optogenetic stimulation and Gamma-frequency visual stimulation have been shown to correct Gamma rhythm, reducing AD biomarkers and improving cognition.46 A study using mice with reduced and irregular hippocampus gamma rhythms (due to Aβ accumulation) found that Gamma-frequency optogenetic stimulation at 40Hz corrected the rhythm and reduced Aβ by around 50%. Stimulation led to the activation of microglia, which then cleared the Aβ aggregates.62 Another study on Gamma-frequency auditory stimulation over seven days using mouse models of AD found that the stimulation restored the Gamma rhythm, decreased Aβ deposits in the hippocampus and auditory cortex, and led to an increased functionality of the recognition and spatial memories of the mice.46 Music has potential in this sector, as both “natural music” and “rhythmic auditory stimuli” increase Beta, Gamma, Delta, and Theta frequency band activities. In particular, the musical meter of natural music corresponds with the frequency bands of Delta, and, at faster paces, Theta. Natural music, as well as auditory and acoustic rhythm, have also been shown to stimulate Beta and Gamma rhythms; during natural music, Beta activity increases, while high-Gamma activity changes depending on intensity and volume.46
The incorporation of Gamma-frequency stimulation into MBIs has the potential to correct Gamma rhythm and improve AD biomarker levels, neuronal and synaptic loss, and behavioral and cognitive function. There are still challenges involving the incorporation of Gamma-frequency stimulation into MBIs, including the fact that 40Hz is considered an unpleasant sound, and could be difficult to include in the practices of MBIs, which already involve sound. While research on this potential combined treatment, the effects of music on frequency activity, and the efficacy of Gamma-frequency stimulation in humans, is currently limited, these recent studies suggest that music does have future potential in the direct treatment of AD.46
References
1. U.S. Department of Health and Human Services. (2021, July 2). What Is Dementia? Symptoms, Types, and Diagnosis. National Institute on Aging. Retrieved October 30, 2022, from https://www.nia.nih.gov/health/what-is-dementia.
2. Alzheimer's Association. (n.d.). Mixed Dementia. Alzheimer's Disease and Dementia. Retrieved October 30, 2022, from https://www.alz.org/alzheimers-dementia/what-is-dementia/types-of-dementia/mixed-dementia.
3. U.S. Department of Health and Human Services. (2021, July 30). What Are Frontotemporal Disorders? Causes, Symptoms, and Treatment. National Institute on Aging. Retrieved October 30, 2022, from https://www.nia.nih.gov/health/what-are-frontotemporal-disorders.
4. U.S. Department of Health and Human Services. (2021, July 29). What Is Lewy Body Dementia? Causes, Symptoms, and Treatments. National Institute on Aging. Retrieved October 30, 2022, from https://www.nia.nih.gov/health/what-lewy-body-dementia-causes-symptoms-and-treatments.
5. U.S. Department of Health and Human Services. (2021, November 1). Vascular dementia: Causes, symptoms, and treatments. National Institute on Aging. Retrieved October 30, 2022, from https://www.nia.nih.gov/health/vascular-dementia.
6. Alzheimer's Association. (2022). Alzheimer's Disease Facts and Figures. Alzheimer's Disease and Dementia. Retrieved November 6, 2022, from https://www.alz.org/alzheimers-dementia/facts-figures.
7. Gaugler, J., James, B., Johnson, T., Reimer, J., Solis, M., Weuve, J., Buckley, R F., & Hohman, T J (2022). 2022 Alzheimer’s Disease Facts and Figures - Alzheimer's Association. Alzheimer's Association. Retrieved November 5, 2022, from https://alz.org/media/Documents/alzheimers-facts-and-figures-infographic.pdf
8. Columbia University. (2013, December 22). Study Shows Where Alzheimer's Starts and How it Spreads. Columbia University Irving Medical Center. Retrieved November 6, 2022, from https://www.cuimc.columbia.edu/news/study-shows-where-alzheimers-starts-and-how-it-spreads.
9. Jacobsen, J -H., Stelzer, J., Fritz, T H., Chételat, G., La Joie, R., & Turner, R (2015). Why musical memory can be preserved in advanced Alzheimer’s disease. Brain, 138(8), 2438–2450. https://doi.org/10.1093/brain/awv135
10. Chen, G., Xu, T., Yan, Y., Zhou, Y., Jiang, Y., Melcher, K., & Xu, H. E. (2017, July 17). Amyloid beta: Structure, biology and structure-based therapeutic development. Nature News. Retrieved November 15, 2022, from https://www.nature.com/articles/aps201728.
11. U.S. National Library of Medicine. (2022). APP Gene: MedlinePlus Genetics. MedlinePlus. Retrieved November 14, 2022, from https://medlineplus.gov/genetics/gene/app/.
12. Brothers, H. M., Gosztyla, M. L., & Robinson, S. R (2018, April 25). The Physiological Roles of Amyloid-β Peptide Hint at New Ways to Treat Alzheimer's Disease. Frontiers in Aging Neuroscience. Retrieved November 15, 2022, from https://www.ncbi.nlm.nih.gov/pmc/articles/PMC5996906/.
13. Gu, L., & Guo, Z. (2013, August). Alzheimer's AΒ42 and AΒ40 peptides form interlaced amyloid fibrils. Journal of neurochemistry Retrieved November 25, 2022, from https://www.ncbi.nlm.nih.gov/pmc/articles/PMC3716832/#:~:text=The%20imprecise%20cleavage,in%2n.d.%20brain.
14. Sengupta, U., Nilson, A. N., & Kayed, R. (2016, April). The Role of Amyloid-β Oligomers in Toxicity, Propagation, and Immunotherapy. EBioMedicine. Retrieved November 15, 2022, from https://www.ncbi.nlm.nih.gov/pmc/articles/PMC4856795/.
15. Scheltens, P., De Strooper, B., Kivipelto, M., Holstege, H., Chételat, G., Teunissen, C. E., Cummings, J., & van der Flier, W M. (2021). Alzheimer's disease. Lancet (London, England), 397(10284), 1577–1590. https://doi.org/10.1016/S0140-6736(20)32205-4.
16. National Institute on Aging. (2017, August 23). How Alzheimer's Changes the Brain. YouTube. Retrieved November 20, 2022, from https://youtu.be/0GXv3mHs9AU.
17. Alzheimer's Association. (n.d.). Brain Tour Part 2. Alzheimer's Disease and Dementia. Retrieved November 6, 2022, from https://www.alz.org/alzheimers-dementia/what-is-alzheimers/brain_tour_part_2.
18. Avila, J., Centro de Biología Molecular “Severo Ochoa” (CSIC-UAM), Lucas, J J., Pérez, M., Hernández, F., Address for reprint requests and other correspondence: J Avila, Zhu, B., & Mehler, M. F (2004, April 1). Role of Tau Protein in Both Physiological and Pathological Conditions. Physiological Reviews. Retrieved November 20, 2022, from https://journals.physiology.org/doi/full/10.1152/physrev.00024.2003?rfr_dat=cr_pub%2B%2B0pubmed&url_ver=Z39. 88-2003&rfr_id=ori%3Arid%3Acrossref.org#:~:text=tau%20aggregates%20are,of%20synaptic%20contacts.
19. U.S. Department of Health and Human Services. (2021, July 8). Alzheimer's Disease Fact Sheet. National Institute on Aging. Retrieved October 30, 2022, from https://www.nia.nih.gov/health/alzheimers-disease-fact-sheet.
20. Breijyeh, Z., & Karaman, R (2020, December 8). Comprehensive Review on Alzheimer's Disease: Causes and Treatment. MDPI. Retrieved January 24, 2023, from https://www.mdpi.com/1420-3049/25/24/5789.
21. Alzheimer's Association. (n.d.). Stages of Alzheimer's. Alzheimer's Disease and Dementia. Retrieved November 6, 2022, from https://www.alz.org/alzheimers-dementia/stages.
22. NHS. (2021, July 5). Causes - Alzheimer's disease. NHS choices. Retrieved January 24, 2023, from https://www.nhs.uk/conditions/alzheimers-disease/causes/.
23. Bateman, R J., Aisen, P S., De Strooper, B., Fox, N. C., Lemere, C. A., Ringman, J M., Salloway, S., Sperling, R A., Windisch, M., & Xiong, C. (2011, January 6). Autosomal-dominant Alzheimer's Disease: A Review and Proposal for the Prevention of Alzheimer's Disease. Alzheimer's research & therapy Retrieved January 24, 2023, from https://www.ncbi.nlm.nih.gov/pmc/articles/PMC3109410/.
24. Mayer, B. A. (2022, October 7). This May Be The Reason Why Women Are At Greater Risk Of Alzheimer's. Healthline. Retrieved November 25, 2022, from https://www.healthline.com/health-news/this-may-be-the-reason-why-women-are-at-greater-risk-of-alzheimers.
25. Alzheimer's Disease & Down Syndrome. National Down Syndrome Society (NDSS). (n.d.). Retrieved November 25, 2022, from https://ndss.org/resources/alzheimers.
26. U.S. Department of Health and Human Services. (2020, June 17). Combination of Healthy Lifestyle Traits may Substantially Reduce Alzheimer's. National Institutes of Health. Retrieved January 24, 2023, from https://www.nih.gov/news-events/news-releases/combination-healthy-lifestyle-traits-may-substantially-reduce-alzhei mers.
27. Bhatti, G. K., Reddy, A. P., Reddy, P. H., & Bhatti, J. S. (2020, January 10). Lifestyle Modifications and Nutritional Interventions in Aging-Associated Cognitive Decline and Alzheimer's Disease. Frontiers in Aging Neuroscience. Retrieved January 24, 2023, from https://www.ncbi.nlm.nih.gov/pmc/articles/PMC6966236/.
28. Traumatic brain injury (TBI). Alzheimer's Disease and Dementia. (n.d.). Retrieved January 24, 2023, from https://www.alz.org/alzheimers-dementia/what-is-dementia/related_conditions/traumatic-brain-injury
29. Mayo Foundation for Medical Education and Research. (2022, February 19). Alzheimer's disease. Mayo Clinic. Retrieved January 24, 2023, from https://www.mayoclinic.org/diseases-conditions/alzheimers-disease/diagnosis-treatment/drc-20350453.
30. Khoury, R., & Ghossoub, E. (2019, November 13). Diagnostic Biomarkers of Alzheimer's Disease: A state-of-the-art review ScienceDirect. Retrieved January 24, 2023, from https://www.sciencedirect.com/science/article/pii/S266614461930005X?via%3Dihub.
31. U.S. Department of Health and Human Services. (n.d.). How Biomarkers Help Diagnose Dementia. National Institute on Aging. Retrieved January 24, 2023, from https://www.nia.nih.gov/health/how-biomarkers-help-diagnose-dementia.
32. Yang, B. S. (2012, January 23). Lifelong Brain-stimulating Habits Linked to Lower Alzheimer's Protein Levels. Lifelong brain-stimulating habits linked to lower Alzheimer's protein levels | Research UC Berkeley. Retrieved January 24, 2023, from https://vcresearch.berkeley.edu/news/lifelong-brain-stimulating-habits-linked-lower-alzheimers-protein-levels.
33. Yang, S. (2016, April 11). PET Scans Reveal Key Details of Alzheimer's Protein Growth in Aging Brains Berkeley News. Retrieved March 7, 2023, from https://news.berkeley.edu/2016/03/02/pet-scans-alzheimers-tau-amyloid/
34. Zetterberg, H., & Blennow, K. (2018, July 26). Biomarkers for Alzheimer's disease: current status and prospects for the future. Wiley Online Library Retrieved January 24, 2023, from https://onlinelibrary wiley.com/doi/10.1111/joim.12816.
35. U.S. Department of Health and Human Services. (n.d.). How is Alzheimer's Disease Treated? National Institute on Aging. Retrieved January 24, 2023, from https://www.nia.nih.gov/health/how-alzheimers-disease-treated.
36. Encyclopædia Britannica, inc. (n.d.). Acetylcholine. Encyclopædia Britannica. Retrieved January 24, 2023, from https://www.britannica.com/science/acetylcholine
37. WebMD (n.d.). NMDA Receptor Antagonists and Alzheimer's. WebMD Retrieved January 24, 2023, from https://www webmd.com/alzheimers/guide/nmda-receptor-antagonists#:~:text=NMDA%20(short%20for%20N%2Dm ethyl,drugs%20may%20slow%20it%20down.
38. Johnson, M. (2022, December 29). House Investigation Faults FDA, Biogen for Alzheimer's Drug Approval. The Washington Post. Retrieved January 24, 2023, from https://www.washingtonpost.com/science/2022/12/29/alzheimers-fda-biogen-aduhelm/.
39. Belluck, P (2021, July 14). Cleveland Clinic and Mount Sinai won't administer Aduhelm to Patients. The New York Times. Retrieved January 24, 2023, from https://www.nytimes.com/2021/07/14/health/cleveland-clinic-aduhelm.html.
40. Belluck, P (2022, December 29). Congressional Inquiry into Alzheimer's Drug Faults its Maker and F.D A The New York Times. Retrieved January 24, 2023, from https://www.nytimes.com/2022/12/29/health/alzheimers-drug-aduhelm-biogen.html.
41. Commissioner, O. of the. (n.d.). FDA Grants Accelerated Approval for Alzheimer's Disease Treatment. U.S. Food and Drug Administration. Retrieved January 24, 2023, from https://www fda.gov/news-events/press-announcements/fda-grants-accelerated-approval-alzheimers-disease-treatm ent.
42. van Dyck, C. H., Swanson, C. J., Aisen, P., Bateman, R J., Chen, C., Gee, M., Kanekiyo, M., Li, D., Reyderman, L., Cohen, S., Froelich, L., Katayama, S., Sabbagh, M., Vellas, B., Watson, D., Dhadda, S., Irizarry, M., Kramer, L. D., & Iwatsubo, T (2023). Lecanemab in Early Alzheimer’s Disease. New England Journal of Medicine, 388(1), 9–21. https://doi.org/10.1056/nejmoa2212948
43. Walsh, S., & Brayne, C. E. (2021). Does playing a musical instrument prevent dementia? Alzheimer’s & Dementia, 17(S10). https://doi.org/10.1002/alz.049684
44. American Music Therapy Association (AMTA). (2005). What is Music Therapy?. American Music Therapy Association. https://www.musictherapy.org/
45. Vasionytė, I., & Madison, G. (2013). Musical intervention for patients with dementia: A meta-analysis. Journal of Clinical Nursing, 22(9–10), 1203–1216. https://doi.org/10.1111/jocn.12166
46. Tichko, P., Kim, J C., Large, E., & Loui, P (2020). Integrating music-based interventions with gamma-frequency stimulation: Implications for healthy ageing. European Journal of Neuroscience, 55(11–12), 3303–3323. https://doi.org/10.1111/ejn.15059
47. The University of Queensland. (2022, August 31). Types of Memory Queensland Brain Institute. Retrieved March 17, 2023, from https://qbi.uq.edu.au/brain-basics/memory/types-memory
48. The University of Queensland. (2018, July 23). Where Are Memories Stored in the Brain? Queensland Brain Institute. Retrieved March 17, 2023, from https://qbi.uq.edu.au/brain-basics/memory/where-are-memories-stored
49. The University of Queensland. (2018, July 23). How Are Memories Formed? Queensland Brain Institute. Retrieved March 17, 2023, from https://qbi.uq.edu.au/brain-basics/memory/how-are-memories-formed
50. Bisaz, R., Travaglia, A., & Alberini, C. M. (2014, October 3). The Neurobiological Bases of Memory Formation: From Physiological Conditions to Psychopathology Psychopathology Retrieved March 17, 2023, from https://www.ncbi.nlm.nih.gov/pmc/articles/PMC4246028/
51. The University of Queensland. (2018, July 23). How Are Memories Formed? Queensland Brain Institute. Retrieved March 17, 2023, from https://qbi.uq.edu.au/brain-basics/memory/how-are-memories-formed
52. The University of Queensland. (2018, July 23). Memory and Age. Queensland Brain Institute Retrieved March 17, 2023, from https://qbi.uq.edu.au/brain-basics/memory/memory-and-age
53. Young, C. (2015, September 24). How Memories Form and How We Lose Them. YouTube. Retrieved March 17, 2023, from https://www youtube.com/watch?v=yOgAbKJGrTA
54. Doi, T., Verghese, J., Makizako, H., Tsutsumimoto, K., Hotta, R., Nakakubo, S., Suzuki, T., & Shimada, H. (2017). Effects of cognitive leisure activity on cognition in mild cognitive impairment: Results of a randomized controlled trial. Journal of the American Medical Directors Association, 18(8), 686–691. https://doi.org/10.1016/j.jamda.2017.02.013
55. Gómez Gallego, M., & Gómez García, J (2017). Music therapy and Alzheimer's disease: Cognitive, psychological, and behavioral effects. Neurología (English Edition), 32(5), 300–308. https://doi.org/10.1016/j.nrleng.2015.12.001
56. Shimizu, N., Umemura, T., Matsunaga, M., & Hirai, T (2017). Effects of movement music therapy with a percussion instrument on physical and frontal lobe function in older adults with mild cognitive impairment: A randomized controlled trial. Aging & Mental Health, 22(12), 1614–1626. https://doi.org/10.1080/13607863.2017.1379048
57. Lam, H. L., Li, W T., Laher, I., & Wong, R Y (2020). Effects of music therapy on patients with dementia—a systematic review. Geriatrics, 5(4), 62. https://doi.org/10.3390/geriatrics5040062
58. Moreno-Morales, C., Calero, R., Moreno-Morales, P., & Pintado, C. (2020). Music therapy in the treatment of dementia: A systematic review and meta-analysis. Frontiers in Medicine, 7 https://doi.org/10.3389/fmed.2020.00160
59. Chu, H., Yang, C.-Y., Lin, Y., Ou, K.-L., Lee, T-Y., O’Brien, A P., & Chou, K.-R (2013). The impact of group music therapy on depression and cognition in elderly persons with dementia. Biological Research For Nursing, 16(2), 209–217.
https://doi.org/10.1177/1099800413485410
60. Särkämö, T., Laitinen, S., Numminen, A., Kurki, M., Johnson, J K., & Rantanen, P (2016). Pattern of emotional benefits induced by regular singing and music listening in dementia. Journal of the American Geriatrics Society, 64(2), 439–440.
https://doi.org/10.1111/jgs.13963
61. Guétin, S., Portet, F., Picot, M. C., Pommié, C., Messaoudi, M., Djabelkir, L., Olsen, A. L., Cano, M. M., Lecourt, E., & Touchon, J (2009). Effect of music therapy on anxiety and depression in patients with Alzheimer's type dementia: Randomised, controlled study Dementia and Geriatric Cognitive Disorders, 28(1), 36–46.
https://doi.org/10.1159/000229024
62. Unique visual stimulation may be new treatment for Alzheimer's Picower Institute. (2016).
https://picower.mit.edu/news/unique-visual-stimulation-may-be-new-treatment-alzheimers
Optimization and Period Finding Using Quantum Computing
Cece C.Mentor: Greg S.
Abstract
In the past decade, quantum has pushed its way into the computer science world, but its limits, utility, and basic mechanisms are often left unexplained, turning from a tool into a clickbait title. The Shor algorithm, which can find an integer's prime factors exponentially faster than a classical computer, is currently a quantum algorithm of interest, as classical cryptography relies on using large primes multiplied together to create encryption keys. I hoped to explore algorithms that, like Shor's, would reduce processing time. I investigated two problems that preceded the Shor algorithm: Deutsch's problem and Simon's problem, most of my work focusing on Simon's. Simon's problem is solved exponentially faster on a quantum computer than on a classical computer and inspired Shor's algorithm; however, it is less famous because it has little practical use. I worked by hand, imitating the code on paper and online, using IBM's quantum lab with Qiskit, a Python software development kit. Starting with 2 bits, I worked to create code that would allow for any length of bit-string, testing on paper before moving to the code.
Introduction
Quantum computing was first imagined in the 1970s, but the concept did not see growth until the 1980s, when it suddenly became a topic of interest, with Russian mathematician Yuri Manin mentioning using superposition in a mechanical or computational setting.1 Similarly, American physicist Paul Benioff wrote a paper called The Computer as a Physical System: A Microscopic Quantum Mechanical Hamiltonian Model of Computers as Represented by Turing Machines in which he described a model of a quantum computer constructed from Turing machines.2 This model, which hypothesized a quantum computer that would be reversible, a vital detail as quantum equations are likewise reversible1 , is considered a building block of quantum computing. One year later, MIT and IBM organized The Physics of Computation Conference, bringing together many physicists, mathematicians, and computer scientists.1-3 Along with Benioff, notable names in quantum mechanics like Richard Feynman and Tommaso Toffoli participated in the event, giving talks, which would soon be printed in the International Journal of Theoretical Physics in 1982. 1
Feynman’s transcribed talk, Simulating Physics with Computers4 , is considered to be a catalyst for the field of quantum computing, taking the problem that quantum computing faced: classical computers are unable to process quantum mechanics, and flipping it around, wondering if quantum computers had capabilities that classical computers lacked. Although Feynman chose not to continue focusing on quantum computing, he laid the framework for future researchers.1-2
Quantum computing’s notoriety is largely due to the existence of the Shor Algorithm, developed by Peter Shor in 1994. The Shor algorithm is a quantum algorithm used to find the prime factors of an integer, and it does this more efficiently than a classical algorithm. “Efficiency” is a vague
concept without definition; in this case, the algorithm is considered efficient because it runs in polynomial time (faster than those which run in exponential time) and will solve the problem correctly with a probability of ⅔ or more. This places the Shor algorithm in the category BQP, bounded-error quantum polynomial time, which is considered an analog to the classical class BPP, bounded-error probabilistic polynomial time. The current classical prime factorization algorithm, the general number field sieve, works in sub-exponential time: not as fast as polynomial time, not as slow as exponential time. Shor built from the work of Feynman, Ethan Bernstein, Umesh Vazirani, and Daniel Simon, the creator of Simon’s Algorithm, stating, “I was only able to discover this algorithm after seeing Simon’s paper.”5
Simon’s Problem is an example of a computational problem where a quantum algorithm is exponentially faster than its classical counterpart. The state of Simon’s Problem is as follows:
1. We are given an unknown oracle that maps inputs to outputs one-to-one or two-to-one, and we define one-to-one as a function that maps one unique input to a unique output and two-to-one as a function that maps exactly two inputs to every unique output.
2. This mapping is reliant on a hidden bitstring, which I will call b, where:
a. When x1,x2: f(x1) = f(x2),
b. It is guaranteed: x1+x2 = b
3. If this black box is applied, how quickly can we determine the value of b? The question of one-to-one and two-to-one ends up being a part of this same question as it is the result when the bitstring is all 0.6
In order to find this number classically, one may have to check 2n-1+1 inputs before finding the secret string(one of the 2n-1+1 instances being a one-to-one mapping). This leads to an exponential growth in complexity.
I selected Simon's Algorithm for my research, with the goal of implementing Simon’s Algorithm for an unknown value of b and an arbitrary number of bits. I did this by starting with a known bitstring b and a known number of bits n = 3 and performing the computations by hand. I then worked on expanding to four bits, where I repeated the process. I moved to work in code, where I first programmed two and three-bit examples with known bit strings using quantum composer, and then worked in quantum labs to write code for any number of bits. I spent the majority of my time attempting to create a working oracle that was both general and mapped properly.
Materials and Methods
Solving known bit systems by hand
I used the following quantum circuit:
The steps of which can be written out as the following list:
1. Create a system with two-qubit input registers initialized to zero and apply a Hadamard transform to the first register.
2. Query the black box and apply it to the second register
3. Measure the second register.
4. Apply a Hadamard transform to the first register
5. Measure the first register.
Using the measurements received from the first register, one can find the value of b in approximately n runs, solving with a system of equations that relies on b z = 0, with z being the measured output of the first register
I used these steps to experiment with progressively larger circuits, testing a two-bit system with b=11, a three-bit system with b=011, and a four-bit system with b=0101.

Solving systems using computer code
Using quantum computers for research poses a unique challenge as there is limited access for the public. I used IBM Quantum, a public access service that allows the user to send their code to IBM’s computers. This service only gave me access to five qubit computers, and Simon’s Algorithm requires six qubits to run a problem with a secret string with a length of three. Another problem with the computers accessible through IBM was the time it took to run tests: there are waiting times that vary in length depending on who is in the queue, which removes the ability to quickly spot and tweak errors in code. Because of these drawbacks, I opted to use IBM’s quantum simulators, which were much faster to work with and allowed for hundreds of bits.
Figure 1: Circuit diagram of Simon’s AlgorithmI had two methods to use the computers, the composer and the lab. The quantum composer allowed me to see the circuits and construct them graphically, but it is limited as there is no way to generalize or use anything except the given gates. I worked briefly in the quantum composer, creating the two and three-bit examples of Simon’s Algorithm that I had previously done by hand(see Fig. 2 and 3). To make comprehensive code that could create circuits of any size, I used the quantum lab. The lab uses Qiskit, an open-source software development kit that uses Python as its programming language. One can create practically any circuit in the lab, but a knowledge of Python is key, and learning how to navigate it proved to be one of my greatest challenges. While creating a generalized program, I spent the bulk of my time creating a black box that I felt made sense, eventually turning to the black box created by Qiskit. The rest of the code followed the same steps as the ones I solved by hand, this time with an unspecified secret string.
Results
Solving by hand
I first tested using a two-bit system secret string b = 11, which I used to form a black box with the
Following the procedure laid out in the methods:
Given secret string b = 11, with the values of f(x) from the black box:
When measured the output will be either 00, which is considered a trivial solution as it appears no matter what secret string is chosen, or 11. Assuming a non-trivial measurement:
For a three-bit system, I created a secret string b = 011 which I used to form the following black box:
Following the procedure laid out in the methods:

with the values of
from the black
I have chosen to omit the entire expanded work for the four-bit system, but when given secret string b = 0101, the outputs are 0101, 0111, 1111, 0000, 0010, 1010, 1101, 1000, which adhere to the same principle of b + z = 0.
Solving with Code

The generalized code for Simon’s Algorithm:


Creation of the string and circuit length:
b=(insert secret string)
n = len(b)
simon_circuit = QuantumCircuit(n*2, n)
The circuit:
simon_circuit.h(range(n))
simon_circuit.barrier()
simon_circuit = simon_circuit.compose(simon_oracle(b))
simon_circuit.barrier()
simon_circuit.h(range(n))
Measuring the circuit:
simon_circuit.measure(range(n), range(n))
compiled_circuit = transpile(simon_circuit, simulator)
job = simulator.run(compiled_circuit, shots=100) result = job.result()
counts = result.get_counts(compiled_circuit)
I attempted multiple variations on the oracle, but ended up with the following:
b = b[::-1]
n = len(b)
qc = QuantumCircuit(n*2)
for q in range(n):
qc.cx(q, q+n)
if '1' not in b:
return qc
i = b.find('1')
for q in range(n): if b[q] == '1':
qc.cx(i, (q)+n)
return qc
Figure 4: probabilities of measurements for two-bit Figure 5: probabilities of measurements for three-bit The results for the two and three bit circuits aligned with the results I received from solving by hand.Discussion
Although I was able to create code that can return a circuit and the measured values for an n-bit system, I did not write code that would solve for the secret string itself. I struggled with coding classically as I do not have a computer science background, which made it difficult to conceptualize the basic non-quantum aspects of the code, which emerged while coding the black box and my attempts at the final computation. Using Simon’s algorithm, one can see the efficiency of quantum computing and the internal workings of the algorithm. The code is shockingly simple, only requiring Hadamard gates outside the black box. Similarly, a lot of the roadblocks in quantum computing historically were because the problems that were more efficient with quantum computing were unknown and required highly specialized environments.
References
1 40 years of quantum computing Nat Rev Phys 4, 1 (2022) https://doi org/10 1038/s42254-021-00410-6
2 Benioff, P The computer as a physical system: A microscopic quantum mechanical Hamiltonian model of computers as represented by Turing machines. J Stat Phys 22, 563–591 (1980).
https://doi org/10 1007/BF01011339
3. MIT Endicott House. "The Physics of Computation Conference." The Endicott House. March 21, 2018.
https://mitendicotthouse org/physics-computation-conference/
4. Feynman, R.P. Simulating physics with computers. Int J Theor Phys 21, 467–488 (1982).
https://doi org/10 1007/BF02650179
5 P W Shor, "Algorithms for quantum computation: discrete logarithms and factoring," Proceedings 35th Annual Symposium on Foundations of Computer Science, Santa Fe, NM, USA, 1994, pp. 124-134, doi: 10 1109/SFCS 1994 365700
"Simon's Algorithm." Qiskit. https://learn.qiskit.org/course/ch-algorithms/simons-algorithm.
Modeling febrile seizures in Drosophila melanogaster: Male versus Female Behavior with sei (KCNH2) Mutations
Anna Y.Mentor: Leah K.
Abstract
When mutated, voltage-gated potassium channels– which control a variety of cell functions in nearly all organisms– can lead to seizures and epilepsy-like behavior (11). Various studies suggest that some forms of epilepsy, as well as febrile (heat induced) seizures, are caused by mutations of genes that code for these channels. Using Drosophila melanogaster, we wanted to explore whether mutations in the voltage-gated potassium channel gene sei (homologue of the human voltage- gated K+ channel gene KCNH2) would result in seizure-like behavior, and whether there were different responses in males versus females. In humans, studies show that there may be a correlation between sex and seizure frequency in general epilepsies (7). To measure seizure presence in Drosophila, we performed 5 trials of heat induction (placing the flies in a water bath of 40.5C) on both wild type and sei genotypes. We verified that the sei mutants consistently experienced seizure-like behavior, while the wild type flies did not. Additionally, we found that female flies had slightly stronger responses to heat induction than the male flies with the same mutation.
Introduction
Over 55 million people worldwide experience seizures or other epilepsy-like behavior (1). This can present physically as a range of motions– from whole-body convulsions to staring blankly for two seconds. Syncope (dizziness), movement or sleep disorders, or psychological non-epileptic spells are all differential diagnoses for seizure-like episodes, but a true seizure is the result of abnormal, uncontrolled electrical activity or signaling in the brain (8). Seizures can be classified as generalized or partial (focal). Generalized seizures are results of abnormal electrical activity in both hemispheres of the brain. Partial or focal seizures refer to the activation of the cortex in one region. Partial seizures can generalize rapidly to other cortical regions of the brain. There are many types of partial and focal seizures, such as idiopathic location-related epilepsies (ILRE), frontal lobe epilepsy, temporal lobe epilepsy, parietal lobe epilepsy and occipital lobe epilepsy, and febrile seizures (9). Epilepsies such as ILRE can result in vomiting and extensive vision problems and sometimes complete loss of vision. Febrile seizures develop when the body’s temperature spikes to be greater than 38C (100.4F) with no other
seizure-provoking diseases, such as CNS (central nervous system) infections, epilepsy, or other trauma, and are primarily pediatric (10).
During a seizure, neurons send and receive excess electrical stimulation. These electrical signals are called action potentials, where the ion concentrations across the neuron’s membrane rapidly change, causing a change in electrical potential (8).
At a resting state, a neuron has a voltage of ~-70mV. This membrane potential is due to a few factors, one being the sodium-potassium ATPases, which pump 3 Na+ ions out and 2 K+ ions in. Leaky K+ channels allow K+ ions to move in and out of the cell passively. K+ ions leave behind an unoccupied anion every time they leave the cell, making the cell more and more negative until its equilibrium potential of ~-90mV. For the resting membrane potential (RMP) to reach the threshold for an action potential (the series of events that makes up its own signaling process), a depolarization must occur to excite the neuron. This threshold potential is the voltage needed to open voltage gated Na+ channels in the axon. We call this rise towards threshold an excitatory postsynaptic potential (EPSP) (9). During hyperpolarization, which occurs when a signal lowers the membrane potential further from the threshold, the neuron is inhibited. We call this an inhibitory postsynaptic potential (IPSP). For instance, a presynaptic neuron could release an inhibitory neurotransmitter, such as gamma aminobutyric acid (GABA). GABA binds a receptor pocket that lifts open the “gate” on ligand-gated ion channels, allowing chloride ions to enter. Ideally, a neuron will have more EPSPs than IPSPs in a short enough time period and in the same location in order to reach the threshold potential. When that threshold is reached, a signal or “message” can be fired (an action potential) (8).
During a seizure, the epileptic neurons experience continuous bursts of action potentials with prolonged depolarizations and the ion channels remain open for an extended period of time. Sometimes the ion channels are not able to open. The extended duration of the depolarization (or absence of a depolarization) determines the length of the seizure (8). One important type of ion channel in neurons is the K+ voltage-gated ion channels. These channels allow K+ to enter the neuron as the second phase of the action potential, bringing the cell back to a resting state so that it can send another signal. K+ channels play vital roles in both excitable and non-excitable cells and are found in all species except particular parasites (3). These channels have 2-6 transmembrane helices that span the lipid bilayer and typically have three states: resting, activated, and inactivated. They are closed during the resting state, and are opened after stimuli such as various signaling molecules activate the channels (11).
The structure of K+ ion channels is ion specific, and allows the movement of K+ ions across membranes down their electrochemical gradient from a high electrical potential to a low electrical potential, while preventing the movement of other ions, such as Ca 2+ and Na+. K+ channels have two primary types of gating mechanisms: an intracellular mechanism (which is at a position where the inner transmembrane helix bends) and an extracellular mechanism (which
includes the K+ channel selectivity filter). This discriminates K+ transport over other cations, particularly Na+. The two gating mechanisms are coupled, but the effects of the coupling can vary depending on the specific type of K+ channel (4). Two gates in voltage-gated potassium (Kv) channels have certain links to help them easily enter inactivated states, called negatively coupled links. This differs from the two gates in tandem pore domain K+ channels, which have links to easily facilitate their constitutive opening, called positively coupled links. The difference in coupling can determine the arrangement of the K+ channel, especially lower locations, such as the bottom of the selectivity filter (SF) (3).
There are four subfamilies of genes that encode channel-forming alpha subunits of voltage gated K+ channels. When mutated in humans, the K+ channel gene KCND2 can lead to epileptic-like symptoms (12). The primary function of KCND2 is to regulate neuronal excitability and the frequency of action potentials. If we can see that the frequency and regularity of action potentials is not being moderated or downregulated, it’s more likely for the bursts of action potentials to occur; this may lead to seizures. Additionally, KCND2 functions with the glutamate receptor GRM5, which may be involved in regulation of neural network activity, as well as synaptic plasticity (8). Synaptic plasticity refers to the changes in synapses, and the ability for them to either strengthen or weaken over a period of time.
The shal subunit is encoded by KCND2. Members of this particular subfamily (shal) for potassium ion channels have a significant effect on the repolarization phase (K+ ions efflux out of the cell) of an action potential (8). Shal channels conduct 1A- type currents. In neurons, these inactivating potassium currents are involved in several physiological functions including the regulation of membrane excitability, the control of firing patterns and action potential
 Figure 1 (from ResearchGate): Mechanisms of potassium channel activation
repolarization. These shal channels are activated at membrane potentials below the threshold (~ -55mV) of an action potential. The regulation of KCND2 is a key factor in the frequency of neuronal firing and action potentials. Out of the four subfamilies of genes that encode channel-forming α-subunits of voltage-gated K+ channels, shal is the most directly involved in mediating the subthreshold 1A-type currents. Shal channels underlie these subthreshold currents in both vertebrates (ie. Zebrafish) and invertebrates. In the brains of mammals, shal channels are primarily located on the dendrites and the soma of the cell, where their placement may affect the spiking behavior of that mammal.
I was interested in investigating more about the effects of KCND2 variations on seizures. Shal K+ channels are present in the soma of neurons in Drosophila, suggesting the location of these channels is conserved across many species. As in mammals, shal K+ channels affect the duration of the interspike interval, and their inactivation rates may determine neuronal firing patterns (12). Mutations in Drosophila K+ channel genes cause seizure-like behaviors when flies are exposed to heat. Because they are an accessible human homologue, we used them as our model.
For my project, we were not able to attain flies with mutations of KCND2. However, our flies had mutations in the homologue of a similar gene, KCNH2 (seizure (sei) in Drosophila) In humans and Drosophila, KCNH2 encodes the shal subunit of K+ channels primarily in cardiac muscle, nerve cells, and microglia. KCNH2 also plays a role in the cell’s ability to generate and transmit electrical signals. The protein made by KCNH2 (in cardiac tissue) recharges the cardiac muscle after each heartbeat. Humans who have mutations in KCNH2 can experience Long QT Syndrome (LQTS), a type of cardiac ventricular arrhythmia. Symptoms of LQTS may be present as “epilepsy-like convulsions,” which are noticeable on an EKG. Additionally, patients with LQTS may develop seizures related to an acute hypoxic-ischemic event, but also often present with febrile seizures (10). The seizure activity is primarily in the right temporal lobe, and present with hippocampal epileptiform discharges (recurrent episodes of abnormal spiked electrical activity). We wanted to find out if Drosophila melanogaster with mutations of KCNH2/sei would experience seizure-like symptoms (such as wing flapping, leg twitching, swirling motion, or rapid buzzing) when induced with heat. Additionally, we were curious if inducing male and female flies would show one sex displaying stronger symptoms than the other. A few studies have shown a correlation between gender relating to epilepsies in humans, and some have noted that males presented with more frequent seizure-like activity for general epilepsies than females (7). We wanted to see if this idea could be translated in Drosophila melanogaster with sei mutations in males versus females.
Methods and Materials
We first used WT (wild-type) Drosophila melanogaster from Carolina Biological to establish our procedures for transferring and sexing the flies, as well as inducing seizures. We determined that freezing them for 3.5 to 4 minutes knocked them out long enough to handle and transfer them from their original vial to small Petri dishes. Once knocked out, we examined the flies under a microscope or with a magnifying glass and separated them by sex, then placed them in separate vials.
We purchased our main experimental stocks of Drosophila from the Bloomington Drosophila Stock Center. The WT strain use was 6326 and the mutant sei strain was 21935.
Vortex Assay for Seizure Induction:
This procedure was based on the paper by J Mituzaite et al., 2021 (4). Ten male and female WT flies (separately) were put in empty vials with foam plugs at the top. The vials were placed on a standard laboratory vortexer at a maximum speed for 10s. The duration of seizures was measured as the time taken for the flies to regain posture. This procedure is used for bang-sensitive mutants. While our experimentation was focused on febrile and heat sensitive flies, we were curious to see the WT flies’ response to the assay. We did not notice any abnormal behavior.
Heat Assay for Seizure Induction:
To establish our procedure, we froze the Carolina wild type (WT) flies for 3.5 to 4 minutes, separated them by sex and placed them in glass Petri dishes with smaller Petri dish tops. Flies were left to recover for around 4 hours. We attached pieces of clay and used rubber bands to secure the dishes to a test tube rack so they wouldn’t float away.
Using a rack to elevate the dishes, we placed the female flies in a hot water bath heated to 40-41°C. We recorded their activity for 7 mins. We repeated this process with males, but the temperature was 43°C. We soon realized that only the bottom surface of the Petri dishes was heating to the precise temperature, and used small Carolina containers instead that could be completely submerged. We hot glued large metal weights to the caps of the containers and used Parafilm to seal the lids. We flipped the containers upside down, and placed them at the bottom of the bath. For the subsequent experiments, the water bath temperature was 40.5°C. Trials were conducted on 7 flies at a time of the following groups: male WT, female WT, sei males, sei females. We conducted a total of five trials spread over 12 weeks. We then recorded observations on video for three minutes as well as two minutes of recovery. We made a data table to record the times and number of flies displaying abnormal, seizure-like behavior.

Abnormal or seizure like behavior was defined as:
● Excessive wing and/or leg buzzing
● Rolling around and flipping over
● On back or side motionless
From our data table we used the first time that 3 or more flies showed abnormal behavior during each trial to calculate an average time for the five trials.
 First trial with rubber bands
Second trial with new container, weight, and parafilm
First trial with rubber bands
Second trial with new container, weight, and parafilm
Results
We were able to confirm that when placed in a hot water bath of 40.5°C, Drosophila melanogaster with sei mutations (KCNH2 in humans) display seizure-like behavior while wild type flies rarely do (Figures 2 and 3). Across the 10 trials, the average time for three or more wild type flies to show abnormal behavior after heat exposure was 153.3 seconds. The average time for three or more sei flies to show abnormal behavior was 6.8 seconds.
Data was averaged over five trials

For comparison between the sexes, we noted that females with sei mutations began seizing after less time exposed to heat than the male flies with the same mutation in four out of five trials. At a given time, we observed that the number of female sei flies seizing was greater

than the number of sei males. Wild type flies (both males and females) rarely displayed abnormal behavior; in most cases only temporarily For the most part, we noted that wild type males displayed more abnormal behavior than the wild type females at a given time. The average time for three or more wild type female flies to display abnormal behavior was 180 seconds. The average time for three or more wild type male flies to display abnormal behavior was 126.6 seconds.
As shown in Figure 2, more sei female flies (red lines) were seizing actively than the sei males (green lines) at most given times. The average time for three or more sei male flies to display abnormal behavior was 9 seconds. The average time for three or more sei female flies to display abnormal behavior was 4.6 seconds.
Discussion
Though we did observe some wild type flies displaying abnormal behavior during the heat induction, we believe that behavior was due to discomfort from the heat as opposed to actual changes in electrical brain activity and seizures. Other studies looking at flies with the same mutation did not note any significant seizure behavior in wild type flies. The sei flies were significantly more affected by the heat exposure– in all trials, at least 3 out of 7 flies had abnormal behavior after only 7 seconds. While studies show links to gender differences and certain epilepsies in humans, most suggest males have more unusual behavior (more frequent and longer seizures). (7) We noticed the male wild type flies also seemed to be more heat-sensitive. After running the 5 trials with our wild type flies, – the male flies responded faster and more frequently than the females when placed in the hot water bath. But this trend wasn’t consistent with the sei mutated flies, as the female sei flies had slightly stronger and faster responses than males with the same mutation.
The difference in seizure activity between the sexes of fruit flies we observed reflects the possibility that there are differences in seizure frequency between male versus female humans. It would be interesting to find out if febrile seizures occur more frequently in one human sex than another.
References
1. World Health Organization: WHO. (2023). Epilepsy. www.who.int. https://www.who.int/news-room/fact-sheets/detail/epilepsy#:~:text=Around%2050%20million%20people%20worl dwide%20have%20epilepsy%2C%20making%20it%20one,if%20properly%20diagnosed%20and%20treated
2 Goetz, T et al “GABA(A) receptors: structure and function in the basal ganglia ” Progress in brain research vol 160 (2007): 21-41. doi:10.1016/S0079-6123(06)60003-4
3 Kuang, Qie, et al “Structure of Potassium Channels ” Cellular and Molecular Life Sciences, vol 72, no 19, Birkhäuser, June 2015, pp 3677–93 https://doi org/10 1007/s00018-015-1948-5
4. Horn, Richard. “Coupled Movements in Voltage-gated Ion Channels.” The Journal of General Physiology, vol. 120, no. 4, Rockefeller UP, Oct. 2002, pp. 449–53. https://doi.org/10.1085/jgp.20028658.
5 . Mituzaite, J , Petersen, R S , Claridge-Chang, A , & Baines, R A (2021) Characterization of Seizure Induction Methods inDrosophila Eneuro, 8(4), ENEURO 0079-21 2021 https://doi org/10 1523/eneuro 0079-21 2021
6. Köhling, R., & Wolfart, J. (2016). Potassium Channels in Epilepsy. Cold Spring Harbor Perspectives in Medicine, 6(5), a022871 https://doi org/10 1101/cshperspect a022871
7 Carlson, C , Dugan, P , Kirsch, H E , & Friedman, D (2014) Sex differences in seizure types and symptoms
Epilepsy & Behavior, 41, 103–108
https://doi org/10 1016/j yebeh 2014 09 051
8. Grider, M. H. (2022, May 15). Physiology, Action Potential. StatPearls - NCBI Bookshelf.
https://www ncbi nlm nih gov/books/NBK538143/
9 Dudek, F E (2009) Epileptogenesis: A New Twist on the Balance of Excitation and Inhibition Epilepsy Currents, 9(6), 174–176.
https://doi.org/10.1111/j.1535-7511.2009.01334.x
10. Febrile Seizures. (n.d.). National Institute of Neurological Disorders and Stroke.
https://www ninds nih gov/health-information/disorders/febrile-seizures
11 Kuang, Q , Purhonen, P , & Hebert, H (2015) Structure of potassium channels Cellular and Molecular Life Sciences, 72(19), 3677–3693.
https://doi.org/10.1007/s00018-015-1948-5
12 KCND2 potassium voltage-gated channel subfamily D member 2 [Homo sapiens (human)] - Gene - NCBI (n d )
https://www ncbi nlm nih gov/gene/3751
Triclosan and Plant Development: An Understudied Subject in Public and Environmental Health Evia
D.V. Mentor: Andrew J.Abstract
Since its historical use in hospitals as an antibacterial in 1972, the use of triclosan, a potent endocrine-disrupting chemical, has increased significantly. In recent decades, its use has been expanded to cosmetics and personal care products including antibacterial soaps, body wash, mouthwash, toothpaste, and even sweat-wicking athletic gear. Triclosan has implications for the health and safety of both humans and the environment. Though banned in 2016 by the Food and Drug Administration (FDA) for use in personal care products, its significant usage over the years has made it ubiquitous, with approximately 75% of the US population being measurably exposed. It can be found in considerable concentrations in human urine and can be detected in wastewater, surface water, drinking water, and soil. Though its negative implications for human safety have been noted and the FDA has acted on this knowledge, the Environmental Protection Agency (EPA) has yet to regulate its usage, despite evidence of its detrimental effects on the environment. In my research, I looked at 4 different types of data to assess the physiological impacts of triclosan exposure on Wisconsin Fast Plants. Those 4 physiological development indicators include root length, number of flowers, number of pods, and average number of seeds per pod. Half of the plants were grown in a control group, and the other half were grown with a triclosan-infused water supply with a concentration of triclosan at 0.1mg/L. Growth was observed for 6 weeks and seed pods were collected at the end of the period. Suspected triclosan-induced variations in Wisconsin Fast Plant physiological development were most evident in root length. Variations in the number of flowers, pods, and average seeds per pod were insignificant. However, results and impacts may have been unobservable due to the scale of the experiment. My research and analysis seek to explore the ways in which the noted impacts of triclosan exposure on Wisconsin Fast Plants indicate its effects on the environment and how this relates to its regulation or unfortunate lack thereof. It is important to bring attention to this understudied aspect of environmental research in order to develop a more robust understanding of the interspecies implications of triclosan exposure not only on consumers, but also the plants, animals, and people indiscriminately subjected to exposure due to triclosan's lack of environmental regulation.
Introduction
Since its historic use in hospitals as an antibacterial in 1972, the use of triclosan, a potent endocrine-disrupting chemical, has increased significantly as it was widely added to consumer products. In 1977, the production of triclosan was in the range of 0.5-1M lb/yr By 1988, production had risen to 10 M lb/yr. Until recent years when it was banned in 2016, it became ubiquitous. Recent studies have shown that approximately 75 % of the U.S. population has been exposed to triclosan based on its use in antibacterial soaps, body washes, mouthwash, cosmetics, toothpaste, and even sweat-wicking athletic gear.1,2
Triclosan is a chemical compound that belongs to a class of chemicals called endocrine -disrupting chemicals which are characterized by their ability to bind to estrogenic and androgenic receptors and interfere with hormonal activity.3 This leads to a variety of negative health outcomes, especially related to reproductive function, and poses a threat to pregnant people. Though more research is yet to be completed for a more thorough analysis, data has demonstrated that high exposure to triclosan is linked to lowered levels of some thyroid hormones, antibiotic resistance, and skin cancer.1 Triclosan can be found in various human tissues and fluids and has the ability to readily absorb into the skin.2 Though endocrine-disruptor exposure is widespread throughout the United States, the effects are severely disproportionate. Likely due to higher levels of exposure to pesticides and flame-preventing agents containing endocrine-disrupting chemicals, people of color face significantly higher rates of exposure to these chemicals. For example, among non-Hispanic Black people and Mexican-Americans, despite their proportions of the US population at 12 6% and 13 5%, respectively, the endocrine-disruptor exposure and the resultant disease and cost burden are 16.5% and 14.6% of total costs. Contrarily, non-Hispanic white Americans who comprise 66.1% of the U.S. population only consume 53.3% of the disease and cost burden related to endocrine-disruptor exposure.4
Triclosan is a synthetic antimicrobial, common in households and hospitals as aforementioned. As a subset of antimicrobials, antibiotics and the increasingly prevalent issue of bacterial resistance to them, have begun to be studied in conversation with triclosan. As triclosan has been further studied, observations of an association with multidrug and triclosan resistance in triclosan-exposed environments have been noted. The survival of a bacteria characterizes this resistance despite exposure to concentrations of antibiotics that typically do not allow for the bacteria to survive. Though the effects of triclosan on antibiotic resistance require further study, its impacts on both human and environmental health are becoming increasingly evident. Triclosan enters wastewater treatment plants and the environment at an estimated 1.2x10ˆ5 to 4.2x10ˆ5 kg per year Triclosan has been observed to alter the development of biofilms and diversity in freshwater biofilms in receiving stream and the respiration rates and denitrification abilities of soil. Triclosan's ubiquity is not only evident in human exposure, but in its harm to the environment through its pervasive presence in surface water, wastewater, soil, drinking water, wastewater treatment plants, biosolids, landfills, and sediments. It is commonly found in human urine. Triclosan enters the water through wastewater treatment plants when personal care products containing triclosan enter drainage systems. There is such a continuous high volume of products containing triclosan that enter the plants that they cannot not fully filter out the triclosan in their conventional treatment. Due to the bioaccumulation of triclosan in the food chain, there is evidence that it has increased harm to plants and aquatic animals, whose internal organs and endocrine systems are affected. These effects may harm abilities for survival and reproduction.5
Furthermore, a recent 2021 metastudy synthesized data from the last 20 years of research on estrogens and androgens in plants. Androgens and estrogens are sex steroid hormones responsible for generative development and reproduction. Literature indicates that plants have these steroid hormones similar to that of mammals as a part of their metabolic profile. These hormones have noted impacts on the physiological processes of plant development. Literature suggests that exogenous estrogen administered to various types of plants and produce had varying effects on plant growth, morphology, and development.6 This
has important implications for the effects of triclosan on plants as an endocrine-disrupting chemical with similar abilities to bind to androgen and estrogen receptors.
The FDA banned triclosan in soap products in 2016 based on its assessment regarding a lack of evidence to support the categorization of being GRAS/GRAE (Generally Regarded as Safe/Generally Regarded as Effective).7 However, triclosan is still present in various personal care products such as toothpaste, mouthwash, and hand sanitizer.2 The failure of triclosan to meet these safety standards for humans, however, had no effect on the safety evaluation of the EPA (Environmental Protection Agency). This lack of action on the part of the EPA, despite abundant evidence for its detrimental effects on the environment, its inhabitants, and inevitably the individuals and communities subject to its exposure due to its persistent environmental ubiquity, lead to the essential question of the priorities of such governmental agencies. This also calls into question the interests and influences of major corporations.
My research and analysis seek to explore the ways in which the noted impacts of triclosan exposure on Wisconsin Fast Plants indicate its effects on the environment and how this relates to its regulation or unfortunate lack thereof. It is important to bring attention to this understudied aspect of environmental research in order to develop a more robust understanding of the interspecies implications of triclosan exposure not only on consumers, but also the plants, animals, and people indiscriminately subject to exposure due to triclosan's lack of regulation in the environment.
Methods
We used Wisconsin Fast Plants to evaluate the impact of triclosan exposure on the environment by measuring the impact on height, root growth, flower development, and seed pod development. We separated the seeds into two groups: a triclosan-exposed group and a control group. To prepare the experiment, we set up 2 reservoirs for each experiment group and placed 2 antialgal squares into each. Each reservoir was filled with 4L of water and 2 antialgal squares. The triclosan water solution was prepared at a concentration of 10mg/L, with each triclosan-containing reservoir receiving 40 mg of triclosan for each of the 4 L. The reservoirs had felts draped such that they made contact with the water and the reservoir surface as to provide continual hydration for the growing quads. We had approximately 100 seeds in each group planted across 13 quads, each with 4 cells, for a total of 54 cells per experiment group. To prepare the quads for adequate moisture absorption, diamond-shaped wicks were placed into the bottom of each cell and positioned partially inside and partially outside each cell so as to absorb water from the felt. Damp soil was mixed with potting mix and was then put into each cell, filling each of the cells halfway. Then, each of the cells received 3 fertilizer beads and was filled to the top with more potting mix. Indentations were made in each cell, and 2-3 seeds were placed in the depression before being covered with a final amount of potting mix to reach the top of the cell. Each was watered again with a pipette to moisten the soil for optimal growing conditions. Each of the quads was placed onto the reservoirs above the felts with 6 or 7 quads on each of the 4 reservoirs. Once placed, they were put under a 24-hour grow lamp to begin germination. (Figure 1) On day 7, the plants were trimmed to one per cell to allow adequate resources for growth. The removed plants were dried and root lengths at this stage were recorded. On day 21, after sufficient flower budding, plants were pollinated with bee
sticks. Bee sticks were prepared by gluing bee abdomens onto wooden skewers and passing the stick over the stamen of each flower. Different bee sticks were used for the triclosan and control groups. To record data, photos were taken at 10:15 am each day Monday through Friday. Once plants' vertical growth had surpassed the height of the grow lamp, reservoirs were moved lower so as to allow continued growth and prevent excessive heat from contact with the light source. (Figure 2) On days 21-24, stakes were placed to support plants as they grew. Flower and seed pod amounts per reservoir were counted at days 21 and 28 and seed pods were collected and counted at the end of their life cycle. The average number of seeds per pod values were calculated by counting the total number of seeds collected from all seed pods in a reservoir and dividing by the number of seed pods from that reservoir.

 Figure 1. Setup for reservoirs under grow light. Left 2 reservoirs are control groups numbers 1 and 2. Right 2 reservoirs are triclosan groups numbers 1 and 2.


Root lengths were measured in centimeters and tabulated and charted from longest to shortest. (Figures 5-8) Taking the average of the control root lengths revealed an average control root length of 2.025 cm and an average triclosan root length of 2.580 cm. This is a 27% increase in triclosan root length compared to the control root length.

 Figure 5. Charted values of control root lengths measured in cm sorted by longest to shortest.

 Figure 7. Comparison of control plant root lengths.
Other development indicators measured include number of flowers, number of seed pods, and the average number of seeds per pod. (Figure 9) Perhaps due to the scale of the experiment, there was no significant difference noted in number of flowers, seed pods,or average seeds per pod. The most notable results were observable in the seed pods, total seeds, and average seeds per pod of control reservoir number 1. (furthest left in Figure 1) The numbers were surprisingly low compared to the results of control number 2 (left of middle reservoir in Figure 1) which were similar to both triclosan groups. As these differences were related to seed pods rather than flowers, it is possible that there was unsuccessful pollination of the flowers at that stage that led to a surprising underdevelopment of the seed pods. These results were taken as outliers and were not significantly regarded in the analysis of the results.
Figure 9. Chart of Development Indicators including number of flowers, seed pods, total seeds, and average seeds per pod measured for each of the 4 reservoirs.
* indicates values artificially low likely due to insufficient pollination of the plants
Discussion
Although there were no significant differences noted between the triclosan and control groups regarding the number of flowers, seed pods, and the number of seeds per pod, the difference between the triclosan and control root lengths was notable. According to Janeckzo (2021)6 , plants were exposed to estrogen at a concentration of 10 mg/L. This resulted in a decreased overall root growth. As an endocrine disruptor, triclosan may act as either an agonist, meaning that it mimics the effect of estrogen, or as an antagonist, meaning that it disrupts or mimics the effects of estrogen. In my study, seeing how the same concentration of triclosan at 10mg/L caused increased root growth, I can infer that triclosan in plants acts as an estrogen receptor antagonist, causing the opposite effect and disrupting the signals of estrogen in the plant development. While this conclusion is suggested by the results of my study compared with the previous study, I would like to repeat the experiment directly comparing triclosan and estrogen to support this finding. This future study would include a control group, triclosan-exposed group, estrogen-exposed group, and triclosan and estrogen-exposed group. In this way, the effects of triclosan and estrogen would be able to be compared directly with more conclusive results on the mechanism of triclosan as an endocrine-disrupting chemical.
That triclosan may induce root growth also brings many further questions regarding the role of regulatory agencies and the lack of attention given to the notable impact of this chemical
on plant life. Though the FDA has regulated triclosan in soap products based on its evaluation that triclosan is neither safe nor effective enough for human consumer use8 , the Environmental Protection Agency is still yet to take action against its usage. While humans may have decreased exposure to triclosan based on this regulation of soap products and recent negative public attention,8 due to decades of widespread usage and the fact that it remains to be an ingredient in certain products such as some toothpastes and washes, triclosan remains to be ubiquitous in the environment.2 As personal care products enter wastewater treatment plants, their subsequent contamination of fertilizer, surface water, wastewater, soil, drinking water, biosolids, landfills, and sediments leads to continued exposure of people still subject to working in these environments. This information leads to further questions of which groups of people regulatory agencies such as the FDA and EPA deem worthy of safety and risk. While this area lacks sufficient research and funding, there is significant evidence contraindicating the safety of triclosan to warrant further exploration. In the future, I hope to see further research and regulation of triclosan and other endocrine-disrupting chemicals that continue to affect millions of people, organisms, and the environments they inhabit.
References
1. Office of the Commissioner & Office of the Commissioner. (2019). 5 Things to Know About Triclosan. U.S. Food And Drug Administration
https://www fda gov/consumers/consumer-updates/5-things-know-about-triclosan
2. Weatherly, L., & Gosse, J. A. (2017). Triclosan exposure, transformation, and human health effects. Journal of Toxicology and Environmental Health-part B-critical Reviews, 20(8), 447–469
https://doi.org/10.1080/10937404.2017.1399306
3 Marques, A C , Mariana, M , & Cairrao, E (2022) Triclosan and Its Consequences on the Reproductive, Cardiovascular and Thyroid Levels International Journal of Molecular Sciences, 23(19), 11427
https://doi.org/10.3390/ijms231911427
4 Attina, T M , Malits, J , Naidu, M , & Trasande, L (2019) Racial/ethnic disparities in disease burden and costs related to exposure to endocrine-disrupting chemicals in the United States: an exploratory analysis. Journal of Clinical Epidemiology, 108, 34–43 https://doi org/10 1016/j jclinepi 2018 11 024
5 Carey, D I , & McNamara, P J (2015) The impact of triclosan on the spread of antibiotic resistance in the environment. Frontiers in Microbiology, 5. https://doi.org/10.3389/fmicb.2014.00780
6 Minnesota Department of Health Environmental Health Division (2014) Triclosan and Drinking Water Minnesota Department of Health. Retrieved May 15, 2023, from https://www health state mn us/communities/environment/risk/docs/guidance/dwec/triclosaninfo pdf
7. Janeczko, A. (2021). Estrogens and Androgens in Plants: The Last 20 Years of Studies. Plants, 10(12), 2783.
https://doi org/10 3390/plants10122783
8 Safety and Effectiveness of Consumer Antiseptics; Topical Antimicrobial Drug Products for Over-the-Counter Human Use. (2016, September 6). Federal Register.
https://www federalregister gov/documents/2016/09/06/2016-21337/safety-and-effectiveness-of-consum er-antiseptics-topical-antimicrobial-drug-products-for
Beyond Words: The Power of Place in Early Language Development
Nikita M.Mentor: Cathy F.
Abstract
By the age of three, children have twice the number of synapses as adults.(1) The overproduction of synapses at this age is fundamental to environmental adaptation in a developing mind. During synaptic pruning, the brain eliminates extra unused synapses. Experiences determine which connections get reinforced while those neglected are subject to elimination. Between the ages of two and ten, about fifty percent of extra synapses undergo pruning.(2) In the parts of the cortex involved in visual and auditory perception, pruning is complete between the fourth and sixth year of life.(3) I hoped to explore the process of language acquisition at this critical age by honing in on one vital and quantitative factor to environmental influence: the role of siblings. With a 3’s class at the Saint Ann’s preschool, I designed a study, drawing on aspects of standardized IQ and language development tests. I focused on vocabulary, reception, and expression in individual interviews with the students. While I hypothesized that the greater language immersion from being surrounded by siblings would accelerate development, I found that was not in fact true. Having fewer siblings tends to foster greater reciprocal interaction with adults, whose sophistication and more nuanced understanding of language leaves a profound impact on children. A study from the Bofill Foundation in Barcelona found that children whose parents read to them had a learning gap of half a year of schooling compared to those who did not.(4) These results were consistent with a theory referred to as Serve and Return, which explains the significance of the response from adults in interaction-- how the quality of communication plays a role in development, forging neural connections between various regions of the brain, building emotional and cognitive skills.(5)
Introduction
Language is imperative to human connection. It is the foundation of social interaction, our means of communication. Psychologist Steven Pinker describes the human language instinct as so much a “part of our biological birthright” that children are basically fluent speakers by the time they are in preschool.(3) Although the brain may possess inherent biases towards speech and language, it is the specific exposure to speech and language that influences development. It’s the plasticity of the brain that underlies much of the learning that occurs during this period. A lack of the experiences essential to laying the foundation for later development can hinder both brain structure and function-- not just exposure but also the quality of the psychosocial experiences influences the development of a healthy brain.(6)
During the first year of life, neurons become wired together, insulated with myelin. Myelination plays a crucial role in early language development because it allows for faster and more precise processing of auditory information. It helps support brain connectivity and the emergence of
cognitive and behavioral functioning. The analysis of language performance in a study on early development (which used MRIs to determine concentrations of myelin in specific fiber tracts in the brain) showed acceleration in children’s vocabulary after a rapid myelination phase was attained. The amount of adult word input was strongly associated with myelin concentration in the brain, suggesting a link between interaction with adults and a more rapid rate of language acquisition.(6)

Mirror neurons are a type of neuron found in the brain that become active both when an individual performs an action or when they observe someone else performing that same action, allowing individuals to learn language through observation and imitation. The mirror neuron system shapes an understanding of speech in children as they observe the behavior and actions of others.(7) For example, when you see someone smile, your mirror neurons associated with smiling are activated, evoking a sensation of smiling, without having to interpret their intentions. Infants of 6 months can distinguish between foreign language and their language by physical cues and lip reading alone.(8) It can be inferred that the development of the mirror neuron system, which is closely correlated to language acquisition, is heavily influenced by early interactions and therefore one’s environment.
Each brain cell has branching appendages, referred to as ‘dendrites’, that make connections with other brain cells. The places of connection and communication between neurons are called synapses. When electrical signals pass from brain cell to brain cell, they cross the synapse between the cells, communication information. In a simple circuit, synapses play a crucial role in transmitting information from one neuron to another, allowing the circuit to process and integrate sensory or motor information. Simple circuits form first (from being reinforced more often), and those build on the foundation for complex circuits later.(9) At birth, the number of synapses per neuron is 2,500, but by the age of three that number reaches 15,000.(10) During synaptic pruning, the brain eliminates extra synapses. Experiences determine which connections get more use-- those utilized less will undergo elimination. It’s through these processes that neurons form the connections for language, emotion, motor skills, memory, etc.
“Should children treat words as codes to be broken by a predictable, or systematic sequence of phonics instruction? Or should they treat words as vehicles for meaning, which can only be interpreted within a context of experience of the world, interactions with other people, and exposure to rich oral language?”(11)
Research has shown that certain brain structures, such as the superior temporal gyrus and the Broca's and Wernicke's areas, are especially important for language development.(12) Because varying areas of the brain are responsible for different aspects of development, the timeline of development may differ with respect to circumstances. These two specific structures are involved in the perception and production of speech sounds, the understanding of grammatical structures, and the storage and retrieval of words from memory.(12) Moreover, the development of neural connections between these brain regions is shaped by social interactions, highlighting the importance of early language exposure and stimulation. During critical periods of development, early childhood, exposure to one’s environment matters more. This is when exposures can result in irreversible changes in brain circuitry. Early learning experiences and environments influence long-term developmental and academic trajectories. It is true that skills can still be learned after a window of opportunity has closed, but the process is much more strenuous and challenging.(10) The window for syntax and grammar specifically is up to 5 and 6, which is why I chose to focus my study on the preschool age. Below is the typical stage of progress of language development at the ages of three and four.

3-4 years: (critical period in language development)
- Group objects
- Identify colors
- Speech sounds, with some distortion
- An extent of consonant usage
- Description
- Has fun with language; enjoys poems and recognizes language absurdities
- Ideas and feelings
- Progressive verbs (starting to grasp tense)
- Beginning to answer questions
- Good spectrum of: incomplete and complete sentences, reception and expression, distortion of words, consonants
Serve and Return
Serve and Return is an interaction that reinforces the neural circuits in a child's brain that are involved in language development, such as those responsible for speech perception and production, grammar processing, and vocabulary acquisition. By responding to a child's communication attempts and providing a rich language environment, caregivers can help to promote the formation and strengthening of neural circuits that support language processing. This foundation allows children to learn new words and understand increasingly complex language structures.(5) “It’s almost magical how parental conversation appears to influence the biological growth of the brain,” says John Gabrieli, the Grover M. Hermann Professor in Health Sciences and Technology.(13)


Methods
To determine the impact of environment on language development, I designed a study to test for one prevalent and easily quantifiable factor: the role of siblings. Throughout the fall, I held at least two individual interviews with all eleven students in a 3’s class at the Saint Ann’s Preschool. The interviews spanned anywhere from 5-10 minutes, and I assessed the individual’s language acquisition progress by evaluating their reception, expression, and vocabulary skills. To create a comprehensive and well-rounded set of questions for evaluation, I incorporated aspects of both standardized IQ and language tests, such as the Receptive-Expressive Emergent Language Test, Preschool language assessment instrument, the Stanford Binet, and the Reynell developmental language scale. Below were the categories I addressed, with respect to reception and expression.
Receptive/ Comprehension scale:
- Selecting 2 objects
- Relating 2 objects
- Verbs
- Sentence building
- Verb morphology
- Pronouns
- Complex sentences
- Inferencing
Expressive/ Production scale:
- Naming objects
- Relating 2 objects
- Verbs
- Sentence building
- Verb morphology
- Complex sentences (questions)
- Complex sentences (relative clauses)
- Complex sentences (passives)
- Grammaticality judgment
To test these skills, I asked questions from a book they were all familiar with (as to avoid confusion surrounding plot): Oscar Otter. The questions were as follows:
- Select and name 2 objects
- (Page 4,5): Answers: tree, rock, pond, water, otter, etc..
- Relate 2 objects (color)
- (Page 16,17): Answers: otters, background scenery, etc…
- Verbs (What is Otter doing?)
- (Page 20, 21): Answers: climb, build, etc…
- Sentence building
- (Page 42, 43): What is happening?
- S-V-O sentences or island structures (she kick as opposed to she kicks the ball)
- Inference:
- (54, 55) How does Oscar feel?
But from there I allowed the interview to take its own course-- the individual's thoughts and imagination guided the conversation, and I encouraged them to express themselves and elaborate on any points they felt were important. Occasionally, a child answered in incomplete sentences-- to answer a question such as, “What is Oscar doing?” they would simply reply with “jump” or “Oscar climb.” But in other situations, they would respond in detailed grammatical sentences, such as “I think he feels scared, but he’s going to be okay because look there’s his friend coming to save him, etc… ” Rather than trying to determine whether they could correctly analyze a situation, I was interested in whether or not their sentences were grammatical, and how they expanded on their ideas.
Next was my test on vocabulary, the questions arranged in no particular order and varying in difficulties. If a child were to answer a question correctly, I would encourage them to elaborate further, to apply their thoughts to the real world, to their own lives, etc…. If someone was unfamiliar with or misremembered a vocabulary word, I provided them with a hint and observed where that led them.
Above is the sheet I presented to the children in our interviews, with images they were asked to define. ‘Leaf,’ for example, was unanimously correctly identified, so I would follow up with a question such as: “Where can I find a leaf?” or “Do you know any types of trees?”… etc. Similarly, for ‘umbrella,’ I would follow up with, “Well when do you use an umbrella?” Only one of the students correctly defined “oval”, while most others responded with “I don’t know” or “circle” (a couple even responded with “hula hoop”). They were all familiar with stained glass, yet defining it posed some difficulty, so I proceeded to ask them about the birds in the stained glass. Most students were familiar with “stethoscope” but were challenged with its pronunciation. Their knowledge of words such as “bell” and “calculator” was pretty evenly divided between the class.

Given the open nature of this study, I determined levels of expression/reception from instinctive comparison, and vocabulary from comparison as well as number of correct and partially correct answers.
Results
Before researching and conducting the study, I hypothesized that the greater language immersion from siblings would increase the rate of language development. However, my findings proved the opposite-- the students with the fewest number of siblings displayed the highest levels of expression and vocabulary. With siblings present, there is generally less opportunity for two-way interaction with adults, the interactions responsible for influencing the brain’s language development processes. For example, if two young children are conversing, one may be more likely to monopolize the conversation or not respond in a way that supports the other’s communication. Additionally, parents may have less time to engage in Serve and Return interactions with the child if they are also attending to the needs of multiple siblings. Furthermore, when siblings use incorrect grammar or their own vocabulary, they can actually hinder the other sibling’s development. (14)

Discussion
The process of language development and the extent to which it is influenced by one’s environment and experiences is truly remarkable. “Literacy is a developmental process that is heavily mediated by social influences, as we can see when comparing children’s scribbles in their native languages. Children as young as two or three make markings that look identifiably like their own native languages, suggesting that, even before they have learned to write a single word, small children are engaged in an exquisitely complex process involving careful observation
and imitation, not to mention fine motor development and mental perseverance.”(11) For healthy development of brain circuits, the individual needs to have healthy experiences; the lack of these may lead to the underspecification and miswiring of brain circuits.
This exploration has only further expanded my curiosity regarding the developmental process. Something my study did not cover was the effect of online learning on language development. Experiments have been conducted in which babies at nine months have been exposed to French or Spanish, etc… in a live and playful environment. The results were remarkable-- they had fully attained the skills of a foreign speaker.(6) But when exposed to the same languages via video or audio, there was no learning whatsoever. “People need people to learn, at least when they’re young.”(6) The brain’s circuitry is activated by social interaction. Given the state of our digital age and the recent impacts of COVID, the preschool class I studied had the majority of their learning experiences online during their critical age of development exploring the impact of this online learning on language acquisition would be fascinating.
References
1.Karen DeBord, "Early Brain Development," University of California Ready to Succeed, last modified 1997, accessed May 18, 2023, https://ucanr edu/sites/ReadytoSucceed/Articles of Interest/Early Brain Development/
2 "Synaptic Pruning: Definition, Early Childhood, and More," Healthline, accessed May 18, 2023, https://www.healthline.com/health/synaptic-pruning.
3 Steven Pinker, The Language Instinct How the Mind Creates Language (London: Harper & Row, 2000), [Page 19]
4."An Argument Is Being Waged over Research on Children's Language," The Economist, last modified november 5, 2022, accessed May 18, 2023, https://www economist com/culture/2022/11/03/an-argument-is-being-waged-over-research-on-childrens-langua ge.
5 "A Guide to Serve and Return: How Your Interaction with Children Can Build Brains," Harvard University, accessed May 18, 2023, https://developingchild harvard edu/guide/a-guide-to-serve-and-return-how-your-interaction-with-children-can-bu ild-brains/#:~:text=You%20may%20have%20heard%20the,and%20reach%20their%20full%20potential
6.Adrienne L. Tierney, "Brain Development and the Role of Experience in the Early Years," National Library of Medicine, last modified july 25, 2013, accessed May 18, 2023, https://www.ncbi.nlm.nih.gov/pmc/articles/PMC3722610/.
7 Shukla S Acharya, "Mirror Neurons: Enigma of the Metaphysical Modular Brain," National Library of Medicine, last modified july 3, 2012, accessed May 18, 2023, https://www.ncbi.nlm.nih.gov/pmc/articles/PMC3510904/.
8 Hanna Marno et al , "Infants' Selectively Pay Attention to the Information They Receive from a Native Speaker of Their Language," National Library of Medicine, last modified august 3, 2016, accessed May 18, 2023, https://www.ncbi.nlm.nih.gov/pmc/articles/PMC4971095/.
9 Elaine Shiver, "Brain Development and Mastery of Language in the Early Childhood Years," IDRA, last modified april 2001, accessed May 18, 2023, https://www idra org/resource-center/brain-development-and-mastery-of-language-in-the-early-childhood-years/
10 "Bulletin #4356, Children and Brain Development: What We Know about How Children Learn," University of Maine, accessed May 18, 2023, https://extension umaine edu/publications/4356e/#:~:text=At%20birth%2C%20the%20number%20of,normal%20p art%20of%20brain%20development.
11. Erika Christakis, The Importance of Being Little: What Young Children Really Need from Grownups (New York, NY: Penguin Books, Penguin Random House, 2017)
12. Monica Rosselli, "Language Development across the Life Span: A Neuropsychological/Neuroimaging Perspective," National Library of Medicine, last modified december 18, 2014, accessed May 18, 2023, https://www ncbi nlm nih gov/pmc/articles/PMC4437268/
13. Anne Trafton, "Back-and-forth Exchanges Boost Children's Brain Response to Language," MIT, last modified February 14, 2018, accessed May 18, 2023, https://mcgovern.mit.edu/2018/02/14/back-and-forth-exchanges-boost-childrens-brain-response-to-language/.
14 Lu Hsin-Hui, "Association of Sibling Presence with Language Development before Early School Age among Children with Developmental Delays: A Longitudinal Study," Science Direct, last modified June 2022, accessed May 18, 2023, https://www sciencedirect com/science/article/pii/S0929664621003570
Blueprinting: An Exploration of the Cyanotype
Julia G. Mentors: Kim V. and Kristin F.Abstract
In this project, I’ve explored the cyanotype, a type of photographic printing process that utilizes ultraviolet light to produce the pigment Prussian blue. There were three categories to my research: pre production, production, and postproduction. In the pre production stage, I created and selected five different emulsions which I brushed onto watercolor paper. The first emulsion was a mix of two store bought solutions labeled A and B, which is perhaps the most common form of cyanotyping. The second and third were homemade versions of the store bought solution, only differing in the type of ferric ammonium citrate. The fourth solution was an entirely different process invented by a man named Mike Ware. The last emulsion was already coated on paper, and also store bought. In the next stage of research, I experimented with exposing the emulsion coated papers for different amounts of time, but all using the same negative. In the last stage, I experimented with bleaching and toning the prints, and for consistency’s sake, used only one type of paper. I then used the empirical results to hypothesize why the papers differed throughout all of the stages of production.
Introduction
Cyanotyping is an alternative photographic printing process, in which an iron emulsion is exposed to UV light to form Prussian Blue. The cyanotype process was invented by John Herschel, son of William Herschel– the man who discovered Uranus. Like his father, John Herschel was an astronomer, but he also practiced chemistry, and was deeply involved with the beginnings of photography. Herschel coined the terms negative and positive when referring to photographic images, and realized the effect of hyposulfite of soda on silver salts, leading to the popularization of “hypo” as a fixing agent. Herschel was intent on bringing color into photography, and spent much of his time experimenting with thousands of chemical combinations. Then, in 1842, he invented the cyanotype. 1
Herschel's discovery followed on the heels of many other chemists’ research. Count Bestuscheff first noticed color changes in iron salt solutions in 1725, which were then further described by Johann Wolfgang Doebereiner in 1831. Prussian blue was first prepared by Heinrich Diesbach sometime between 1704 and 1710, and by 1730, was utilized as a pigment in watercolor and oil paintings.
Herschel’s work with cyanotypes in the 1840s inspired Anna Atkins, the daughter of his friend Dr. John Children, to utilize the process in her botanical work. She produced three volumes of her book Photographs of British Algae: Cyanotype Impressions, which became the first examples of photographic illustrations in books. Atkins is often credited as the first female photographer.
By the 1880s, cyanotyping became known as a cheap proofing process to test images, before eventually printing them using silver or platinum based processes. Starting in the 1870s, and continuing through the 1950s (when it was replaced by diazo based reprographic
processes), cyanotypes were an integral resource for architects and engineers, earning the name “blueprints”. The first commercially available cyanotype paper was sold in France in 1872, by a company named Marion et Cie. The paper was marketed as “papier ferro-prussiate”. The process had fallen out of use in the art world, but in the 1960s, along with a number of other alternative photographic processes, it was revived.2
In 1994, Mike Ware, a member of the Royal Society of Chemistry, invented a new cyanotype process. He aimed to address some problems with the traditional method– long exposure times, “bleeding” of the Prussian Blue throughout the image, inability to store ingredients together, etc., by replacing one of the chemicals in Herschel’s method. 3
In the traditional cyanotype method, there are two integral chemicals: ferric ammonium citrate, and potassium ferricyanide:

Ferric Ammonium Citrate Potassium Ferrocyanide

When the two chemicals are in solution and exposed to UV light, they will react and form Prussian Blue. First, the energy from the UV breaks the bonds in the citrate, which then allows some of its electrons to reduce the iron to Fe2 Mike Ware’s solution works similarly, however he replaced ferric ammonium citrate with ferric ammonium oxalate, a more light reactive chemical. Once the iron has been reduced, the lowest energy state for the cyanide, Fe2+ , and Fe3+ , would be to form prussian blue– a crystal lattice of alternating Fe2+ and Fe3+ atoms, connected by cyanide bridges. 6

The crystal structure appears blue for two primary reasons. The first is “Ligand Field Theory,” which is also responsible for the coloring of most transition metals. The diagram below depicts the phenomenon.
The diagram above depicts the different shapes of a d-orbital (with the exception of the very first image which is just as s-orbital)– the blue orbs represent ligand groups (which in the case of Prussian Blue would be cyanide) and the red shapes represent the electron density In the top row of the diagram, the electron density points directly at the ligand groups, creating strain in the molecule, therefore making it higher energy In the bottom row, the electron density is pointed into the gaps between ligands, decreasing strain, and making for lower energy molecules. For electrons to shift from the shapes in the bottom row to the top row, an addition of energy is necessary. In the case of Prussian Blue, that amount of energy is equal to an orangish red wavelength of light. The molecule then absorbs the orange-red light, and reflects its complementary color, blue, to the eyes of the viewer. Prussian Blue is unique however, in that there is an additional reason for its blueness- the connectivity of the crystal structure. The alternating Fe3+ and Fe2+ are similar, but have slightly different electric environments. The electrons are able to pass back and forth between them, crossing the cyanide bridge. The energy needed to make this transfer is also equal to an orange-red wavelength of light. 8

The striking blue is largely what defines a cyanotype, however the color can be altered after a print has been made. When immersed in a basic solution, the Prussian Blue structure falls apart. The cyanides are replaced with hydroxides, destabilizing the Fe2+ and allowing the air to oxidize it to Fe3+ , breaking the pattern of irons holding the whole molecule together. The blue pigment disappears, but the iron remains bonded to the paper in its original location, preserving the latent image. The bleached paper can then be submerged into different solutions, which can bond to the iron, producing the same image with a different pigment.
In my project, I developed five different papers, utilizing both the traditional and Mike Ware cyanotype processes. I then created a series of full prints and test strips, to compare exposure times of the papers. Finally, I experimented with toning and bleaching.
Materials and Methods
Pre Production: Coating Papers
Paper 1:
Materials: Jacquard Cyanotype Set, measuring tools, watercolor paper, brush
Steps: Mix solutions A and B in equal amounts, at room temperature, and in dim light. Using a paintbrush, coat a piece of watercolor paper. Let dry in a dark place.
Paper 2:
Materials: 25 g ferric ammonium citrate (brown), 10 g potassium ferrocyanide, water, watercolor paper, brush
Steps: Dissolve both chemicals in around 100 ml water each. Mix together in equal amounts. Brush onto a piece of watercolor paper. Let dry in a dark place.
Paper 3:
Materials: 25 g ferric ammonium citrate (green), 10 g potassium ferrocyanide, water, watercolor paper, brush
Steps: Dissolve both chemicals in around 100 ml water each. Mix together in equal amounts. Brush onto a piece of watercolor paper. Let dry in a dark place.
Paper 4 (Mike Ware Solution):
Materials: 10 g potassium ferrocyanide, 30 g ammonium iron(III) oxalate, water, brush, watercolor paper
Steps: Measure 20 ml of water into a small glass beaker, heat it to 70 °C, and completely dissolve 10 g of potassium ferricyanide in it, with stirring; keep the solution hot. Measure 30 ml of water into a second beaker, heat to 50 °C, and dissolve in it 30 g of ammonium iron(III) oxalate. Add the hot potassium ferricyanide solution to the ammonium iron(III) oxalate solution, stir well, and set the mixture aside in a dark place to cool. If green crystals form, decant liquid from them, and dispose of them properly. Add water to the solution until exactly 100 ml. Brush onto watercolor paper, and store in a dark place.
Paper 5:
Materials: Cyanotype Store Cyanotype Paper (8x10)
Steps: N/A
Production: Exposing Prints
Materials: UV box (optional), coated (dry) paper, water, hydrogen peroxide (optional), negative, glass frame, thin cardboard slices
Steps:
Test strips: Cut coated paper into thirds/fourths. Put one in a glass frame. On top of the glass pane, place strips of cardboard in sequence, covering the paper underneath. Place from into the UV box (or outside), and expose for chosen interval of time (eg two min). After two min, remove one cardboard strip, and expose again for the same interval of time. Repeat until there are no more cardboard strips (do expose after the last one is removed). Wash paper in water until the water runs clear. Leave to dry.
Full Prints: Layer coated paper, negative, and glass pane in frame. Place the frame in the UV box (or outside). Expose for the chosen interval of time. Remove paper, and wash in water until the water runs clear. Leave to dry.
Optional: After washing print (test strip or full image), submerge briefly in solution of hydrogen peroxide and water. The print will immediately turn an intense blue, but the same blue should be achieved regardless after a longer period of time.
Post Production:
Brown toning (tannic acid): Add 28 ml non detergent ammonia to 240 ml water. Immerse the print until the image fades. In another container, mix 14 g tannic acid to 750 ml water. Remove the print from the ammonia solution and wash very well. Immerse in tannic acid solution until the print reaches the desired tone
Hibiscus: Add two dashes of sodium carbonate to 1 L of water. Immerse print for about one minute. Remove and wash well. Add 10 g hibiscus to 1 L of very hot water. Soak for around twenty minutes.
Brown toning (tea): Make a strong solution using any household tea (I used 23 g Oolong tea in 1 L water). After bleaching your print (sodium carbonate or ammonia) and thoroughly washing, immerse in tea until the print reaches the desired tone. To produce a very brown print, I bleached my image for 17 minutes and soaked it in tea for about 1 hour and 36 minutes.
Eggplant black: Add 3 drops of nitric acid to one L of water. Immerse print in solution for two minutes. Wash well. Add 14 g sodium carbonate to 160 ml water. Immerse the print in the solution until the image fades. Add 6 tbsp tannic acid to one quart of water. Immerse for a short time. Wash well.
Green toning: Immerse unbleached print in a solution of water and nickel(III) nitrate for at least an hour.


 Paper 1 (1-10 min)
Paper 2 (1-10 min)
Paper 3 (1-10 min)
Paper 4 (1-10 min)
Paper 1 (1-10 min)
Paper 2 (1-10 min)
Paper 3 (1-10 min)
Paper 4 (1-10 min)
*Digital color correction makes image seem less clear (in reality is much more visible)


Discussion
The first result we noticed was that even before being exposed to light, paper 4 (the Mike Ware paper) had turned blue. It had most likely reacted with the impurities in the paper, or the paper towels that were layered on the paper while it dried. This very heightened sensitivity might make the Mike aware process inconvenient unless incredibly high quality paper is available.
When we exposed the papers at various times, we found that paper 3 performed the best. It created a rich blue, and had contrast while still preserving mid tones. Paper two performed similarly, but required longer exposure times as a result of the different (and less recommended) form of ferric ammonium citrate. Paper 1 had a lot of contrast, but didn’t preserve the midtones as well. Most likely there was a sensitizer, perhaps a chromate solution, added to the store bought solutions, resulting in a much faster reaction. As a result of the initial reaction, Paper 4 resulted in an entirely blue image that was much less visible. However, we were able to bring back some of the highlights with a short sodium carbonate bleach. Paper 5 performed the worst. The pre coated solution was most likely less potent.
In post production, our brown/black prints were the most successful. The sodium carbonate bleach worked slightly better than the ammonia, differing only in that the sodium carbonate resulted in a much faster bleach. Our attempt to green tone was slightly unsuccessful, resulting in more of an aqua color. The hibiscus did bring back an image, however it closely resembled the original print, leading us to question if it created a different blue pigment, or brought back the Prussian blue. We were also able to slightly correct paper 4 with a short bleach— the image became more visible, but still lacked contrast.
References
1. Reed, Courtney, and About Courtney Reed. “Sections.” Ransom Center Magazine, 7 Dec. 2010, https://sites utexas edu/ransomcentermagazine/2010/12/07/from-blue-skies-to-blue-print-astronomer-john-hersc hels-invention-of-the-cyanotype/
2. Dusan C. Stulik and Art Kaplan. “The Atlas of Analytical Signatures of Photographic Processes.” Getty, The Getty Conservation Institute, https://www getty edu/conservation/publications resources/pdf publications/atlas html
3. "The New Cyanotype Process.” MikeWare, www.mikeware.co.uk/mikeware/New Cyanotype Process.html. Accessed 18 May 2023
4 “Ferric Ammonium Citrate ” National Center for Biotechnology Information PubChem Compound Database, pubchem.ncbi.nlm.nih.gov/compound/118984355#section=2D-Structure. Accessed 17 May 2023.
5 “Ferrocyanide Potassium ” National Center for Biotechnology Information PubChem Compound Database, pubchem.ncbi.nlm.nih.gov/compound/Ferrocyanide-potassium. Accessed 17 May 2023.
6 “Experiment 5: Photography - Cyanotypes ” Chemistry LibreTexts, 18 Sept 2020, chem.libretexts.org/Ancillary Materials/Laboratory Experiments/Wet Lab Experiments/MIT Labs/Lab 2%3A Re dox Chemistry/Experiment 5%3A Photography - Cyanotypes
7 “Crystal Field Theory” Crystal Field Theory, bouman chem georgetown edu/S02/lect32/lect32 htm Accessed 17 May 2023.
8 R J Mortimer, and AbstractSpectroelectrochemistry encompasses a group of techniques that allow simultaneous acquisition of spectroscopic and electrochemical information in situ in an electrochemical cell. Electrochemical reactions can be initiated by applying potentials to “Spectroelectrochemistry, Applications ” Encyclopedia of Spectroscopy and Spectrometry (Third Edition), 10 Oct 2016, www.sciencedirect.com/science/article/abs/pii/B9780128032244002880.
An Exploration of Electricity… and Guns
Henry A. Mentor: Justin P.Abstract
Making small things go fast is fun, but gunpowder is cliché and, frankly, overrated. May this paper present an alternative: the power of electromagnetic fields. In this project I explored the power of “railguns,” a type of projectile accelerator that harnesses the force of electricity and magnetism to shoot armatures at incredible speeds. I wanted to spend a year learning about the intricacies of the current and forces of electromagnetic fields, focusing my knowledge to build and test a railgun by year end. After gaining some foundational understanding, I launched into fabrication, gathering aluminum, copper, high voltage components, and lightweight projectiles to bring the concept to life. I started with a miniaturized proof-of-concept version featuring a graphite armature, aluminum foil, and 80 volts which worked surprisingly well, gaining a few centimeters of force. After this enthusing result, I moved to a larger model, testing various materials, voltages, and form factors to achieve acceleration. Aiming for an exit velocity of 10 meters per second, or around the velocity of gravitational constant “g.”
Introduction
The basis of my scientific exploration lies in the study of electricity and magnetic fields. Electricity represents the movement of charged particles, such as electrons or ions, through a circuit. The movement of these particles is driven by the presence of an electrical potential, or voltage, which creates an electric field that causes the particles to flow from areas of high potential to areas of low potential. A battery can create this imbalance of voltage thus generating the “flow.” This movement of particles, known as current, can interact with intermediary components as it passes through the circuit; it can release kinetic energy, as in a lightbulb, or flip a transistor, as in a computer. However, current is hindered by these components due to a factor called resistance. This is important for the railgun as resistance acts as an electrical friction, slowing the passage of current and limiting the acceleration of projectiles.1,2, 6
This project uses something called direct current (DC) as a way of powering its components as opposed to alternating current (AC). While achieving the same result in most situations, DC and AC have some important differences when it comes to the generation of electromagnetic fields.2 As current passes through a circuit, a magnetic field is generated around its flow. This field creates a literal force around the wire that varies with the voltage and can move and accelerate objects. A right hand made into a fist with the thumb sticking out is a representation of this model. The thumb represents the direction of current, and the fingers wrap around in the direction of the magnetic field. If the pointer and middle finger are stuck out at a right angle to each other and the thumb, the thumb now represents the direction of the velocity of the magnetic field, the pointer finger the direction of the magnetic field, and the middle finger the direction of the resulting magnetic force.3-5

A railgun is the combination of these two principles. A high voltage current flows through a low resistance circuit to generate an electromagnetic field of large magnitude, putting force on an object that accelerates it forwards.


The following is a derivation of acceleration due to electromagnetic fields:
Lastly, due to the high voltage it is necessary to inject the projectile with a certain threshold of initial velocity lest it literally weld and melt to the rails becoming immovable.

Materials and Methods

During my year of exploration on the subject, I designed and constructed two variants that used capacitors for voltage, and one miniature version that used batteries. All three were “hot rail” designs meaning there was no switch that controlled whether or not they would discharge, rather, the armature acted as the switch, completing the circuit and generating the force upon contact with the rails.

The smaller version was a proof-of-concept and basic in nature, outlining the core principles and ensuring that the final project goal was achievable with the small voltage I had available (it was executed with 80v rather than the eventual 180v that would be used in the final project). After a series of failed attempts where I shuffled voltages and materials, I settled on a graphite armature extracted from a pencil, aluminum foil roils, and a 3D printed ramp for initial velocity generation.
I then moved on to two larger form factors that used upwards of 180v in the form of capacitors and metals with lower resistance. Capacitors are basic electrical components that can store and discharge energy completely quickly and with low resistance. Perfect for railguns.7 To charge them I used what is, in retrospect, the highly inefficient method of chaining together 9v batteries, stacking to reach the desired voltage threshold.
The first design used cylindrical aluminum rods and an aluminum ball of .43 caliber that would roll across the top and receive force from the current passing through it. Part of the theory for this experiment was to test what would change if the current passed through a non-linear path. The typical railgun uses two parallel rails on either side of the projectile to create the force. I wanted to see if the acceleration would change if the current had to pass through a hyperbolic shape rather than a planar one. For initial momentum I used the same yellow ramp above, utilizing the carved in bevel to roll the ball.
The second was a more traditional design that used copper rods, a metal of even lower resistance than aluminum, stacked next to each other in order to provide a perpendicular transfer of current, and a short copper armature.
Results
The sc armature an average of ~1.73 centimeters due to the electromagnetic force. The following images illustrate this process, the far left shows the sparking, the middle is a sample of the distance without current and the far right shows the distance achieved with current.


Regrettably, the larger models, despite exhaustive tests and numerous designs, never achieved the calculated velocities I tried t achie The following imag samples of the sparks created by the circuit.

The sparking was highly bar and sending metallic particula
Discussion
Though the larger railguns never achieved the success level I anticipated, it was still interesting to learn and play with the concepts involved in the project, building, testing, and getting electrocuted along the way That being said, the miniature model was a triumph that propelled me through the rest of the year and trying to get a direct correlation between volts used and distance traveled made for an interesting delve into the acceleration formula I initially derived.
There were numerous issues in the manufacturing phase of my project, as there invariably are in an engineering project, the most pressing of which were casing, structural integrity, building sufficient voltage, friction, and minimizing resistance. Due to the explosive nature of the railgun, it was necessary to encase the rails in a strong, non-conductive material lest they blow themselves apart during firing. I opted for 3D printed parts for both designs; parts which by the close of my project were heavily damaged. Voltage was another main issue. While chaining 9v’s would work indefinitely, it was spatially inefficient and became dangerous quickly. If I were to do this again, I would opt for a DC-DC boost-converter to circumvent the issue of battery stacking. Lastly, low resistance was a priority that was difficult to comply with. Though copper is

second to a few metals (silver, gold) in resistance, it still removed some of the total acceleration the system would hope to derive.
I hope to reopen this project at some point and complete it in the larger scaled version, learning from the engineering mistakes I made along the way this year
References
1 Just Energy (2022, August 16) How does electricity work?: Learning source Just Energy Retrieved May 6, 2023, from https://justenergy.com/blog/how-does-electricity-work/.
2 Direct current Direct current - Energy Education (n d ) Retrieved May 6, 2023, from https://energyeducation ca/encyclopedia/Direct current#:~:text=Direct%20current%20(DC)%20is%20an,all%20dev ices%20that%20use%20batteries.
3. Right hand rule. PASCO scientific. (n.d.). Retrieved May 6, 2023, from https://www pasco com/products/guides/right-hand-rule
4 Electric field (n d ) Retrieved May 6, 2023, from http://hyperphysics phy-astr gsu edu/hbase/electric/elefie html
5. Admin. (2022, December 7). Force due to a magnetic field: Force due to a electric field: Definition & Formula. BYJUS. Retrieved May 6, 2023, from https://byjus.com/physics/magnetic-electric-force-charge/.
6 Harris, W (2023, March 8) How rail guns work HowStuffWorks Science Retrieved May 6, 2023, from https://science howstuffworks com/rail-gun1 htm
7. Brain, M., & Pollette, C. (2007, September 17). How capacitors work. HowStuffWorks. Retrieved May 6, 2023, from https://electronics howstuffworks com/capacitor htm
8 Keller, J (2021, July 14) The Navy's electromagnetic railgun is officially dead Task & Purpose Retrieved May 6, 2023, from https://taskandpurpose.com/news/navy-electromagnetic-railgun-dead/.
Further watching:
● https://www youtube com/watch?v=g 2q-n-y9 g
● https://www.youtube.com/watch?v=YH08iDj2yic
● https://www.youtube.com/watch?v=fKEaDhDTciQ
● https://www youtube com/watch?v=HNhfc-MJg2M
● https://www youtube com/watch?v=OSce3nEY6xk
The presence of staphylococcus at Saint Ann's Lucy G.
Mentor: Carlos P.
Abstract
My experimental and literature research-based project was focused on understanding the presence of Staphylococcus within Saint Ann's. I was interested in how hand washing and age/grade play a role in the amount of bacteria present on a subject's hands.I wanted to explore why this bacterium, which commonly exists on the skin and inside of the nasal canal of 30% of people, is sometimes a mechanism of illness while, at other times, it is required for a healthy and balanced microbiome. Twenty students from each of the following grades: 4th, 6th, 8th, 11th, and 12th, were selected to be swabbed using sterile Q-tips. Half of the students in each grade vigorously washed their hands before their palms were swabbed, while the other half did not wash their hands prior to the swap. Staphylococcus selective agar plates were used to culture all 80 samples, and after a 48-hour incubation period, the petri dishes were observed, growth was photographed, and the amount of colonies present was noted. Later, a species identification key provided by the supplier of the Petri dishes was used to identify the species of Staph present in the samples. The data was then analyzed using Google Sheets to create graphs and pivot tables. While analyzing the data a found that 50% of fourth graders developed bacteria growth regardless of hand washing, while 90% of sixth graders, 100% of eighth graders, and 95% of eleventh and twelfth graders developed colony growth regardless of hand washing. Across all age groups 80% of students that did not wash their hands prior to swabbing developed bacterial colonies in their samples, And 87% of students that did wash their hands developed Colony growth in their samples. It is difficult to determine any absolute conclusions from these numbers because of the sample size. But it is possible to observe trends. There's a trend towards more colonies being present as the students get older, and there is very minimal observed difference between the groups of students that washed their hands and those that did not. It is also notable that I found Staphylococcus present in much higher concentrations than in the general population.
Introduction
Staphylococcus is a genus of bacteria that includes more than 30 individual species. Staph species are generally divided into two categories: coagulase-positive staphylococci (CoPS) and coagulase-negative staphylococci (CNS). Coagulase is an enzyme produced by various microorganisms that leads to a reaction that converts fibrinogen to fibrin.14 Fibrogen is a soluble macromolecule, but after the conversion to fibrin, insoluble fibrin clots are formed. This is relevant to staph infections because these insoluble clots are what allow abscesses to form within the host's body As these abscesses form, they can develop into lethal forms of sepsis, which is what makes serious staph infections so deadly. CoPS species have the ability to create fibrin clots. S. aureus is generally a CoPS, but not all S. aureus strains are CoPS. There are 11
other types of CoPS species.13 When a Staph species is CNS that means that it does not have the ability to convert fibrinogen to fibrin. Certain species of staphylococcus are “common commensals of skin.” Alongside being CNS, commensals are microorganisms that are on the surface of the body that do not harm human health, meaning they work with the human skin flora, and live in harmony and symbiosis with the human body. Many species of commensal bacteria are opportunistic pathogens. They take advantage of opportunities not typically available to them, such as hosts that are elderly or immunocompromised. Many species of staph are opportunistic pathogens and do not typically cause life-threatening infections in healthy people. Not all CNS are completely safe; some can cause infections even if the host does not have an impacted immune system.
Staphylococci are gram positive cocci about1μm in diameter. This means that they tend to be round bacteria and appear purple because of the ‘Gram’ staining method. They tend to form clumps due to the bacteria’s 'sticky’ surface because of the polysaccharides present on their surface. The polysaccharides on the surface of staphylococci are evolutionarily beneficial to the bacteria as being sticky allows them to more easily adhere to surfaces and form larger colony groups.29 Staph also tends to be salt tolerant, which allows them to be able to survive osmotic and ionic stress. Some species of staph are also hemolytic, meaning that the pathogen is able to break down blood cells through a process called hemolysis. A test can be performed for hemolytic bacteria with blood agar plates. Blood agar plates are made with mammalian blood as a nutrient for the bacteria. 4
Staph is present in many different locations, including human skin, the nasal passages, the inguinal area, and others. Methicillin-resistant Staphylococcus aureus (MRSA) has been shown to be able to survive on surfaces for several months, specifically materials like towels, clothing, and other linens.26 Different species of staph are more common in different locations in the human body. For example, S. epidermidis is most commonly found on human skin.
Pathogenesis refers to the manner of development of a disease. Different pathogens have different pathogenicity factors, or the way the pathogen infects the host and makes them sick. Staphylococcus has many different pathogenicity factors, commonly referred to as virulence factors. Some of the most important virulence factors for staph are capsules, biofilms, enzymes, and toxins. Capsules and biofilms are produced by pathogens to prevent the process of phagocytosis or other immune system responses. Capsules and biofilms also allow the pathogen to more effectively resist antibiotics and develop more colonies on the host. Enzymes are used by the pathogen to evade immune responses and counteract them. Certain enzymes will deactivate immune cells and prevent them from carrying out their function. Toxins are produced by the pathogen to directly damage the host and interfere with the way their bodies’ organ systems would typically function. 27, 28
One immunological defense against infection is a process called phagocytosis. Phagocytosis is a defense where phagocytes engulf microbial pathogens via their plasma membranes. An internal compartment called a phagozone is formed that digests and disposes of the pathogen. This process is referred to as exocytosis.7 Other defenses against Staphylococcus infections include
typical immune system functions. The human body has several different natural defenses, including physical barriers like the epidermis, mucosal membranes, and lysosomes which help to remove pathogens from the human body. The combination of warm water, antibacterial soap, and vigorous scrubbing has been proven to effectively reduce bacteria on hands. Hand sanitizer and other alcohol based sanitizing products also have the same effect. Antibiotics are one of the key components of bacterial infection treatment. Certain forms of staph have developed antibacterial resistance over the years. Specifically MRSA: Methicillin-resistant S. aureus is an antibiotic resistant strain of staph, and can lead to major infections that are very hard to treat. These infections often begin in hospital settings.
Types of Staphylococcus
Staphylococcus saprophyticus is a gram positive, coagulase negative, non-hemolytic species of staph. This specific strain of staph is a uropathogen. Like other uropathogens, S. saprophyticus utilizes urease, an enzyme that has a toxic effect on human cells, to produce ammonia. It most commonly affects non-immunocompromised people. Between 5% to 20% 8 of non-hospitalized patients treated for a staph infection will have Staphylococcus saprophyticus. This most commonly leads to infections of the urinary tract and epididymis. UTIs from Staphylococcus saprophyticus are typically treated with nitrofurantoin at a dose of 100 mg orally twice daily for five days or trimethoprim-sulfamethoxazole (TMP-SMX) 160 mg/800 mg. This most commonly leads to infections of the urinary tract and epididymis" It can also lead to a condition called Prostatitis. Staphylococcus saprophyticus is resistant to the antibiotic novobiocin. It is a common commensal bacteria of the human urinary tract and genitalia.8
Staphylococcus schleiferi is a gram positive species of staph, and has two subspecies. One of the subspecies is CNS while the other is CoPS. To detect the subspecies, culturing on blood agar is required. In my experimentation, I did not differentiate between the two species. Both species lead to human and animal infection, and it is considered a veterinary pathogen. Staphylococcus schleiferi is most commonly found in cats and dogs. Staphylococcus schleiferi is a commensal microflora of both humans and animals. Commensal microflora provide the host with essential nutrients and protect the host from other pathogens.,and in return the host provides the bacteria with a safe place to live. In short, Staphylococcus schleiferi has a symbiotic relationship with humans and animals, but Staphylococcus schleiferi can give way to surgical site infections in humans and animals. In humans, Staphylococcus schleiferi leads to the following infections: pediatric meningitis, endocarditis, and intravascular-device related bacteremia. 40% of Staphylococcus schleiferi is resistant to the antibiotic methicillin. 9, 10
Staphylococcus lugdunensis is a CNS and leads to severe illness. It has a specifically virulent clinical presentation, meaning it is highly infectious and has the capability to make a lot of people very sick. The incidence of Staphylococcus lugdunensis is estimated to be 53 per 100,000 per year. For every 100,000 admissions, 5.6 patients are admitted for Staphylococcus lugdunensis related infections. It most commonly affects middle-aged and elderly people, and is slightly more prevalent in women. Staphylococcus lugdunensis leads to life-threatening skin and soft tissue infections, as well as an aggressive form of infective endocarditis (IE). IE is
associated with abscess formation and a high mortality rate. Staphylococcus lugdunensis is the second most common IE pathogen after another form of staphylococcus. IE is treated with a drug called β-lactam. Staphylococcus lugdunensis can also lead to bone and joint infections and pelvic girdle infections. All Staphylococcus lugdunensis infections typically present with abscess formation, which are treated with antibiotics and drainage. While Staphylococcus lugdunensis is not antibiotic resistant, it is “methicillin-sensitive”. 2
Staphylococcus haemolyticus is gram positive and CNS. This particular Staphylococcus strain is most typically found on the epidermis and in the inguinal area. It most commonly leads to catheter-associated UTIs and sexually transmitted UTIs. Many infections caused by Staphylococcus haemolyticus are hospital-acquired infections. It typically does not make people particularly sick and is one of the most common forms of staph. 15
Staphylococcus aureus is CoPS and gram-positive. It does not normally cause infection on healthy skin, and is part of the normal human skin flora most commonly found in the nasal passageway. Approximately 50% of adults have Staphylococcus aureus on them at some point. It is both communally and hospital acquired. Healthcare workers and people who use needles, such as intravenous drug users, on a regular basis have higher rates of Staphylococcus aureus. Staphylococcus aureus is the most common cause of skin/soft tissue infections, as well as leads to abscesses and cellulitis. Cellulitis is an infection of the underlying layers of skin and can occur anywhere in the body, most commonly in the arms and legs. There is not always an obvious injury that leads to the infection, and it's often very challenging to treat.18 Staphylococcus aureus can cause infection when allowed to enter the bloodstream and internal tissues, and can lead to a multitude of different types of infections such as septic arthritis, toxic shock syndrome, urinary tract infections, pulmonary infections, and meningitis. Penicillin is the drug most commonly used for Staphylococcus aureus infections. MRSA strains of staph are treated with a medicine called vancomycin.19
Staphylococcus intermedius is part of the normal human skin flora and is CoPS. Additionally, it's a zoonotic pathogen, meaning it can move from animal to human. Infection from Staphylococcus intermedius is rare. It's found in pigeons, and most serious infections are related to dog bites. It is detectable in 18% of dog bite wounds and part of the normal dog microbiome. There are very low rates of Staphylococcus intermedius transmission from human to human. It typically leads to brain abscesses and infections of the soft tissue. 16, 17
Staph related illnesses
Toxic shock syndrome: Most people's immediate association with toxic shock syndrome (TSS) is tampons. Toxic shock syndrome is most common in otherwise healthy young women who have inserted a tampon or another intrauterine menstrual product, such as a menstrual cup or menstrual pad. This is because TSS is caused by bacteria, not the tampon itself. It is also possible to get non- menstrual TSS, as men and children can also get toxic shock syndrome. Risk factors associated with TSS include using tampons for a prolonged period of time (the most common risk factor), barrier contraceptives that are internally inserted into the vagina, recent birth,
miscarriage, or surgery as a result of staphylococcal or streptococcal infection. TSS is caused by toxins produced by Staph aureus, but TSS is not always caused by staph, sometimes caused by Streptococcus bacteria toxin production. Staphylococcus aureus infection causes a release of toxins which trigger an immune reaction involving cytokines and chemokines (both immune cells). Symptoms of TSS are high temperature, seizure, confusion, rash on palms and feet, vomiting and/or diarrhea, headaches, and redness in eyes, throat and mouth. The Clinical Criteria for TSS requires multiple organ systems to be involved. The organ systems involved can be gastrointestinal (vomiting and diarrhea), muscular (myalgia), mucous membranes, hyperemia (lots of bleeding), vaginal, oropharyngeal or conjunctival, hemologic (the patient must have a platelet count less than 100,000/mm^3), central nervous system (disorientation, alterations in Consciousness, and seizures, hepatic (increased enzyme levels double the normal laboratory levels), and renal (blood in urine and urinary sediment with pyuria).
TSS treatment must target the multisystem organ failure brought on by the toxins in the bloodstream. Treatments may include antibiotics, pooled immunoglobulin (antibodies taken directly from donated blood), respiratory assistance such as oxygen or, in severe cases, ventilation, IV fluids to prevent organ damage and dehydration, blood-pressure control medicine, dialysis to assist renal problems, and surgery. Surgery is a last resort to remove dead tissue and occasionally amputate an affected limb. 1, 23
Infective endocarditis: Bacterial endocarditis is an infection of the inner layer of the heart along with the heart valves. Endocarditis affects the epicardium, myocardium, and endocardium (the three layers of the heart). There are four valves in the heart which can be affected by endocarditis, the tricuspid, mitral, pulmonary, and aortic. When someone has endocarditis, the functionality of these valves is greatly decreased. The body will have to work much harder to circulate the blood properly. Clumps of bacteria (Staphylococcus aureus) grow on the valves of the heart. These clumps can break off and float free in the bloodstream, spreading the infection to other organs. Risk factors for infective endocarditis (IE) are typically heart problems such as a heart valve defect ( an abnormality or a defect in one of the valves of the heart can provide easier places for bacteria to grow), congenital heart disease, and previous heart disease. Other factors include being an intravenous drug user, poor dental hygiene, a weak immune system, and being immunocompromised. The most common cause of IE is Staphylococcus aureus but it can also be caused by other Staphylococci, such as Staphylococcus lugdunensis. Most people who get bacterial endocarditis have prior damage to their heart or some form of heart disease. Staphylococcus aureus infective endocarditis comes from S.aureus being present in the bloodstream. The symptoms of IE are fever, fatigue, coughing, shortness of breath, nausea, headaches, swelling of the feet, legs and abdomen, skin lesions and rashes. Similar to most bacterial conditions, bacterial endocarditis is treated with antibiotics; occasionally surgery will be required to remove damaged heart tissue. Antibiotics are often administered via IV during an inpatient hospital stay The type of antibiotic is determined based on the strain of bacteria that caused the endocarditis. S.aureus endocarditis is most often treated with penicillin, but if it is an antibiotic resistant strain such as MRSA, a team of doctors will work together to assess the best form of antibiotic for treatment. Valve replacement is often required after severe endocarditis.
Materials and Methods
When beginning research for this project, I was interested in bacterial culturing. In the wake of Covid and increased awareness of hand washing. I was also interested in the efficacy of hand washing at the bacterial level. I decided that I wanted to observe the presence of bacteria before and after hand washing in the Saint Ann's School student population, taking into account age as an additional factor alongside hand washing. I opted to collect this data by swabbing the palms of students. Once I had decided on a direction for my project I began the next steps of organizational Preparation.
I began by contacting school administrators and science department teachers to ask permission to swab students. Once I obtained clearance to swab students’ palms, I moved on to selecting both a specific bacteria to swab for and my materials. I decided to swab for Staphylococcus species. I chose staphylococcus because it is both an interesting bacteria that is well known and quite prevalent. Additionally, one of the most common preventions for Staph infection is hand washing, which I found to be relevant to my research question. Now that I chose the specific bacteria, I decided on using Staphylococcus select plates. Staphylococcus select plates only allow Staphylococci species to grow on the agar. I used Bio Rad Laboratories SA select direct identification agar plates.Using the direct identification plates method, I was able to determine which strains of Staphylococcus were present without sending my samples out to a laboratory. Additionally I used sterile cotton swabs meant for sample collection to obtain my samples. My next step was my experimental design.
I determined an adequate sample size based on cost of materials and maximizing how many students I could collect samples from, and then divide that sample size into two groups. The first group would wash their hands for 45 seconds with two pumps of antibacterial soap. To prevent contamination after this group washed their hands, they would not dry their hands with an air dryer or paper towels, but instead would allow them to air dry. Additionally, this group would not turn the water faucet off after finishing washing their hands. I would observe the hand washing process to ensure all of this is done properly. After hand washing, I collect a sample with a sterile swab. Next, I streak the sample across the agar plate following proper laboratory procedure for a lack of contamination. The procedure for the second group was very similar to the first in terms of sample collection, but the second group did not perform hand washing. The second group served as a control. I hoped to obtain the average level of bacteria present without hand washing in the Saint Ann's community from this group. My next task was to figure out my sample size and how I would divide the two groups.
The sample size was made up of 80 students from across Saint Ann’s student population. I split the group of 80 into four groups of 20, dividing them evenly by grade with 4th graders, 6th graders, 8th graders, and upperclassmen (11th and 12th grades) (See figure 1). Each grade group was then divided in half, resulting in two groups of 10 per grade.The first group of 10 were the Treatment Group, washing their hands prior to sample collection. The second group was the Control Group. (See figure 2) I repeated the procedure for all four of my grade-based
groups, which concluded my sample collection. It should be noted that while collecting samples, I wore gloves and followed proper laboratory procedure for minimizing the chances of contamination. Next, the samples were incubated at 35° to 70°C for 18 hours before observation. During observation, I photographed every single petri dish and recorded the counts of bacterial colonies present in each dish. I used the SA select species identification guide provided by the manufacturer of the Petri dishes to determine which species of staphylococcus was present in each sample.

The following ingredients are present in these specific agar plates: 1) Peptone, 19 g/l. Peptone is used for preparing microbiological culture media in a lab environment. A peptone is a protein, made by enzymatic or acidic digestion. 20 2) Salt mixture, 38 g/l. The salt mixture present in these plates inhibits the growth of yeast, gram-negative bacteria, and gram-positive bacteria other than staphylococci. Salt is also used to inhibit microbial growth; it draws the water out of cells through a process called osmosis, which reduces the water available to bacteria and therefore slows bacterial growth and reproduction. Salt is generally used as a preservative.21

3)Chromogenic substrate, 0.15 g/l. This substrate is used for the direct identification of Staphylococcus aureus. The substrate also allows for the differentiation of additional species.
4) Antimicrobial and antifungal, 0.1 g/l. The antimicrobial and antifungal agents are used for similar purposes to the salt mix. They help to prevent the growth of Gram-negative bacteria and Gram-positive bacteria that are not staphylococcus. 5) Agar,12 g/l Agar is a solid and jelly-like substance, it's made up of agarose and agaropectin. Agarose is a polysaccharide made up of repeating units. Agaropectin is also a polysaccharide made up of acid groups like sulfate and pyruvate. 22
Figure 1 Figure 2Results
A total of 80 students were swabbed. There were 20 students in each group, the groups were determined by grade. In the first group of fourth graders, of the ten students whose hands were not washed prior to sample collection, 40% developed colonies on their sample. Of that 40%, 0% of students had Staphylococcus haemolyticus (S.h) present in their sample, 50% had Staphylococcus aureus (S.a), 25% had Staphylococcus schleiferi (S.sch), and 25% had Staphylococcus lugdunensis (S.l). Of the ten 4th graders that washed their hands prior to sample collection, 60% of them had colony growth. Of that 60%, 83% had S.h present in their sample, 16% had S.a present, 16% had S.ch present, and 33% had S.l present (Table 3). In the second group of 6th graders, 90% of the ten students that did not wash their hands prior to sample collection had colony growth. Of that 90%, 77% had S.h present in their sample, 66% had S.a present, 33% had S.ch, 55% had S.l present, and 22% had Staphylococcus saprophyticus (S.sap) present. 90% of the ten students that did wash their hands prior to sample collection had colony growth. Of that 90%, 33% had S.h present in their sample, 22% had S.a present, 88% had S.ch, 44% had S.l present, and 11% had Staphylococcus cohnii (S.c) present. (Table 4) In the third group of 8th graders, 100% of the ten students that did not wash their hands prior to sample collection had colony growth. Of that 100%, 90% had S.h present in their sample, 10% had S.a present, 70% had S.l present, and 10% had S.sap present. 100% of the ten students that did wash their hands prior to sample collection had colony growth. Of that 100%, 100% had S.h present in their sample, 20% had S.a present, 40% had S.ch, 30% had S.l present, and 10% had S.sap present. (Table 5) In the fourth group of 11th and 12th graders, 90% of the ten students that did not wash their hands prior to sample collection had colony growth. Of that 90%, 88% had S.h present in their sample, 22% had S.a present, 22% had S.ch, 22% had S.l present, and 11% had S.sap present. 100% of the ten students that did wash their hands prior to sample collection had colony growth. Of that 100%, 80% had S.h present in their sample, 30% had S.a present, 10% had S.ch, 60% had S.l present, and 20% had S.sap present. (Table 6)
Discussion
Prior to my experiment and research, my hypothesis was that hand-washing would reduce bacteria levels on subjects' hands. I also felt that age would influence bacterial level. My assumption was that fourth and sixth graders would have more bacteria present than eighth graders and upperclassmen,. My hypothesis was rejected. By far, the grade with the lowest levels of any staphylococci species was fourth grade. They had significantly lower levels of bacteria in both the washed hands group and unwashed hands group. Both 8th graders and upperclassmen had nearly 100% bacterial contamination rates in both of the unwashed and washed hands groups. And even more surprising was that the levels of staphylococci present in the groups that washed their hands prior to sample collection were equal or higher to the group that did not wash their hands before sample collection. Because of my sample size (which was constrained due to budget), it is hard to draw definitive conclusions about trends, but it is possible to conclude that staphylococcus haemolyticus was by far the most prevalent species of staphylococcus. This makes sense as this is one of the most common forms of staph that my agar plates were able to identify. Similarly, the very low levels of Staphylococcus cohnii also makes sense, as this species is much rarer than others that the agar plates were able to identify. I was ultimately confused by the high levels of staphylococcus species in my treatment group.


Both scientific literature and experience tell us hand washing works to reduce bacteria, but my research draws the exact opposite conclusion. This led me to question what may have happened. Ultimately, I have two possible causes of the discrepancy between my research and the general conclusions of the scientific community.
1) A contaminated water supply. I performed all of my tests on the 7th floor of the St Ann's school building. While I used several different sinks for the hand washing portion of my experiment, they draw from the same water supply. A contaminated water supply would explain the high levels of staphylococcus present in the treatment group. I cannot reasonably rule this possibility out as I did not test the water for staphylococcus.
2) Massive contamination of samples. I believe it is possible that something went wrong during either the incubation process or my sample collection. I put in place every possible precaution I could think of to prevent cross-contamination of samples, but it is possible.
Conclusion
To fully understand the results of my project, I believe further testing and experimentation is required. The conclusion of this research is not that hand washing is ineffective, rather that there was scientific error somewhere along the line, either with the water supply or with my scientific procedure. I believe that using the same plates to culture a sample of the water from each sink on the 7th floor could start to untangle the results. Additionally, sending a water sample to an outside lab for testing could be greatly informative. If both of these tests showed no signs of bacterial contamination, then we could conclude that my unpredictable results were the results of poor laboratory procedure and contamination of samples. I also believe it would be fruitful to repeat the experiment using hand sanitizer, and other forms of alcohol cleansing products.
Acknowledgments
I'd like to thank my mentor Carlos Perez for assisting me with this project. I'd also like to thank Jared Cross for helping me with some of the statistical analysis elements. Also Michele Levin, and my parents Alex Boro and Elizabeth Gaffney.
References
1. Minnesota Department of Health. (n.d.). Staphylococcus aureus: The basics. MedlinePlus. (n.d.). Staphylococcal infections
2 Baddour, L M , Wilson, W R , & Bayer, A S (2019) Staphylococcus aureus infections In StatPearls StatPearls Publishing.
3 Hartmann, A , Rothballer, M , & Schmid, M (2019) Salt tolerance and dependence are widespread among staphylococci. Frontiers in Microbiology, 10, 2791.
4 US Micro Solutions (n d ) Staphylococcus aureus
5. Department of Microbiology, Iowa State University. (n.d.). Microbiology 010 - Hemolysis.
6 Nauseef, W M , & Borregaard, N (2014) Phagocytosis of bacteria and fungi In K Ley, C A Reynolds, & J D Luster (Eds ), Immune-mediated diseases: From theory to therapy (pp 77-96) Elsevier
7. Ben Zakour, N. L., & Beatson, S. A. (2017). Staphylococcus saprophyticus infections. In StatPearls. StatPearls Publishing
8. Wikipedia. (2021, November 27). Staphylococcus schleiferi. In Wikipedia.
9 Belkaid, Y , & Harrison, O J (2017) Commensal bacteria: Prime time for colonization and persistence
Frontiers in Immunology, 8, 126
10. Holland, T. L., & Fowler Jr, V. G. (2021). Staphylococcus lugdunensis infection. In UpToDate
11 Cui, B , Smooker, P M , Rappuoli, R , & Savino, S (2020) Staphylococcus aureus infections: Epidemiology, pathogenesis, clinical manifestations, and management. In C. Dong (Ed.), Molecular pathogenesis of staphylococcus aureus (pp 79-103) Academic Press
12 Tong, S Y , Davis, J S , Eichenberger, E , Holland, T L , & Fowler Jr, V G (2015) Staphylococcus aureus infections: Epidemiology, pathophysiology, clinical manifestations, and management. In P. D. Howell (Ed.), Antimicrobial drug resistance (pp 323-337) Springer
13. A., Ballhausen, B., Idelevich, E. A., Köck, R., & Becker, K. (2014). Human and animal infections due to Staphylococcus intermedius In F Allerberger & M Wagner (Eds ), Listeria, listeriosis, and food safety (pp 309-327). CRC Press.
14 S Minnesota Department of Health (n d ) Staphylococcus aureus: The basics
15 Novick, R P , & Balaban, N (2010) Staphylococcal biofilms and their role in chronic infection In F F Tuomanen, S. L. Wessels, & C. A. Mitchell (Eds.), Microbial biofilms (pp. 95-131). American Society of Microbiology
16. Baveye, P. C. (2000). Peptones. In J. F. Kennedy & G. O. Phillips (Eds.), Food hydrocolloids: Structures, properties, and functions (pp 239-251) Royal Society of Chemistry
17 Berger, K A , & Breitkopf, C R (2
18. Bio-Rad. (n.d.). Agarose.
19 Mayo Clinic (n d ) Toxic shock syndrome R
20. Cedars-Sinai. (n.d.). Bacterial endocarditis (adult).
21 Centers for Disease Control and Prevention (n d ) Staphylococcal food poisoning
22. Centers for Disease Control and Prevention. (n.d.). Environmental survival of MRSA.
23. News-Medical.Net. (2021, May 5). Staphylococcus aureus virulence factors.
24 Czekaj, T , Ciszewski, M , & Szewczyk, E M (2020) Staphylococcus aureus as a pathogen In R Ahmad (Ed.), Molecular medical microbiology (pp. 171-189). Academic Press.
25 Othman, N (2020) Impact of temperature on Staphylococcus aureus biofilm formation and antimicrobial resistance. Journal of Pure and Applied Microbiology, 14(4), 2751-2759.
26 Centers for Disease Control and Prevention (n d ) Environmental survival of MRSA
27 News-Medical Net (2021, May 5) Staphylococcus aureus virulence factors
28. Czekaj, T., Ciszewski, M., & Szewczyk, E. M. (2020). Staphylococcus aureus as a pathogen. In R. Ahmad (Ed ), Molecular medical microbiology (pp 171-189) Academic Press
29. Othman, N. (2020). Impact of temperature on Staphylococcus aureus biofilm formation and antimicrobial resistance Journal of Pure and Applied Microbiology, 14(4), 2751-2759
climate scenarios implications on a Boa Constrictor imperator
Ayo Z. Mentor: Andrew J.Abstract
As a two degree celsius warming scenario seems to be inevitable, researchers have begun to determine how fauna will react to various aspects of climate change. Heavily researched and written species are often the ones deemed most vital such as livestock, for example studies have shown that the anticipated increases in thermal stress on cattle due to climate change will increase water requirements for these animals by about 2.5 times . It is vital to look at more than just livestock though as James Lovelock’s Gaia hypothesis states organisms interact with their inorganic surroundings on Earth to form a synergistic and self-regulating, complex system that helps to maintain and perpetuate the conditions for life on the planet. If this is to hold true the sustainability and survival of all species should be valued and researched. However insightful studying thermal stress in cattle may be, if and by how much this thermal stress will change the water requirements for reptiles such as the boa constrictor imperator (B. c. imperator)remain unknown. In my study I monitored the drinking frequency and duration of a B. c. imperator undergoing 2 degree celsius changes, monitoring for changes in behavior corollary to stress. The B. c. imperator’s water consumption times stayed consistent throughout the control and the experiment though the drinking periods went up by 2.7-1.3 times compared to the control indicating that the B. c. Imperator was under thermal stress.
Introduction
Humans continue to degrade the environment through continually rising atmospheric carbon emissions . A 2°C warming scenario is expected in around the next eighteen and a half years.1 Studies determining how warming will affect fauna, especially mammals and livestock have been well documented however reptilian studies seem to be lacking. The National Drought Mitigation center is one of these many groups studying how future climates may affect species we as humans directly rely on such as cattle. “Access to cool, clean drinking water is essential to keep an animal's internal body temperature within normal limits. ”2 studies regarding mammals and climate change have been well researched however far fewer researchers seem to be looking into how reptiles will respond to a warming climate. Thermal stress responses in reptiles and by how much this thermal stress will change the water requirements of the Boa constrictor imperator remain unknown. In this study I assess how a 2°C climate change scenario would potentially impact and elicit a heat stress response within a B. c. imperator and the insight it may hold regarding other South American reptilians. I hypothesized the Boa constrictor imperator would spend less time within his warmer humid hide, sprawled out more as well as increasing both the frequency and duration of his time spent drinking water Results show that the heat stress response in the B. c. imperator was expressed by spending less time within a hide and in increase in drinking duration while drinking frequency remained consistent throughout both the control and experimental phase. As the two-degree climate scenario seems inevitable, as scientists it is our job to understand and try to predict how this may affect
us and our planet. As reptiles play a major role in our ecosystems as both predators and prey to a large variety of species the preservation of them is vital if we hope to have thriving ecosystems surrounding us.
Methods
In this study I used one subject, a B. c. imperator as a benchmark for South Central American reptile reactions to a 2°C warming scenario. The study ran for a total of one hundred and four days with the first sixty nine days spent calibrating the setup then collecting control data. After this initial period, reptile heat lamps were used to increase the temperature of the terrarium by 2°C. Evidence of heat stress response was collected by using both observational data regarding the B. c. imperator’s location within the enclosure and an Arduino infrared sensor collected both the frequency of drinking and the duration of each visit to the water bowl. The B. c. imperator’s range extends from northern Colombia to southern Mexico, which is contained


within the IPCC climate modeling region labeled as South Central America (SCA). We used the IPCC WGI Interactive Atlas: Regional Information (Advanced)3 to gather data on the 2-degree warming scenario. We created a spreadsheet of the precise temperature increases for thirty eight geographic points within the SCA region, identified by their latitude and longitude (Fig 1). After averaging and finding the mean temperature I began to collect qualitative control data, observing the B. c. imperator’s behavior, location in the enclosure and body position. Logging time, location, and behavior for 69 control days and 35 days of the simulated warming scenario (fig 2). After working with Harvest Robbins who helped majorly in programming the arduino and its IR sensor to detect when the B. c. imperator has put its head into its water dish to drink, quantitative data on the B. c. imperator’s drinking schedule was also able to be collected. In total I have 49 days of quantitative data, 14 days of which are control data and 35 are experimental data (fig 3). The B. c. imperator is a species I have much personal knowledge and experience with over the past three years of raising and caretaking the B. c. imperator (167.6 cm, 5.8 kg) that will be subject to testing, also known as Boro. My deep knowledge on this species, especially the specific test subject’s day-to-day behaviors is why I am collecting observational data, as this will allow for a qualitative understanding of how his behavior may be changing when the temperature increases. As a quantitative method I am using an Arduino IDE and two infrared (IR) input sensors placed around a crafted hole in Boro’s water dish to detect, and count every time Boro drinks water. Though a weight sensor, or game camera could be used to collect this same data, IR sensors seem to be the best as they have the most minimal space taken up in the enclosure which inturn means the likelihood of a test subject tampering with the electronics is minimal.his is necessary to be accounted for as live subjects’ behaviors can never fully be predicted thus the safest, most minimal equipment should be and was used.
Results


The B. c. imperator was found in its hide 22.9% of the time at the 7:00am data collection during the simulated warming scenario, compared 36.2% of the time during the control period.


(fig 2).At 19:00 the B. c. imperator was observed spending 39.1% of its time in the hide whilst once the temperature rose only 17.1% of nightly observation time was spent in the hide showing an even greater increase than at the 07:00 observation period of time spent outside the hide. This increase was 22% (fig 2). Quantitative data recorded the B. c. imperator breaking the IR sensor beams 6 times over the study (fig 3). Of these 6 times, 5 seem to be reliable data points ranging from 127 seconds to 846 seconds. The one unreliable point was only 23 seconds which was by significant amounts the shortest recorded time in both the control and experimental phases of this study which is why I believe his tail must have slinked into his water dish and broken the IR beam connection briefly. The quantitative data shows that while the average frequency between water trips stayed the same, once every seven days, the average drinking duration went up by 72.9 seconds
Discussion

As I initially hypothesized, the B. c. imperator's time spent outside of the hide did in fact increase in correlation with the temperature. I was also correct in assuming that the amount of water intaken by the B. c. imperator would correlate with temperature increase. Where my hypothesis went astray was in the idea that the frequency of trips to the water source would also be corollary to the temperature. The water frequency remained constant which I did not expect as in other studies determining how reptilians respond to a warming scenario, water
 Figure 2
Figure 3
Figure 2
Figure 3
requirements as a whole increased.5 Partial increase of the B. c imperator’s water interactions indicating heat stress paired with a highly adaptable ambush predation style and rare but very efficient swimming ability6 may mean a number of once primarily arboreal Boa’s would move closer and stay around a water source for longer periods of time. This would make intaking water much more difficult for other South American fauna as an apex predator spending an increased time at the water ultimately means all other species must spend a decreased time near water sources or risk death.
Gaia & Future Research
Lovelock and Margulis’s Gaia theory would suggest that all species on this planet inadvertently maintain homeostasis of the planet through their many interactions with one another. This means that if perturbation such as climate change is introduced over a short period though some species may not be as affected initially the changing needs of others will ultimately change how the whole chain of food and dominance structure of all fauna and flora must be to maintain overall homeostasis. This climatic shift is one that many organisms will perish facing which is why it should not be written off, but rather new questions on how we can make a changing environment more hospitable for the local flora and fauna should be raised. Future research could entail observing how a broader group of fauna and flora encapsulated in a much larger enclosure with far more advanced temperature regulating systems would react to varying potential future temperatures both on the macro level of which and how many elicit a heat stress response and what it may be. To the micro of how and if interactions with one another are impacted and differentiated by rising temperatures. Applying a Gaianian thought process to approach climate change and climate research will allow for a perspective and studies where all organisms are valued and their role in the overall ecosystem and environment can be better understood and appreciated.
References
1. Tyree, M. (2018, June). 2 degrees celsius: How much time left to that climate threshold? Ohio Valley Environmental Coalition https://ohvec org/2-degrees-celsius-how-much-time-left-to-that-climate-threshold/#:~:text=In%20any%20case%2C %20the%20clock%20estimates%20that%20in,to%20the%202%20degree%20C.%20over%20preindustrial%20thresh old
2. Water and heat stress. (n.d.). National Drought Mitigation Center. Retrieved May 9, 2023, from https://drought unl edu/ranchplan/DuringDrought/WaterandHeatStress aspx#:~:text=Access%20to%20cool%2C%2 0clean%20drinking,increase%20%20by%20%20about%202 5%20%20times
3. Gutiérrez, J.M., R.G. Jones, G.T. Narisma, L.M. Alves, M. Amjad, I.V. Gorodetskaya, M. Grose, N.A.B. Klutse, S. Krakovska, J Li, D Martínez-Castro, L O Mearns, S H Mernild, T Ngo-Duc, B van den Hurk, and J -H Yoon, 2021: Atlas. In Climate Change 2021: The Physical Science Basis. Contribution of Working Group I to the Sixth Assessment Report of the Intergovernmental Panel on Climate Change [Masson-Delmotte, V , P Zhai, A Pirani, S L Connors, C Péan, S. Berger, N. Caud, Y. Chen, L.Goldfarb, M.I. Gomis, M. Huang, K. Leitzell, E. Lonnoy, J.B.R. Matthews, T.K.Maycock, T. Waterfield, O. Yelekçi, R. Yu, and B. Zhou (eds.)]. Cambridge University Press. In Press. Interactive Atlas available from Available from http://interactive-atlas ipcc ch/
4. Water and heat stress. (n.d.). National Drought Mitigation Center. Retrieved May 9, 2023, https://drought unl edu/ranchplan/DuringDrought/WaterandHeatStress aspx#:~:text=Access%20to%20cool%2C%2 0clean%20drinking,increase%20%20by%20%20about%202.5%20%20times
5 Bickford, D , Howard, S D , Ng, D J J et al Impacts of climate change on the amphibians and reptiles of Southeast Asia Biodivers Conserv 19, 1043–1062 (2010) https://doi org/10 1007/s10531-010-9782-4
6. Boa constrictor [Fact sheet]. (n.d.). Smithsonian National Zoo & Conservation Biology Institute. Retrieved May 16, 2023, from https://nationalzoo si edu/animals/boa-constrictor
Teen Stress: A Study of Saint Ann’s Students
Theo C. Mentor: Liz B.Abstract
This study explores how Saint Ann’s students self-report stress in academic and social arenas. In the context of this study, stress is defined as the mental tension brought forth by an unfavorable situation or change in environment.1 This change can be sudden and acute, such as a jarring sound; chronic, such as an inconsistent social group; or change provoked by normal developmental changes, such as physical or emotional maturation. During adolescence, students are in the throes of development, which is culturally understood to be a time of great stress. I concentrated my study on this stress in sixth through twelfth graders, focusing specifically on students’ academic and social lives. As students advance through the grades, academic pressure increases in terms of workload, intellectual complexity, and expectations from adults, such as teachers and parents, leading me to hypothesize that academic stress would demonstrate a meaningful increase as the grade level rises. Based on anecdotal evidence, I predicted that a peak in socially-related stress levels would occur in grades eight and nine, considering that this age range is often accompanied by substantial changes in social life. I decided that an efficient way to gather information would be through a questionnaire, which I based on The Teen Compass’ Teen Wellness Self-Assesment.2 I created the questionnaire on Google Forms. After three months of distribution, I gathered 238 responses and analyzed the results. The data both supported and disputed my hypothesis: social stress did not peak in eighth and ninth grade; however, there was a notable difference in ninth and tenth grades. Contrary to what I hypothesized, the variations in academic stress proved to be statistically insignificant among the grades. Historically, adolescence is a time associated with considerable stress. It’s my pleasure to report, however, that a majority of students responded positively on measures of wellness, demonstrating that they’re able to persevere through the stress and remain optimistic.
Introduction
Adolescent mental health has been a subject of concern and debate. Many point out the constant pressure in adolescent life, such as the challenge of a sixth grader’s first essay or a Senior’s college application process. While the sixth grader’s challenge may pale in comparison to that of the Senior’s, they can both contribute to intense mental tension. However, many also associate this time of adolescence with terrific enjoyment, great experiences, and unforgettable
memories. This dissonance is what inspired me to begin this study - are adolescents actually stressed out all the time or are they living the most carefree and exciting lives? And if they are stressed, what is causing it?
Many different definitions of stress are thrown around in today’s society. In this study, the definition I will be applying is the mental tension/feelings of discomfort provoked by an unfavorable or changing situation.1 This stress can emerge due to numerous reasons: chronic, acute, or developmental situations. Chronic stress is any persistent circumstance that creates pressure in regular life. This could be a difficult home life, an inconsistent social group, or ongoing difficulties in a class. Chronic stress can be very harmful not only due to the consistent pressure in everyday life, but even if the cause of the pressure disappears the effects may remain as it was such a monumental part of life to date. Acute stress is any sudden and unsettling moment, such as a car honk, stubbing your toe, etc. Developmental stress is the tension caused by natural changes during maturation. These changes can be physical or emotional, from bodily changes due to puberty to personality changes. These factors are among the main reasons for stress in adolescents today.
I chose to examine the reality of the adolescent experience through two crucial aspects: social life and academic life. Both of these areas can contribute to tremendous pleasure or anxiety. Hanging out with friends can be enjoyable, but it can become distressing when that friend group begins to fight and change. Additionally, a high score on your last test can be a huge confidence booster but worry may set in again when you realize you have two essays due in the next week.
I created two individual hypotheses for each of the two different study groups. Regarding academics, I predicted that stress levels would increase over time. Class workload, expectations from adults such as teachers and parents, and students beginning extra-curricular activities all increase, creating more academic pressure and worry. Concerning stress caused by social life, I predicted that a peak would occur in grades eight and nine. Based on personal experience and anecdotal evidence, this age is one accompanied by insecurity and change in social groups, which can provoke stress. Looking beyond whether adolescents are experiencing heightened stress levels or not, I wished to examine what is causing them stress. I first did this by reading previous studies on the topic. Since 2007, the American Psychological Association has commissioned an annual nationwide survey called the Stress in America survey. In their 2014 study, called “Are Teens Adopting Adults’ Stress Habits?”, the researchers examined many fields of stress, including its greatest source in teenagers. The results for teens who reported stress are shown below:
The APA’s findings directly relate to my study. While the APA does not specify whether “school” is related to academic work or social life in school, a whopping 83% of all adolescents who report stress say that “school” is a reason; additionally, 69% say getting into college or post-high school life is a major factor of their stress. In the same study, the APA discovered that students’ stress levels are considerably higher in the school year than in the summer - 5.8 on a ten-point scale during the school year compared to 4.6 during the summer 3

Methods & Materials
To begin constructing my questionnaire, I looked to previously conducted wellness surveys for inspiration. Shortly after, I began writing the questions in close cooperation with my mentor, Liz Bernbach, a school psychologist, to ensure the questions were suitable for the student population. We decided that the questions must be written with a positive tone, so as not to instigate negative emotions. For instance, if each question were worded with a negative tone, reading through the questionnaire could provoke harmful feelings, which we intended to avoid.
Deciding that it would be best for the questionnaire to remain brief, I conceived thirteen total questions, which were displayed in the order as follows:
Figure 1. APA study results.31. What grade are you in?
2. I am always on time for school
3. I am personally happy with my performance in school
4. I feel attentive during class
5. I feel organized and able to complete my homework assignments
6. I am happy with my friendships and family relationships
7. I am satisfied with the amount of time I spend with the important people in my life
8. I feel like I am able to find support when I need it
9. I am able to identify an unhealthy relationship
10. I have a solid and positive sense of confidence in myself
11. I get a sufficient amount of exercise on a regular basis
12. I usually get 8 or more hours of sleep
13. If you would like one of the psychologists to get in touch with you please leave your email here.
The responses were recorded on a Likert scale in which there were 5 responding options (Note that the students were able only to select one of the five options):
● Never
● Not often
● Half the time
● Most of the time
● Always
Question one was gathering information on the respondent’s grade, two through five were concerning academic stress, six through ten were regarding social stress, and eleven and twelve were additional questions to examine the possibility of a correlation between sleep/exercise and stress levels. The thirteenth question, the lone question that was not a multiple choice but a free-response question, was an option for the student to leave their email. If they chose to do so, one of the school psychologists would contact them. I had no
involvement with this question, did not read the responses, and will not analyze them in this study
I created the questionnaire on Google Forms. Considering that many St. Ann’s students do not regularly check their email, I reasoned that placing the questionnaire directly in front of the students would be an effective way to gather responses. I achieved this with the assistance of the health teachers, who agreed to distribute my questionnaire during health class. Seniors, who don’t have health class, had the questionnaire emailed to them, which was done with the help of the High School Office.
Results
After accumulating 238 total responses, with the help of Jared Cross I organized the data into Google Sheets. To analyze the results, we created a “Wellness Score,” which was made by assigning each response a different numerical value:
● Never = 1
● Not often = 2
● Half the time = 3
● Most of the time = 4
● Always = 5
This quantification was instrumental in finding the mean response score of a group. For instance, if half of the responders in Middle School answered “Most of the time” to all the questions and the other half answered “Always,” the Middle School’s mean Wellness Score would be 4.5. Similarly, to determine the average academic or social scores, we would only consider the mean responses to the questions related to that particular subject (for the academic score, questions two through five, for the social, questions six through ten). It is important to keep in mind that a higher Wellness Score = less stress. The following data is the information we decided to be most relevant and significant for the study. The academic and social wellness results were analyzed in grade groupings of sixth through eighth grade, ninth through tenth grades, and eleventh through twelfth grades.
i. Note that the 8th grade’s percentage which is not shown is 7.6%.


The data is based on students' responses to questions two through five and then assembled into the three different grade groupings.
The data is based on students' responses to questions six through nine and then assembled into the three different grade groupings.
Figure 2. Grade breakdown of responses from sixth through twelfth grades. Figure 3. Academic wellness results. Figure 4. Social wellness results.Figure 5. What we’re doing well - academic wellness. Below is the question that had the highest number of positive responses (“Most of the time” or “Always”) from the academic section.

Figure 6. What we’re doing well - social wellness. Below is the question that had the highest number of positive responses (“Most of the time” or “Always”) from the social section.

Figure 7. What we need to work on - academic wellness.Below is the question that had the greatest number of negative responses (“Not often” or “Never”) from the academic section.


. Figure 8 - What we need to work on - social wellness
Below is the question that had the greatest number of negative responses (“Not often” or “Never”) from the social section.
ii. The graph above displays the correlation between respondents’ answers to question eleven about exercise (shown on the x-axis) to their Wellness Score.

The graph above displays the correlation between respondents’ answers to question twelve about sleep (shown on the x-axis) to their Wellness Score.
 Figure 9. Correlations between stress levels and exercise.
Figure 10. Correlations between stress levels and sleep
Figure 9. Correlations between stress levels and exercise.
Figure 10. Correlations between stress levels and sleep
The academic results (see Fig. 3) followed the pattern I predicted from my hypothesis, but the change in the Wellness Score was not statistically significant. This result was the greatest surprise out of the data analysis for me; I was expecting a substantial dropoff in the Wellness Score for the eleventh and twelfth graders. Additionally, while the Middle School’s mean Wellness Score was high, I anticipated it to be even higher. The workload for Middle School students is smaller than that of high school students, so I expected low-stress levels academically for the middle school. During the presentation of my results at the Independent Science Research Symposium on May 10th, multiple viewers came up with an explanation for this surprise, which I did not think of. They hypothesized that the not-significantly high Middle School Wellness Score was due to middle school students feeling that their workload is worse than it has ever been; Middle school students don’t know that it is comparatively smaller than older students. This explanation provides a hypothesis for further research.
My original hypothesis was that social stress levels would peak in grades eight and nine, but ultimately I did not investigate the stress levels in 8th and 9th combined. Instead, I created grade groups for sixth through eighth, ninth through tenth, and eleventh through twelfth. The reason for this was I felt it was more appropriate to investigate stress levels in sixth through eighth grade vs. ninth through tenth vs. eleventh through twelfth, so investigating in terms of eighth and ninth grades did not make sense. However, the highest social stress levels were in grades nine and ten (see Fig. 4), and similar to the academic stress results, the Middle School displayed the greatest positivity. Unlike the academic results, the difference between Middle School and Underclassmen stress levels is statistically significant.
I created the section “What we’re doing well” to examine what aspects of academic and social life the student body has the most positive attitude towards. The factors investigated here are the questions I asked in the questionnaire. For academics, the student body answered with the most positive responses (“Most of the time” or “Always”) to question three, “I am personally happy with my performance in school,” with 78% (184 respondents) answering positively (see Fig. 5). While the other academic questions were more specific, question three was the broadest and about academic performance as a whole, so question three having the greatest positive response was very reassuring. For the social side, 69.2% (164 respondents) answered positively to question six, “I am happy with my friendships and family relationships” (see Fig. 6). The social questions were each fairly specific, so which was the most important would depend on opinion. Of course, it is still very gratifying that almost 70% of students say they are usually happy with their relationships.
The opposite of the previous section, “What we need to work on” was created to examine what factors from academic and social life are contributing to stress. The academic question with the largest number of negative responses (“Not often” or “Never”) was question
five, “I feel organized and able to complete my homework assignments.” 26 respondents answered negatively, making up 11.8% of the 238 (see Fig. 7). Concerning social stress, question 10, “I have a solid and positive sense of confidence in myself,” had the largest negative response after 24% (57 respondents) answered negatively (see Fig, 8). This result is extremely distressing: almost a quarter of 238 students say they don’t often or never feel confident.
When I originally added questions eleven and twelve (“I get a sufficient amount of exercise on a regular basis” and “I usually get 8 or more hours of sleep”) the goal was to investigate if there was a correlation between sleep/exercise and stress levels. These questions have revealed meaningful information. For the respondents who answered “Always” to question eleven, they had a mean Wellness Score of 3.96, compared to the mean score of 3.13 for those who answered “Never” (see Fig. 9). These results were reflected and intensified for the results on sleep. The students who answered that they always get eight or more hours of sleep had a mean Wellness Score of 4.03, while the respondents who said they never get eight or more hours of sleep had an average Wellness Score of 3.13. It is important to understand that these results are both correlations and can’t be interpreted causally. For instance, it couldn’t be claimed that more stress ⇒ less sleep, or more exercise ⇒ less stress. However, there is a significant correlation between exercise/sleep and stress: More exercise/sleep is correlated with less stress, and vice versa.
Conclusion
“Adolescent Mental Health Continues to Worsen,”4 “Kids’ mental health is in crisis… ”5 These are just some of the many grim headlines seen across the media today. In the CDC’s 2021 study titled “Youth Risk Behavior Survey,” they found that “more than 4 in 10 (42%) students feel persistently sad or hopeless.”4 However, the results from my study paint a different picture from these headlines. Saint Ann’s students are reporting optimism across all aspects of academic and social life, with a mean Wellness Score of 3.745 out of 5.
But why do Saint Ann’s students self-report more positively in this study than in nationwide studies? While there are many potential explanations, there are a few main ones that I would propose. For one, Saint Ann’s doesn’t use grades. The absence of grades produces a much less academically competitive environment. Secondly, Saint Ann’s is a small private school. The small student body creates a tighter-knit community, allowing for more trust and support between students. Finally, many students come from a higher socioeconomic background compared to the general population. Students may have more access to mental health support, in addition to academic resources. The increased positivity can be attributed to any, if not all, of these factors.
References
1 "Stress," World Health Organization, last modified February 21, 2023, accessed April 23, 2023, https://www who int/news-room/questions-and-answers/item/stress#:~:text=Stress%20can%20be%20defined%2 0as,experiences%20stress%20to%20some%20degree.
2 "Teen Wellness Self-Assessment," The Teen Compass, [Page #]
3 Stress in America: Are Teens Adopting Adults' Stress Habits? (American Psychological Association, 2014), [Page #], https://www.apa.org/news/press/releases/stress/2013/stress-report.pdf.
4. Bruce G. Charlton, "Stress," in Journal of Medical Ethics, [Page #], excerpt from Journal of Medical Ethics 18, no. No 3 (1992): 156-59, https://www jstor org/stable/27717198?searchText=definition+of+stress&searchUri=%2Faction%2FdoBasicSearch %3FQuery%3Ddefinition%2Bof%2Bstress&ab segments=0%2Fbasic search gsv2%2Fcontrol&refreqid=fastly-defa ult%3A7a78c30ddaa1e1f3f7c44254aec0f180&seq=1 Zara Abrams, "Kids' mental health is in crisis Here's what psychologists are doing to help," American Psychological Association, last modified January 1, 2023, accessed May 17, 2023, https://www apa org/monitor/2023/01/trends-improving-youth-mental-health
Alcohol and Strokes: Genetics and Societal Implications
Celeste A and Jia M.Mentor: Kamau B.
Abstract
Alcohol use disorder and strokes’ correlation has resulted in various in-depth researches and analyses of their impacts on humans and the relationship between associated genes and their cultural/societal foundations. We will explain why the way the body metabolizes various chemicals and ingredients in alcoholic beverages is tied to increased stroke risk, and other cardiovascular diseases. Societal, governmental, and religious foundations can cause a wet or dry culture of alcohol consumption. The habit of heavy alcohol reliance can also be caused by the epigenetics of alcohol use disorder (AUD); epigenetics are reversible adjustments to how a gene is expressed, without the DNA (deoxyribonucleic acid) sequence itself being changed. In discussing our findings, we take into account the intersection between society and science. Our research discusses the cultural differences in alcohol consumption around the world, and summarizes what alcohol use disorder and strokes are and how they are connected. During the process we talked with Dr. Iona Millwood, a professor at Oxford who published thorough research on alcohol use with an emphasis on China. Our findings have found the devastating, data-backed effects of alcohol use on the body and how the risk of developing and having relapses of AUD or stroke can be dependent on possessing specific genes.
Introduction
Background Information for Alcohol Use Disorder
Alcohol Use Disorder (AUD) or Alcoholism is a neurological condition of the frontal lobe in the brain that disables you from being able to control alcohol intake. 1 in 8 Americans are alcoholics and according to the Center of Disease Control (CDC), 140,000 Americans a year die from alcohol related causes1 . Research shows that alcohol can affect your physical and mental health in numerous ways: one is Fetal Alcohol Spectrum Disorders (FASDs), a group of conditions that occur before birth to those who were exposed to alcohol while in utero; these conditions can entail physical, behavioral or learning problems. The alcohol is usually passed in the mother’s bloodstream to their baby through the umbilical cord. Those who have FASD(s) are at risk of symptoms ranging from poor memory to problems with their heart, kidney and bones.2
Hypertension (high blood pressure) is another complication of AUD, a condition in which the force against artery walls from blood is too high- hypertension is often determined by a blood pressure higher than 140/90 and is seen as severe when above 180/120. Alcohol has a greater effect on systolic blood pressure (first number, pressure in arteries as heart beats) than diastolic
pressure (second number, pressure in arteries between heart beats) which influences an imbalance between the Central Nervous System and factors such as “cardiac output and the peripheral vascular effects of alcohol”. There has been an observed elevation of blood pressure when patients experience alcohol withdrawal as well, scientists believe it could be because of “excessive central-nervous system excitability during the withdrawal period”3 Alcohol consumption can also increase the risk of cancer, through its possible conversion of acetaldehyde which damages the DNA inside the cell and/or cause oxidative stress in cells which makes them create more chemically reactive molecules that contain oxygen, once again, damaging the cell and increasing the risk of cancer Alcohol can also raise estrogen levels, which may affect the growth and development of breast tissue, possibly leading to breast cancer4 . Researchers have also reported an increase in the risk of pancreatitis: Pancreatic Acinar Cells are damaged from byproducts of alcohol consumption, activating pancreatic enzymes which are usually disabled and causing the pancreas to eat itself This therefore promotes inflammation and damage to the pancreas5 . Finally, those who consume alcohol in the long-term are at a greater risk for type 2 diabetes (“adult onset diabetes”) complications because of the found rise in blood sugar6 .
Society and AUD
AUD has been born out of clear societal influences. In 2021, 3.2 million youths between ages 12 to 21 reported binge drinking in a month. Historically in teens, girls have been less likely to binge drink or consume alcohol; however, in recent years, girls are more likely to7 . In 2019, countries such as Czechia, Latvia and Moldova reported to have the highest rate of alcohol consumption while countries such as Somalia, Kuwait, Bangladesh and Somalia have the lowest (around 0.00 of liters of alcohol consumed per capita), this data reflects the way that various societies think of alcohol. It has been found that most low-alcohol consuming countries have predominant religions that see alcohol consumption in a negative light8 . Countries or regions with wet cultures (alcohol being very accessible) have a higher average drinking rate, while dry cultures have increasingly less. This is even found in smaller datasets: in 2015, researchers found that counties can have varying levels of usage solely based on accessibility to liquor stores and advertising.9 Trauma also has a strong influence upon the rate of alcohol usage; PTSD, mental illness or disasters can encourage alcoholism. Interestingly, during the COVID-19 pandemic, those who were more alone in their living space had less reported drinkingresearchers say that this is due to the lack of engagement in social drinking10
Genes and Alcohol Use Disorder
Genes involved in alcohol abuse are in 51 chromosomal areas in the body.11 Variations in key parts of DNA such as “encoding alcohol dehydrogenase 1B, aldehyde dehydrogenase 2, and other alcohol-metabolizing enzymes” affect the risk of alcoholism and the risk of alcohol related
cancer. Research has found that the GABRA2 gene that encodes the neurotransmitter γ-aminobutyric acid has a role in alcohol dependence.12 Although these genetic differences do affect risk, it must be emphasized that a “gene for alcoholism” does not exist, and it is a result of hundreds of genes, social, geographical, and environmental factors. That being said, these new gene studies will allow for new treatment ideas and new understandings of the correlation between hereditary traits, genes and alcoholism.13
Background Information on Strokes
Strokes (cerebrovascular accidents) are the interruption of oxygenated blood supply to the brain. Ischemic strokes are caused by a plaque or blood clot-blocked artery leading to the brain and are the most common type of stroke. They relate more to blood circulation than pressure build-up in blood vessels, which can cause hemorrhage, the release of blood from a broken blood vessel. Hemorrhagic strokes are when an artery leading to the brain ruptures- i.e. aneurysm (abnormal swelling in a blood vessel’s walls) that bursts causing internal brain bleeding which puts physical pressure on brain cells. Stroke development can be thrombotic or embolic. Thrombotic strokes develop within the brain itself (thrombus) when plaque like fibrin, cellular waste products, fatty substances, cholesterol, and/or calcium build up or blood clotting develops. Embolic strokes develop within the body (embolus) in general, in an artery leading to the brain and are caused by the same, or similar, things as thrombotic strokes. Strokes damage or kill off brain cells on only one side of the brain and each side of the brain controls the opposite side of the body. Strokes affect balance, coordination; motor, sensory, and cognitive abilities. They are polygenic diseases, their likelihood of occurrence is influenced by multiple different genes. The acronym “B.E. F.A.S.T.” is used to recognize a stroke. It stands for balance, eyes, face dropping, arm weakness, speech difficulty, and time. Time is of the essence during stroke occurrence because the deprivation of oxygen to the brain only takes a few minutes to cause much more damage and brain cell mortality. Morbidity (medical conditions or disease) and mortality (death) risks increase as more time is passed during a stroke.
The contingency of strokes relate to aging, family history, genetics, epigenetics (how behavior and external environment affect how genes work, these are reversible because they change how a DNA sequence is read instead of the sequence itself), also activity levels, diet, lifestyle, smoking, alcohol consumption, and various disorders most of which are hereditary. These disorders include Factor V Leiden, a mutation of blood’s V leiden protein which aids blood to clot appropriately– an inherited blood clotting disorder; others include hypertension (high blood pressure), lipid disorder (high cholesterol), atrial fibrillation (irregular heart rhythm, relates to blood clotting in heart), and diabetes (the inability to produce insulin which allows the glucose sugar levels in the blood to grow excessively. Strokes are more common the older a person is, as arteries become narrower and more rigid. High dietary table salt (NaCl) intake also stiffens
artery walls of the heart and neck especially, and relates to high blood pressure. Clogged arteries are also consequently related to low activity levels because physical activity decreases the buildup speed of plaque, fat, and cholesterol. Smoking correlates with strokes because it heightens blood pressure, artery plaque buildup, and reduces oxygen in the blood which makes the heart have to work harder and faster to distribute blood. But the genetic and societal related factor or causation of stroke we will focus on is alcohol use disorder.
Similarly to alcohol use disorder, strokes affect the cerebellum (movement and coordination), the brain stem (body automatic functions, conduction), the cerebrum (conscious thoughts and actions), and the limbic system (memory storage, emotions, and stimulation).
Research Society and Strokes
Socioeconomic status, insurance coverage, race/ethnicity, sex, gender, and geographic location have ties to the likelihood of stroke incidence, reporting speed, aftercare, and mortality rate. This is because of discrimination, weathering, and lacking research. Weathering refers to the effects of discrimination on the basis of public health, particularly when towards people of color.
Black and hispanic patients in particular were found to experience patient-specific barriers (ex. medical system denial of the legitimacy of their symptoms, especially in absence of “coherent” family history), medication-specific barriers (ex. side effects and difficulty with obtaining prescription or over-the-counter medication), disease-specific barriers (ex. assumed lack of need for treatment based on absent or non-typical symptoms), and logistical barriers (ex. the burden of acquiring a clinical visit or getting a prescription filled).14
Some of these barriers or types of discrimination/dilemmas intersect with “Individuals without health insurance [who] tend to be more likely to forgo routine physical examinations; to be unaware of a personal diagnosis of hypertension, diabetes mellitus, or hyperlipidemia; and to have higher levels of neurological impairment, a longer average length of hospital stay, higher rates of stroke, and a higher risk of death.168,169.”14 Being discouraged or disallowed from receiving sufficient medical care like routine exams and testing greatly increases risk of stroke. So does missing research on patients of one’s identity. Lack of research is found to impact sex because men tend to have traditional stroke symptoms, whereas women tend to also experience irregular stroke symptoms like severe headache, confusion, etcetera. Because of this, many medical journals, associations, or hospitals still believe that men are more likely to have a stroke which is not entirely accurate.15 There are also clear gaps in this research for
people who do not identify with their sex assigned at birth, who have received hormone replacement therapy, or who are intersex, etcetera. An example of this is a research about strokes and DALYs (disability-adjusted life years) found that "In 2020, ischaemic heart disease was responsible for 31·5% (95% UI 30·3–32·7) of all alcohol-related DALYs among males and 29·7% (28·2–31·2) among females, intracerebral hemorrhage was responsible for 11·6% (10·9–12·4) of all alcohol-related DALYs among males and 10·9% (10·1–11·8) among females, and ischaemic stroke was responsible for 14·2% (13·5–14·9) of all alcohol-related DALYs among males and 16·0% (15·2–16·7) among females."16
Genes and Strokes
Being polygenic diseases, strokes are “influenced by multiform mechanisms of the interaction of genetic and non-genetic factors”.17 The term polygenic means that it is guided and regulated through multiple genes and genetic factors. Genes are units of heredity passed from parent to offspring, they are sequences of nucleotides forming part of a chromosome. Genetic markers are genes or sequences of DNA (deoxyribonucleic acid) used to identify a chromosome. Certain genes are more tied to a specific type of stroke; for example: “The polymorphism in the intron 16 of the angiotensin-converting enzyme (ACE) gene is an independent risk factor for spontaneous intracerebral hemorrhagic stroke.”17 Whereas, “the loci [plural of locus, location within a genome] associated to atherothrombosis [blood coagulation in diseased artery provoked by exposed endothelial surface because of built-up plaque in thrombus] and ischemic stroke.”17 In general, “Mutations in three loci of HTRA1 [high temperature requirement A serine peptidase 1, cell signaling and protein degradation], COL4A1 [collagen type IV alpha 1, protein that instructs the making of one part of the type IV collagen] and COL4A2 [collagen type IV alpha 2- protein that encodes alpha-1 chain of type IV collagen] genes influence Medelian inheritance for stroke phenotypes.”17 In terms of genetic markers, “rs11833579 and rs12425791 on the 1p13 chromosome near or inside the NINJ2 gene are hereditary causes of family aggregation of stroke in the linkage analysis.”17 Overall, the most influential genes we have researched are ones that increase abnormal clotting and venous thromboembolism, which is a condition in which a blood clot forms in a vein.
Alcohol and Strokes
We talked with Dr. Iona Millwood, an Oxford Professor and researcher who in 2019, published her team’s findings on the causation of alcohol use disorder and vascular disease. In our interview with her, she explained how she first decided to conduct this research which is that much of the research conducted in the last decades has stated that alcohol is beneficial for one’s health; however, this research did not specify whether this was causal or reverse causation (ex. when it is thought that x causes y, but y causes x instead)18 Dr. Millwood concluded that the reason why these errors may have occurred is because those who drink a
small amount of alcohol may have a healthier lifestyle than those who do not drink at all– they may not be smoking, or they may even have higher socioeconomic circumstances. Those who do not drink also may do so because of other underlying health conditions that are separately increasing the risk of strokes. Dr. Millwood’s study was on the, “Conventional and genetic evidence on alcohol and vascular disease etiology [the cause or origin of disease]: a prospective study of 500,000 men and women in China” which focuses on East Asians because of the existence of certain genetic variants that make them more sensitive to apparent side effects, most commonly the “Alcohol Flushing Response”. The “Alcohol Flushing Response” is due to an inherited deficiency of the aldehyde dehydrogenase 2 (ALDH2) enzyme, an enzyme along a major alcohol metabolism pathway. This result and the research which showed that strokes are also a leading cause of death for Chinese populations compelled Dr. Millwood’s team to do a study on the difference between those who have a vulnerability to Alcohol Flushing Response’s side effects and drink less compared to those who do not and drink more. Beginning in 2008, Dr. Millwood’s study partnered with the China Kadoorie BioBank who collected blood samples and information on things like lifestyle status and smoking habits from half a million Chinese citizens. They later followed up with participants through anonymous electronic linkage to see whether alcohol intakers had a stroke or heart attack. Through this data they were able to conduct genetic studies, which allowed them to find that these genetic variations highly influence alcohol consumption- in men. Men who had the “Alcohol Flushing Response” were much less likely to be at risk for stroke than men who did because they were less likely to consume as much alcohol. Women who had the same genetic variants did not have a similar stroke risk, Dr. Millwood thinks this is because women in China do not drink as much because of social influences.
Misinformation, Alcohol Use Disorder and Strokes
Although Alcohol is a carcinogen, less than half of Americans are aware of this This is a result of many alcohol companies funding research that is flattering to drinking. Some of these myths include the idea that Alcohol is good for one’s heart, which it is not. In 2020, researchers Erin Hoben and Timothy Stockwell tried to put in place an experiment that placed cancer warnings on 47,000 bottles of booze funded by the Canadian government but it was not implemented as a result of disgruntled alcohol companies. Many alcohol companies often “pinkwash” their products as well, a campaign in which they place pink ribbons in their marketing to exhibit their support for breast cancer awareness - although alcohol has been found to encourage breast cancer as mentioned earlier.19
Why should high school students care?
According to the 2022 Saint Ann’s Ram student Senior survey, 42% of High School Seniors drink a few times a week, and 40.6% drink a few times a month.20 This alcohol consumption can be an indication for future risks of stroke and cardio-vascular diseases.
References
1. Deaths from Excessive Alcohol Use in the United States | CDC. (n.d.). Centers for Disease Control and Prevention. Retrieved May 7, 2023, from https://www cdc gov/alcohol/features/excessive-alcohol-deaths html
2 Basics about FASDs | CDC (2022, November 4) Centers for Disease Control and Prevention Retrieved May 7, 2023, from https://www.cdc.gov/ncbddd/fasd/facts.html
3 Husain, K , Ansari, R A , & Ferder, L (2014, May 26) Alcohol-induced hypertension: Mechanism and prevention National Library of Medicine https://www ncbi nlm nih gov/pmc/articles/PMC4038773/
4 Alcohol Use and Cancer (2020, June 9) American Cancer Society Retrieved May 7, 2023, from https://www.cancer.org/cancer/risk-prevention/diet-physical-activity/alcohol-use-and-cancer.htm
5 Miller, L (2023, April 19) Pancreatitis & Alcohol: Alcohol's Effect on the Pancreas American Addiction Centers Retrieved May 7, 2023, from https://americanaddictioncenters.org/alcoholism-treatment/effects-of-alcohol-on-the-pancreas
6. Emanuele, N. V., Swade, T. F., & Emanuele, M. A. (1998). Consequences of Alcohol Use in Diabetics. Alcohol Health Res World https://www ncbi nlm nih gov/pmc/articles/PMC6761899/
7 Underage Drinking (n d ) National Institute on Alcohol Abuse and Alcoholism (NIAAA) Retrieved May 7, 2023, from https://www.niaaa.nih.gov/publications/brochures-and-fact-sheets/underage-drinking
8 Alcohol Consumption by Country 2023 (n d ) World Population Review Retrieved May 7, 2023, from https://worldpopulationreview com/country-rankings/alcohol-consumption-by-country
9. Royals, K. (2015, May 25). Wet or dry? Drinking rates coincide with accessibility. The Clarion-Ledger.
https://www.clarionledger.com/story/news/2015/05/25/wet-dry-drinking-rates-coincide-accessibility/279 44869/
10 Elise Bragard, Salvatore Giorgi, Paul Juneau, Brenda L Curtis, Loneliness and Daily Alcohol Consumption
During the COVID-19 Pandemic, Alcohol and Alcoholism, Volume 57, Issue 2, March 2022, Pages 198–202, https://doi.org/10.1093/alcalc/agab056
11 “Alcoholism Causes and Risk Factors ” Alcohol Rehab Guide, www alcoholrehabguide org/alcohol/causes/
Accessed 17 May 2023
12. Agrawal, A., & Bierut, L. J. (2012). Identifying Genetic Variation for Alcohol Dependence. Alcohol Research Current Reviews
https://www ncbi nlm nih gov/pmc/articles/PMC3662475/#:~:text=The%20gene%20variant%20
13. Edenberg, H. J., & Foroud, T. (2013, May 8). Genetics and alcoholism. Nature.
https://www.nature.com/articles/nrgastro.2013.86
14 Cruz-Flores, MD, MPH, FAHA et al ,(2011) Racial-Ethnic Disparities in Stroke Care: The American Experience. AHA/ASA Scientific Statement.
https://www ahajournals org/doi/pdf/10 1161/str 0b013e3182213e24
15. Hosman et al., (2022). Call to Action for Enhanced Equity: Racial/Ethnic Diversity and Sex Differences in Stroke Symptoms Frontiers in Cardiovascular Medicine
https://www ncbi nlm nih gov/pmc/articles/PMC9110690/
16. Millwood et al. (2019). Conventional and genetic evidence on alcohol and vascular disease aetiology: a prospective study of 500,000 men and women in China, The Lancet
https://www.thelancet.com/journals/lancet/article/PIIS0140-6736(18)31772-0/fulltext
17 Pourasgari, Masoumeh, and Ashraf Mohamadkhani 2020 “Heritability for stroke: Essential for taking family history” National Library of Medicine, (May) ncbi nlm nih gov/pmc/articles/PMC7442467/
18. Indeed Editorial Team., (2022). What Is Reverse Causality?: Definitions and Examples, Indeed
https://www indeed com/career-advice/career-development/reverse-causality
19. Moore, T. (2020). Less than half of Americans know that alcohol is a carcinogen. Big Booze wants to keep it that way The Counter
https://thecounter org/public-health-groups-alcohol-label-warnings-carcinogen-cancer-link-awareness-pro p-65/
20 Saint Ann’s Ram Senior Survey

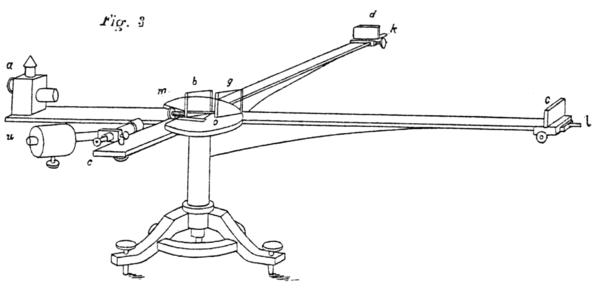 [Figure 1]
[Figure 2]
[Figure 1]
[Figure 2]


 Figures 4 and 5 display the experimental setup:
[Figure 4]
[Figure 5]
Figures 4 and 5 display the experimental setup:
[Figure 4]
[Figure 5]

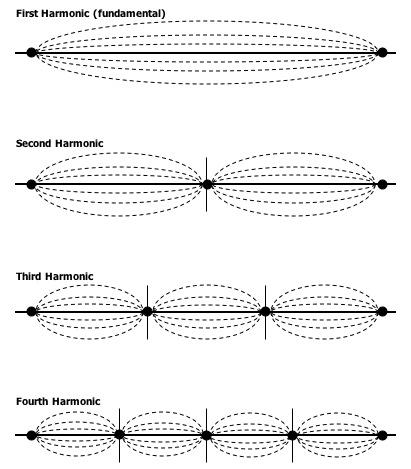


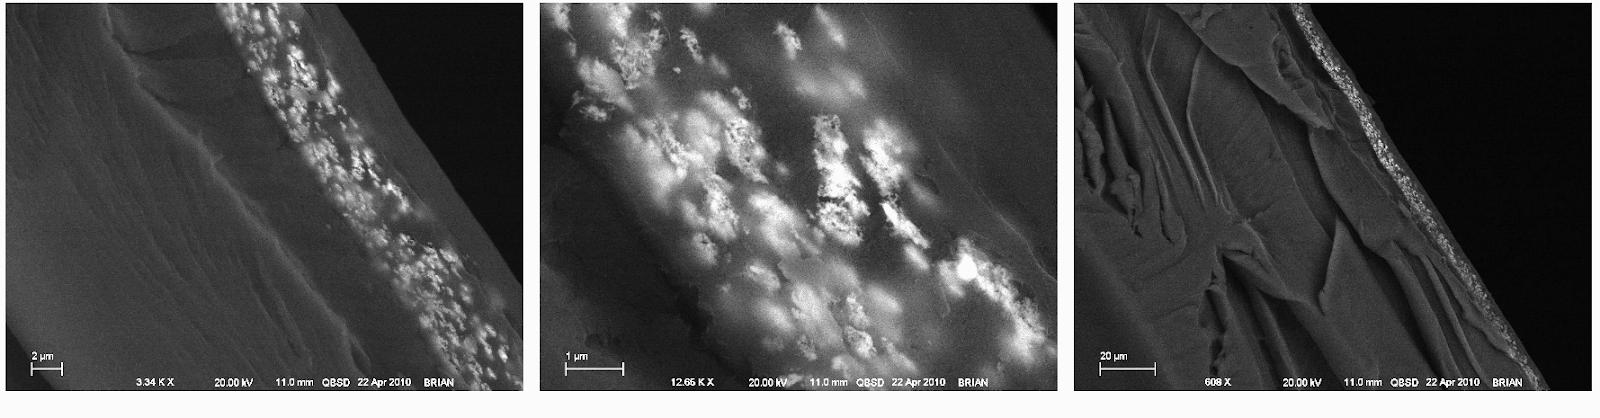


 Below are my negatives from my second is decaffeinated.