8 minute read
Risk Prioritization


Risk Prioritization
In Dr. Lori Moore-Merrell’s recent article 3 Elements of an Effective Fire Department Community Risk Assessment, she provided the following explanation for the three main elements that should provide the foundation for all community risk assessments:13
Advertisement
Community Risk Assessment Element Figure 43. Community Risk Assessment Elements
Description
1. Probability (likelihood) of an incident occurring. Probability is associated with the frequency of an incident type. Incidents with high probability will occur more frequently. Once these predictions are made, risks can then be ranked as having a low, moderate, or high probability of occurring.
2. Consequence (magnitude) of an incident on the community.
3. Impact of an incident on the department’s response system. Consequence is the measure of the outcome of an incident type occurrence. To assess consequence, fire department leaders must first identify, categorize, and prioritize community hazards. Hazards are the causes of danger and peril in the community. Risk quantifies the degree of potential danger the hazard presents. The consequences of an emergency incident result from a combination of the risk level of the hazard, the duration and nature of the event, and the response interventions. Consequences are divided into four categories: 1. Civilian and firefighter injury or loss of life 2. Property damage or loss 3. Critical infrastructure damage or loss 4. Environmental damage or loss Impact is a measure that explains the effects of multiple concurrent incidents on the fire department. Impact describes a fire department’s ability to provide ongoing services to the remaining areas of a community considering frequent activity in known high-volume demand areas.
13 https://www.lexipol.com/resources/blog/3-elements-of-an-effective-fire-department-community-risk-assessment/.
Establishing Community Risk Priorities
After the risks within a community have been identified and prioritized, the community is well-positioned to develop an effective set of Community Risk Reduction strategies and tactics to mitigate the risks.
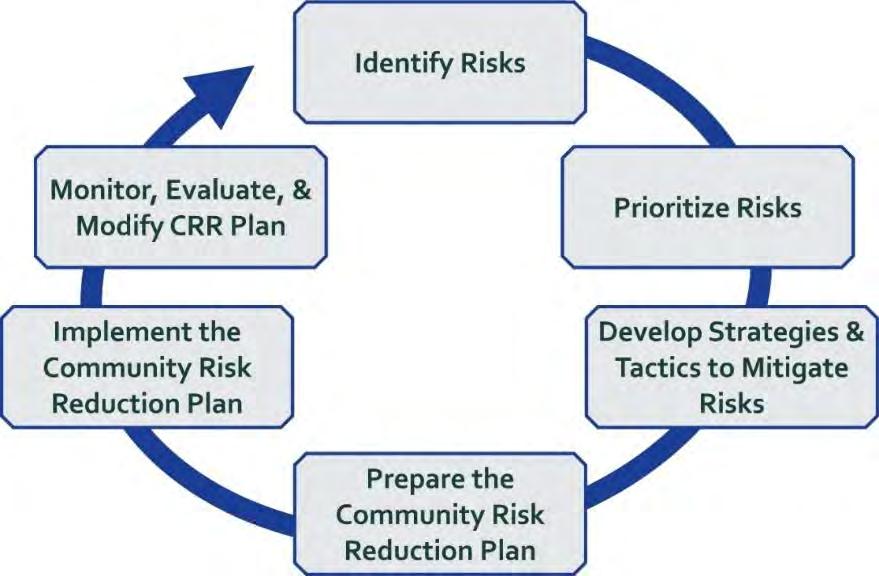
Figure 44. Community Risk Reduction Planning Cycle
The National Fire Protection Association defines Community Risk Reduction (CRR) as “programs, actions, and services used by a community, which prevent or mitigate the loss of life, property, and resources associated with life safety, fire, and other disasters within a community.” Vision 20/20 describes Community Risk Reduction as a “process to identify and prioritize local risks, followed by the integrated and strategic investment of resources (emergency response and prevention) to reduce their occurrence and impact.” In both instances, the previously identified and prioritized hazards form the basis for Community Risk Reduction Programs in an effort to save lives and property.
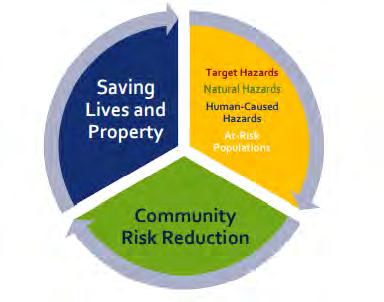
Figure 45. Community Risk Reduction Planning Considerations
Risk Assessment by First Due District
As previously stated within the Community Profile and Risk Identification section of this study, FEMA defines target hazards as “facilities in either the public or private sector that provide essential products and services to the general public, are otherwise necessary to preserve the welfare and quality of life in the community, or fulfill important public safety, emergency response, and/or disaster recovery functions.” The NFPA further breaks these down into three risk categories for occupancies. High-Risk Occupancy: An occupancy that has a history of a high frequency of fires, high potential for loss of life or economic loss, or that has a low or moderate history of fires or loss of life but the occupants have a high dependency on the built-in fire protection features or staff to assist in evacuation during a fire or other emergency.
Moderate-Risk Occupancy: An occupancy that has a history of a moderate frequency of fires or a moderate potential for the loss of life or economic loss.
Low-Risk Occupancy: An occupancy that has a history of a low frequency of fires and minimal potential for life or economic loss.
To provide a visual illustration of the areas of critical need in the Town of Southington, ESCI has produced Risk Assessment by First Due District Maps for each Southington Fire Department first due response area. These maps attribute a risk classification of low-, medium-, and high-risk to each parcel within individual station response areas. Specific Community Risk Priorities are included within the Recommended Future Delivery System Models section of this report.
A portion of the data used by ESCI to compile the Risk Assessment by First Due District Maps was compiled with the assistance of FireCARES: Community Assessment/Response Evaluation System. The content reproduced from the FireCARES Database remains the property of FireCARES and contributing fire departments. The FireCARES team and partners are not responsible for any claims arising from works based on the original Data, Text, Tables, or Figures. FireCARES uses publicly available land use records and associated information, and as such, the locality may have access to more recent and up-to-date records and information.
Community risks were determined via statistical regression models that predict various types of risk as a function of community attributes. Five community risks were modeled separately for low- medium- and high-hazard structures. The community risks were:
▪ Number of reported structure fires, ▪ Percentage of reported fires that spread beyond the room of origin, ▪ Percentage of reported fires that spread beyond the room of origin and spread beyond the structure of origin, ▪ Number of reported injuries resulting from structure fires, and ▪ Number of reported deaths resulting from structure fires.
Community risks were estimated for each of three different classes of structures in a community including low, medium, and high hazard structures as categorized by the NFPA.
Identifying and Categorizing Community Risk
Community risk level is typically established through an overall profile of the community based on the unique mixture of demographics, socioeconomic factors, occupancy risk, fire management zones, and the level of services currently provided.
Consequences of community hazards, associated risk events, and fire department mitigation efforts may be divided into 4 categories.
▪ Civilian and firefighter injury or loss of life. ▪ Property damage or loss. ▪ Critical infrastructure damage or loss. ▪ Environmental damage or loss.
Each of these categories contains hazards and therefore risks relevant to emergency responders.
Characteristics of properties can have significant impact on outcome and associated response requirements. Each property or structure in a community can be considered a hazard that carries inherent risks based on occupancy type and fire load.
Occupancy risk is a sublevel of property risk and is established through an assessment of the relative risk to life and property resulting from a fire inherent in a specific building/structure or in generic occupancy classes (e.g., high rise residential).
The NFPA Fire Protection Handbook defines hazard levels of occupancies by types.
High-Hazard Occupancies – High-rise buildings, hospitals, schools, nursing homes, explosive plants, refineries, public assembly structures, other high life hazard or large fire potential occupancies.
Medium-Hazard Occupancies – Apartments, offices, mercantile and industrial occupancies that may require extensive use of fire fighting forces.
Low-Hazard Occupancies – One-, two- or three-family dwellings and scattered small business and industrial occupancies.
Community risks were also estimated as a function of the socio-demographic and geographic characteristics of the locations (census tracts) of reported structure fires over a nine-year period (20072016) according to available NFIRS data. The socio-demographic attributes include:
▪ Population characteristics (e.g., size category of the department, population, number of males, age group counts, race counts). ▪ Housing characteristics (e.g., total housing units, total vacancies, size of home, number of renters, age of units). ▪ Household characteristics (e.g., median household income, social vulnerability index). ▪ Geographic region.
The final set of variables varied by model and were selected to ensure the best prediction of risk. Note that because deaths are rare, many departments will be predicted to have only a fractional number of deaths.
Community risks are not currently estimated for communities with populations less than 10,000 people because small departments are expected to behave different from larger departments.
Station 1
310 North Main Street
2020 Total Population 2020 Total Daytime Population
2020 Median Household Income
2020 Median Age
2020 Total Housing Units
2020 Owner Occupied HUs 2019 HHs w/1+ Person’s w/Disability (ACS 5-Yr) 2019 HHs: Inc Below Poverty Level (ACS 5-Yr): Percent 2020 Total Businesses (SIC)
2020 Total Employees (SIC)
26,532 23,853 $97,686 46 10,959 8,497 2,564 4.62% 925 8,939
Station 2
128 West Main Street
2020 Total Population 2020 Total Daytime Population
2020 Median Household Income
2020 Median Age
2020 Total Housing Units
2020 Owner Occupied HUs 2019 HHs w/1+ Person’s w/Disability (ACS 5-Yr) 2019 HHs: Inc Below Poverty Level (ACS 5-Yr): Percent 2020 Total Businesses (SIC)
2020 Total Employees (SIC)
7,172 6,360 $109,119 44.4 2,837 2,278 458 4.04% 257 2,412
Station 3
35 Clark Street
2020 Total Population 2020 Total Daytime Population
2020 Median Household Income
2020 Median Age
2020 Total Housing Units
2020 Owner Occupied HUs 2019 HHs w/1+ Person’s w/Disability (ACS 5-Yr) 2019 HHs: Inc Below Poverty Level (ACS 5-Yr): Percent 2020 Total Businesses (SIC)
2020 Total Employees (SIC)
6,438 6,373 $100,342 46.6 2,604 2,069 604 3.47% 319 3,423
Station 5
50 River Street
2020 Total Daytime Population
2020 Median Household Income
2020 Median Age 2020 Total Households
2020 Total Housing Units
2020 Owner Occupied HUs 2019 HHs w/1+ Persons w/Disability (ACS 5-Yr) 2019 HHs: Inc Below Poverty Level (ACS 5Yr): Percent 2020 Total Businesses (SIC)
2020 Total Employees (SIC)
23,853 $97,686 46 10,527 10,959 8,497 2,564 4.62% 925 8,939
2020 Median Age
2019 HHs: Inc Below Poverty Level (ACS 5-Yr)
33.00 1,886.00
2020 Total Population 2020 Total Daytime Population
2020 Median Household Income
2020 Median Age
2020 Total Housing Units
2020 Owner Occupied HUs 2019 HHs w/1+ Person’s w/Disability (ACS 5-Yr) 2019 HHs: Inc Below Poverty Level (ACS 5-Yr): Percent 2020 Total Businesses (SIC)
2020 Total Employees (SIC)
2,989 5,209 $79,049 52.1 1,346 1,134 259 6.39% 372 5,580


