5 minute read
At-Risk Populations


Another benefit of a stable local economy is the rate at which citizens remain in a household. In Southington, 94.7% of citizens report living in the same household as in the previous year. This longevity provides for increased rates of investing in repairs and upgrades to make homes safer and more energyefficient and assists in maintaining housing values. Southington’s one-year rate also outpaces the state, where 87.9% of citizens report living in the same house one year prior, and over the U.S. average of 85.5%.
At-Risk Populations
Advertisement
There are several causal factors determining the population of at-risk individuals or groups within a community. Understanding the causal factors and populations of the community that are at greatest risk will contribute to programs and prevention efforts to address higher risk factors and reduce the effects of the associated risks. These factors also are important to consider when calculating demand for fire and emergency services within the community.
Often defined very broadly, the term “populations at risk” does not include all citizens within a defined group, as they experience risk at varying levels or rates. Coupling two or more risk factors contributes to significantly higher levels of risk than those who only experience one risk category. Those with compounded risk factors should be a priority in prevention programs and strategies.
Broadly, “populations at risk” includes citizens at the lower end of socioeconomic status, those with housing and transportation challenges, those of minority status or with English-speaking challenges, and households containing citizens with disabilities, over 65 and under 17 years of age. More specifically, citizens most at risk include the impoverished, disabled, homeless, racial, and ethnic minorities, as well as people with low literacy. Also, groups suffering from poor health or who are uninsured/underinsured may be at greater risk during emergency or disaster situations.
•65 and older •17 and younger •Single-parent •Disabled •Males
Figure 18. Vulnerability Factors Matrix
•Impoverished •Unemployed •Low Income •Undereducated
Household Composition Socioeconomic Condition
•Minority •Limited English Minority
Ststus
Housing and Transportation
•Multi-Unit Structures •Mobile Homes •Group Housing •Lack of Transportation
Understanding the age, gender, and historical geographic distribution patterns among fire victims is critical to developing appropriate community risk reduction strategies. Additionally, studies have shown that these same factors indicating populations at risk for death or disability from fire, can also be good predictors of medical emergencies and disease. These groups may require greater time, effort, and resources to prepare, evacuate, and recover from emergency situations. In addition to deciding where to focus risk reduction efforts within a community, carefully consider these factors when creating emergency plans for wide-area disasters within the community.
The following discussion includes several of the populations most at risk within the Southington Community.
Males Males, especially those under 25-years of age, are more prone to engage in risky activities. Additionally, males are 1.7 times more likely to die in fires than females. Within Southington, 48.8% of the population are male. The town’s population distribution resembles the State’s, where 468.8% of the population is male.
Figure 19. Gender Distribution in Southington
51.20% 48.80%
Males Females
Age
Southington’s population over 65 years of age makes up 21.1% of the population. Those reaching senior status in Southington are slightly above the national average of 16.5%. Coupled with the senior population to make up those most at risk are the 5% who are under five years of age. These two age groups (26.1% combined) are statistically more reliant on the emergency services offered by Southington Fire Department. Understanding these types of data assists in developing targeted safety campaigns and hazard reduction efforts.
Figure 20. Age Distribution of Southington
14,000
12,000
10,000
8,000
6,000
4,000
2,000
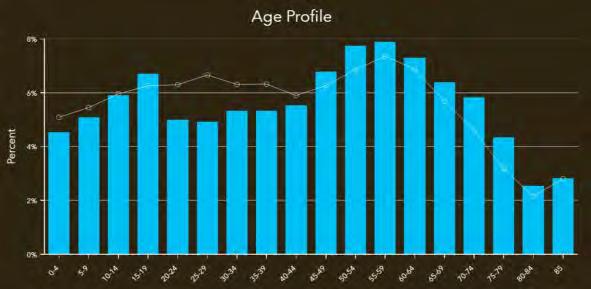
0 Figure 21. Age as Percentage of Total Population of Southington
27.7%
21.1% 30.0%
25.0%
20.0%
13.7%
9.6%
7.4% 15.5% 15.0%
10.0%
5.0% 5.0%
65 and older 55-64 35-54 25-34 18-24 5-14 Under 5
Total Percentage of Total 0.0%
Disability
Fires in the home can be potentially dangerous and deadly for everyone, but persons with disabilities and impairments face additional challenges. Persons with disabilities often have a difficult time identifying or escaping a fire. In 2018, 6% of citizens under 65 years of age in the Town of Southington were reported to have a disability. Overall, 3,932 households identified as having one member with a disability. These citizens in the community would benefit from programs to assist in their needs during times of emergency and for emergency planning efforts.
Figure 22. Number of Households with a Disabled Person in Southington
Language
According to the National Fire Protection Association (NFPA), “Language barriers, cultural differences, and inexperience with unfamiliar home technologies are factors that mark the challenges of helping newcomers live safely from the threat of fire in the home.” By itself, speaking a language other than English at home does not directly contribute to a higher risk of emergencies, however, if a person has difficulty speaking English, it may contribute to negative outcomes during an emergency.
Most of the population within Southington speaks English, whether as a primary or a secondary language. In Southington, 13% of the population purport to speak a primary language other than English. Often, organizations overcome language barriers through a diversified work force, allowing these persons to receive proper care during emergency incidents. Southington Fire Department should continue to monitor the diversification within the town as a future need may arise for fire prevention and risk reduction education in multiple languages.
100%
90%
80%
70%
60%
50%
40%
30%
20%
10%
0% Figure 23. Language Distribution of Southington
87.0%
3.5% 2.3% 1.9% 1.3% 1.2% 0.8% 0.4%
Income
Low-income residents typically utilize government services at higher rates than other economic brackets. Persons living in poverty experience an increased risk from fire and medical emergencies due to the age and condition of their housing, inability to pay for routine medical care, lack of medical insurance, and general health conditions. Often associated with poverty is the lack of reliable transportation, which likewise leads to increased demand for local emergency services.


