


NEW! Rural land insights
Tips for insuring a second home
Corporate Transparency Act’s new reporting requirements
Texas a powerhouse food-manufacturing state
And much more
TM
SPRING 2024
REAL ESTATE R ESE ARCH C E N TE R TEX A S A&M UN IVE R SIT Y TEXAS REAL ESTATE R ESE ARCH C E N TE R TEX A S A&M UN IVE R SIT Y C
TEXAS


COLLEGE STATION, TEXAS 77843-2115 TEXAS A&M UNIVERSITY Texas Real Estate Research Center
NEW! Rural land insights
Tips for insuring a second home
Corporate Transparency Act’s new reporting requirements
Texas a powerhouse food-manufacturing state
And much more
TM
SPRING 2024
REAL ESTATE R ESE ARCH C E N TE R TEX A S A&M UN IVE R SIT Y TEXAS REAL ESTATE R ESE ARCH C E N TE R TEX A S A&M UN IVE R SIT Y C
TEXAS


iii TEXAS A&M UNIVERSITY Texas Real Estate Research Center TR TECHNICAL REPORT MAY 2023 2380 Land Occupier’s Liability Guide Available on our website. TEXAS A&M UNIVERSITY Texas Real Estate Research Center

TEXAS REAL ESTATE RESEARCH CENTER

A Tale of Two Homes | 7 Insuring Multiple Residences
That second home on South Padre may be your summer haven, but the insurance can be complicated. Listing a second home online as a rental adds more complexity.
Richard Rudolph

Bake to the Future | 14 Texas Food and Beverage Manufacturing
The state’s burgeoning food and beverage manufacturing industry has much more potential for the Texas economy, and we don’t just mean Blue Bell and Whataburger.
Daniel Oney
2 | Carnegie History Center Telling Stories Through Research
Old buildings and neighborhoods tell stories that can contribute to a city’s economic growth. A historical research library in Bryan has helped unearth those stories in the Brazos Valley. Bryan Pope
10 | Lessons from Harvey How Natural Disasters Affect Homebuying Decisions
Little is known about how natural disasters affect Texans’ housing choices, but Houstonians’ response to Hurricane Harvey provides clues.
Wesley Miller
19 | Keeping It Clean Texas Property Assessed Clean Energy Act
A growing number of commercial property owners want to go green, but cost can be a deterrent. Here’s a program that can help. Harold D.
Hunt
22 | Nothing to Hide New Reporting Requirements Under the Corporate Transparency Act
Those doing business through entities should be aware of new requirements under the Corporate Transparency Act. Failure to comply could result in civil or criminal penalties. Rusty Adams
26 | Not-So-Obvious Real Estate Investment Tax Strategies
Real estate investors have a variety of tax strategies at their disposal, each with its own complexities. Diligent planning is essential to navigate these nuances effectively. William D. Elliott
Executive Director, PAMELA CANON
Director of Strategic Initiatives, GARY W. MALER
Research Director, DANIEL ONEY
Director of Outreach Innovation, THOMAS CAWTHRA
Senior Editor, BRYAN POPE
Associate Editor, KAMMY BAUMANN
Creative Manager, ROBERT P. BEALS II
Photographer, JP BEATO III
Graphic Designer, ALDEN DeMOSS
Circulation Manager, RYAN PERRY
Lithography, RR DONNELLEY, HOUSTON
ADVISORY COMMITTEE: Doug Foster, San Antonio, presiding officer; Besa Martin, Boerne, assistant presiding officer; Troy C. Alley, Jr., Arlington; Kristi Davis, Carrollton; Vicki Fullerton, The Woodlands; Patrick Geddes, Dallas; Harry Gibbs, Georgetown; Doug Jennings, Fort Worth; Rebecca “Becky” Vajdak, Temple; and Barbara Russell, Denton, ex-officio representing the Texas Real Estate Commission.
TG (ISSN 1070-0234) is published quarterly by the Texas Real Estate Research Center at Texas A&M University, College Station, Texas 77843-2115. Telephone: 979-845-2031.
VIEWS EXPRESSED are those of the authors and do not imply endorsement by the Texas Real Estate Research Center, Division of Research, or Texas A&M University. The Texas A&M University System serves people of all ages, regardless of socioeconomic level, race, color, sex, religion, disability, or national origin. Nothing in this publication should be construed as legal or tax advice. For specific advice, consult an attorney and/or a tax professional.
PHOTOGRAPHY/ILLUSTRATIONS: Center files, pp. 1, 2, 7, 8, 10-11, 14-15, 17, 19, 20-21, 22; Courtesy of Carnegie History Center, pp. 3, 4; Robert Beals II, pp. 5, 26; Bryan Pope, p. 6; Alden DeMoss, pp.12-13, 24-25.
LICENSEE ADDRESS CHANGE. Log on to your Texas Real Estate Commission account to change your mailing address.
© 2024, Texas Real Estate Research Center. All rights reserved.
SPRING 2024 VOLUME 31, NUMBER 2 www.recenter.tamu.edu @recentertx
ON THE COVER: Sunlight breaks through the clouds over Bushong Ranch in Kerr County. Read about the state’s rural land markets in a new column debuting in this issue. Photographed by JP Beato III. TM
Featured Columns 6 | Land Insights NEW! 24 | 2024 Real Estate Forecast Update 28 | Brokerage Q&A SPRING REVISIONS! TEXAS A&M UNIVERSITY Texas Real Estate Research Center

CARNEGIE HISTORY CENTER
Telling Stories Through Research
By Bryan Pope


Key Takeaways
• Of the 1,700 Carnegie libraries built in the U.S., 32 were in Texas. Of those still standing, four are lending libraries while one is now a historical research center.
• The Carnegie History Center in Bryan houses historical materials for research both onsite and digitally.
• The center aids in preserving architectural heritage, fostering economic growth, and revitalizing downtown areas.


It’s one of the most distinctive buildings in Downtown Bryan. With its neoclassical-revival-style red brick, tall windows, white exterior finishes, and four tall columns climbing the height of the two-story building, it’s certainly the most distinguished looking. Just inside the double-door entrance are two narrow wooden stairways—one to the right, the other to the left. About ten steps ahead is the central help desk, the heart of the first floor. The space surrounding it is cozy in the best possible sense of the word. Except for a couple of large study tables and some chairs, the entire floor is packed wall-to-wall,


floor-to-ceiling with books, photos, art, and historical artifacts, many relating to real estate in the region. Upstairs is more of the same. The building smells pleasantly of old wood and even older books. The atmosphere is conducive to the building’s intended purpose: historical research.
Welcome to the Carnegie History Center.
Originally the Carnegie Public Library, the building is now a repository for rare historical materials (although the name on the structure has not changed). The center’s holdings are astonishing. They include family Bibles, old court records and

2 TG SPRING 2024 RESEARCH


amateur history buff could piece together a respectably detailed history of the Brazos Valley, its real estate, and its people. That’s why the library’s resources are used largely for genealogical research.
Largely, but not entirely.
Carnegie History Center Branch Manager Rachael Altman recalls helping a woman in need of documentation to resolve a land dispute.

THE MORE THAN 120YEAR-OLD Carnegie Public Library building in Bryan is the state’s oldest functioning Carnegie library. Now a historical research center, its holdings include documents that have aided the area in preserving historic buildings.
school records, countless photos and maps spanning the early 19th century through the 20th century, and collections of documents donated by some of the city’s founding families. Some materials document aspects of the area’s history that are unpleasant but no less important. For example, the center has a zoning map from the ’50s showing how schools were segregated and original bills of sale from the slave trade (one written on what appears to be stationary from a London hotel).
“She was Italian and had land that goes back several generations,” Altman said. “She came here to do land research for a contested ownership dispute. I think the previous owner had passed away and didn’t leave a will or enough documentation. We were able to help her establish the genealogy of that particular piece of land through all of our records and maps.”
As a gesture of thanks, Altman said the woman treated the staff to a homemade lasagna dinner. History has never tasted so good.
Carnegie’s Legacy of Learning
Established in 1903, the Carnegie History Center was originally a lending library, one of around 2,800 built by Scottish-American steel magnate and philanthropist Andrew Carnegie from the 1880s through the 1920s. He donated $40 million toward the libraries globally (roughly $1.3 billion in today’s dollars), bringing history books and literature to millions of people who otherwise wouldn’t have had access. A highly regarded writer himself, Carnegie once wrote, “A man who acquires the ability to take full possession of his own mind may take possession of anything else to which he is justly entitled.” His libraries were a testament to that.

Armed with such a rich treasure trove of documents (plus a little time and a lot of patience), even the most
The history center’s uses for real estate extend even further, though, potentially serving as a tool for economic development in the Brazos Valley. The library’s onsite and online resources can help with the restoration of historic homes and even downtown renovations, and studies have shown that heritage-related tourism can mean big business for smaller communities. More on that later.

Almost 1,700 of Carnegie’s libraries were in the United States, and 32 of those were in Texas (see map on page 5). The first Texas library was built in Pittsburg (Camp County) in 1898. Construction of the Bryan library began in 1902 with a $10,000 donation from Carnegie, a sizeable amount at the time.
Most of the Texas libraries are no longer standing, while some have been repurposed. Of the five still operating as libraries, the one in Bryan is the oldest. However, it served as city office buildings starting in the late ’60s before reopening in 1999 as a special collections library and genealogical research center.


Giving History a Home
These days, Altman said they keep their doors open and the lights on mostly through funding from the City of Bryan.
“We also apply for various grants, and we receive generous donations from patrons and through the Friends of the Library,” she said.
While funding isn’t an issue, finding documents, maps, photos, and other artifacts can be. It often depends on good luck and great timing.
“We’ve seen people who work in community buildings putting boxes of old documents by the dumpster or loading them into their car,” Altman said. “There was this lovely local group called the Brazos Genealogical Association that saved court records dating back to the 1820s from the dumpster.”


Some of the library’s most important historical documents came from individual donors and local groups. For example, a collection of Bryan City Council minutes— including old leases, deeds, agendas, maps, and plats—was donated by the late Dr. Paul Van Riper, former head of Texas A&M University’s Department of Political Science and founder of the


Citizens for Historic Preservation. The Citizens for Historic Preservation also donated the Cavitt Collection, named after one of Bryan’s earliest and most prominent families.
“When we reopened back in ’99,” Altman said, “we put out a call to the community asking for any historical books and photos they thought would be good additions here. People were finding things at estate sales and sending them to us.”
Then there’s the matter of making materials available in a format that preserves the documents. Visitors can browse the center’s shelves of books, but some of the more delicate documents can be viewed only via microfiche. A few years ago, the center

began digitizing its collections to make them available online, a process that relies on the center’s small staff and a group of volunteers and will take considerable time to complete.
Although the Carnegie History Center’s collections are specific to the Brazos Valley, they partner with other major public and university libraries around the state. They also provide users with access to extensive online resources that might be out of the price range of many organizations and individuals.
“Newspapers.com is an amazing resource for digging up old articles and photos from just about everywhere, but it can be expensive. You can access it for free at our library,”
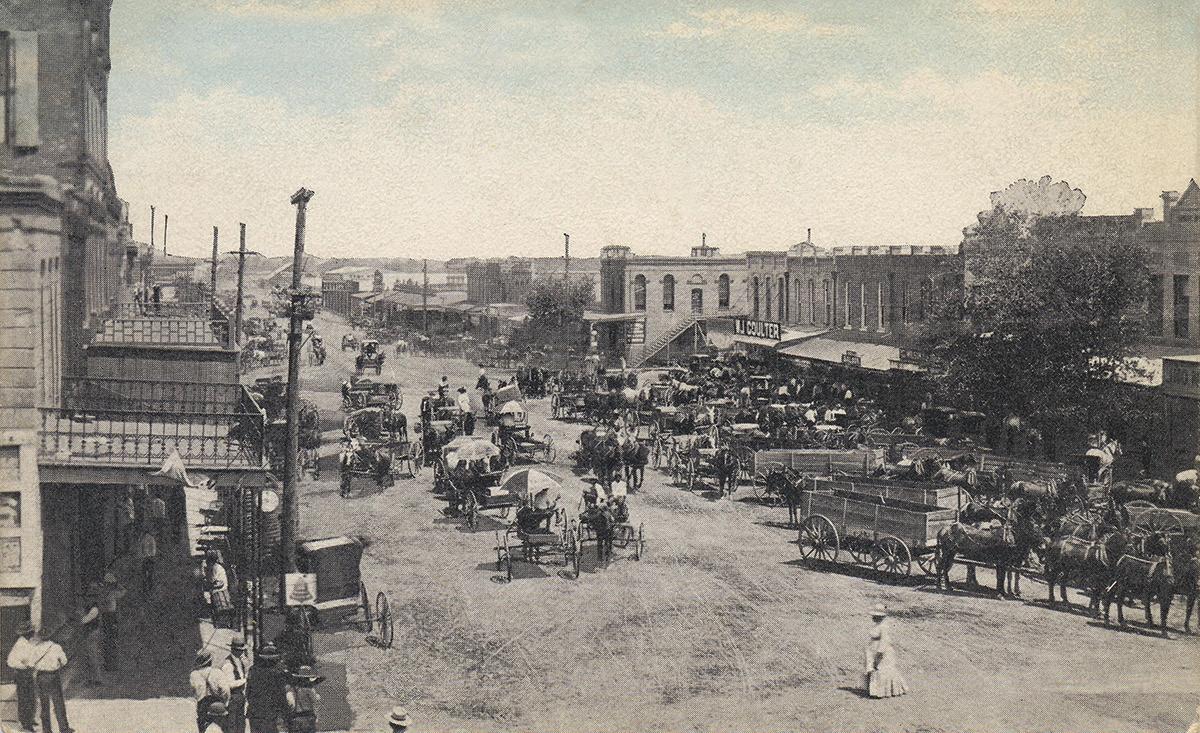
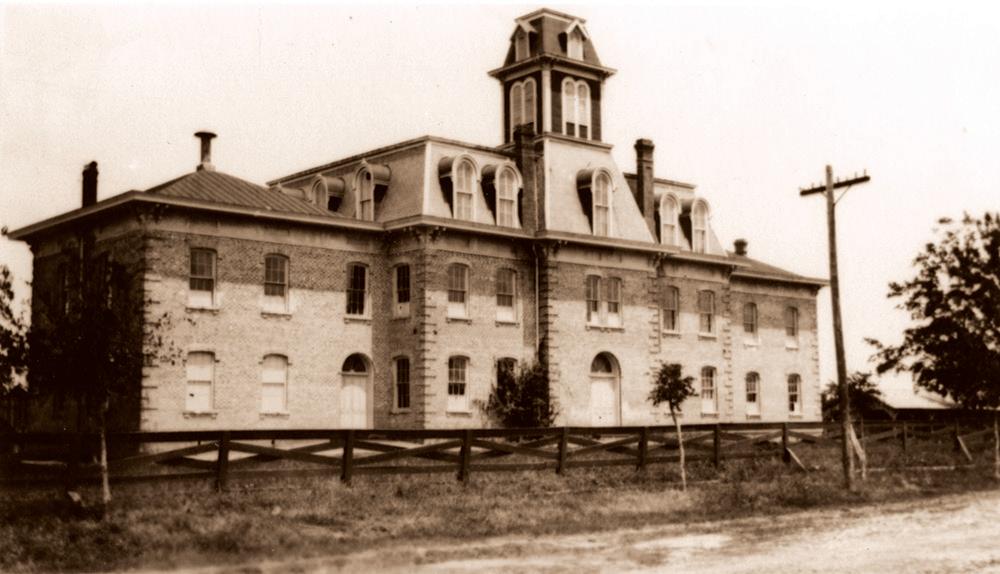
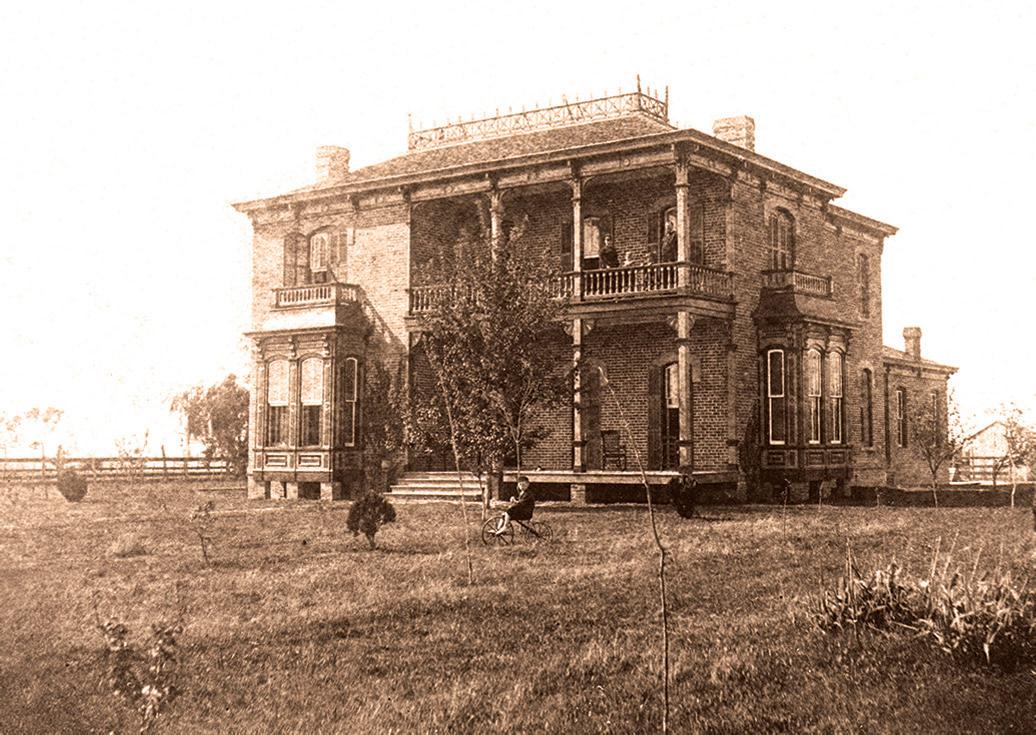
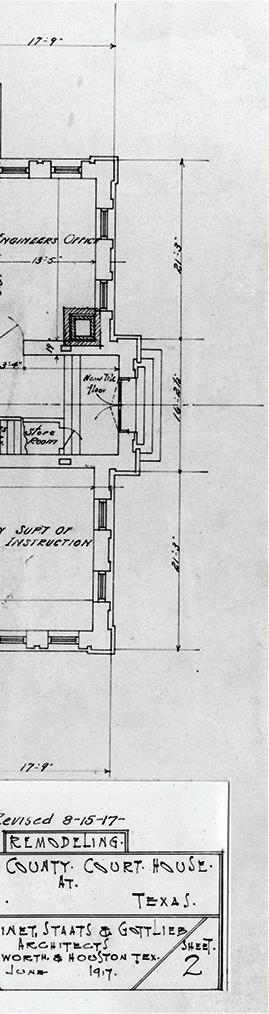
 FROM THE LIBRARY’S HOLDINGS: Clockwise, Bryan’s Main Street (circa 1900), Cavitt House (circa 1875), original Brazos County Courthouse building plan (1st floor), and Original Bryan School (circa 1880).

Altman said. Other online resources available through the center, as well as at other public libraries, are Texshare.net and Newsbank.com. Ancestry.com is another big draw for the center’s in-house patrons.
How History Can Boost a City’s Economy
The vast resources of Carnegie and other public and university libraries are useful to individuals hoping to put together histories of their families and heirloom properties, but they can also prove invaluable to cities in preserving historic buildings and even restoring whole neighborhoods. This potentially means economic growth for communities, as shown by downtown revitalizations that have occurred across the state over the past 30 or so years (for more on this read “This Old Loft: Downtown Living in Small Town Texas”) by scanning the QR code.

Carnegie Library Real Estate Footprint


The Texas Historical Commission (THC) commissioned a study of the economic impact of historic preservation. Conducted by the University of Texas and Rutgers University, it’s one of the earliest and most comprehensive studies ever done on this topic in the United States (conducted in 1999 and last updated in 2015).
The study concluded that “more than 10.5 percent of all travel in Texas is heritage-related, and that number continues to rise. Heritage tourists contribute more than their share to spending, $7.3 billion or about 12.5 percent of total visitor spending in Texas.”


In addition, according to the report, “private property owners invest almost $741 million annually in rehabilitation of designated historic buildings, more than 7 percent of all building rehabilitation activity. Public entities add at least $31 million for a total annual historic rehabilitation investment in Texas of approximately $772 million.”
The THC says historical designations can help qualify property owners for grant funding or tax incentives.
Meanwhile, as of 2015, THC’s Texas Main Street Program has helped 89 downtown districts with revitalization efforts, producing an average of $310 million annually in state GDP.


Cid Galindo and Dr. Steve Wiggins recognized the importance of a vibrant downtown district—and the role history plays in restoring that vibrancy—back in 1986 when they proposed a comprehensive revitalization plan for Downtown Bryan.
“It is the common historical heritage of Bryan that appeals to the widest possible socioeconomic range of the community,” they wrote. “The sense of historical continuity weaved into the bricks and sidewalks of Main Street is the single most important asset downtown has.”
Having a building receive a historic designation requires not only a thorough knowledge of its history, but documentation verifying that history. The minimum age for a building to qualify and receive a plaque is 50 years.

“If you have proof that, say, a senator drafted a piece of legislation while staying on the property, it definitely helps build your case to be granted the designation,” Altman said.
And, of course, earning a historical plaque also means restoring a building to its original condition.
“To do that,” Altman said, “every architectural detail must be right.”


She said old photographs and even original architectural sketches archived at the center have helped with the restoration of numerous wellknown local landmarks, including some downtown. Owners of the Astin Porter House, Cavitt House, and Milton Parker B&B, several of the city’s most iconic historic homes, have also turned to the center for assistance with their restoration efforts.
Changing Lives, Reviving Communities
Historical preservation is about much more than fixing up old buildings. It’s about finding a building’s story, weaving it into the fabric of the region’s history, and sharing it with the world.

Those stories, even if they’re 100 years old or older, can change lives today, whether by helping someone retain a piece of land that’s been in the family for generations or by putting a forgotten neighborhood—or even an entire town—back on the map.
“Buildings and land are a lot like people,” Altman said. “They have their own stories to tell. We help them tell it.”

Bryan Pope (b-pope@tamu.edu) is senior editor with the Texas Real Estate Research Center.

TG SPRING 2024 5 INTERSTATE 10 INTERSTATE 30 INTERSTATE 20 INTERSTATE 40 INTERSTATE 35 INTERSTATE 37 INTERSTATE 27 INTERSTATE 45 Cleburne Stamford Active library
library (repurposed)
Inactive
Ballinger Belton
Jefferson Marshall
Tyler Franklin Gainesville Sherman Palestine
Bryan
Terrell
Source:
Texas Real Estate Research Center at Texas A&M University

Land Insights
By Lynn D. Krebs
High interest rates continue to reduce effective demand for many appreciable assets, including rural land. Texas land brokers report low inventories and activity, with scattered price reductions in several listings. Widespread capitulation is not evident, but some investors appear to expect better buying opportunities around the corner. Additionally, declines in total dollar volume and the recent slowdown in price appreciation imply many potential buyers think prices are too high, at least considering current financial conditions. Nonetheless, high-quality lands are still selling at handsome prices.
Year in Review – Land Sales
Our 2023 large land sales sample includes a total of 279,509 acres changing hands, down 61.2 percent over 2022. Market activity has fallen below normal levels at high prices. The typical transaction size retracted 7.5 percent from the same quarter a year ago.

The fourth quarter of 2023 saw annual sales volume slip 44.6 percent yearover-year (see table). The third quarter of 2023 saw a similar decrease, but the 4Q2023 drop in quarter-only volume is not as drastic with sales down just 14.7 percent. Nonetheless, the cooldown in sales is obvious. Sales activity has decreased dramatically over the last 18 months to levels not seen since 2013. Even while sales volumes are down, prices continued to rise on par with the annual rate of increase we observed from 2016 to 2019. Based on the latest data, prices rose 5 percent to $4,670 per acre statewide from year-end 2022 through year-end 2023.

these declines, with 2023 falling 45 percent below 2022. The typical size among the LMAs was down 6 percent to 115 acres.
Outlook
Trends were similar across each of Texas’ seven regions, with some important differences.
Except for Region 7 (Austin–Waco–Hill Country), where price dipped ever so slightly (less than 1 percent), the remaining regional prices continued to increase, from 0.6 percent in Region 5 (Gulf Coast–Brazos Bottom) to a whopping 23.6 percent jump in Region 2 (Far West Texas). However, every region saw a decline in total acres sold. Region 2 declined the least at 26.5 percent while Region 3 (West Texas) saw the steepest decline in acres sold at 74.4 percent. Interestingly, Region 1 (Panhandle–South Plains) displayed the most striking contrast of acres sold and price per acre, down 62.2 percent and up 11.3 percent, respectively.

TTotal dollar volume declined by 59.2 percent over the prior annualized total.
his trend to rising prices and declining activity suggests demand is decreasing. Therefore, it is not surprising that brokers report fewer enthusiastic potential buyers except for the most attractive tracts of land.
Comparing sales from 2022 to 2023 across Texas’ 33 Land Market Areas (LMAs) also indicates a mix of gains and losses in prices statewide with the quarterly median up 4 percent overall. Eleven LMAs had falling prices, but only one indicated a statistically verifiable trend (LMA 17, Hill Country South). However, 11 LMAs with price increases showed a verifiable trend. Every LMA except Canadian Breaks (LMA 5) saw annualized declines in sales volumes. The report confirms
There have been signs that inflation and the labor market are cooling, though inflationary concerns endure. The Federal Reserve is widely expected to maintain the current funds rate through at least the first quarter. Most market prognosticators expect the Fed to begin rate cuts around mid2024, but this is speculative.
The Russia/Ukraine war drags on, and Middle East tensions remain high, two factors that complicate energy markets. However, expectations of a recession in the first half of 2024 have all but evaporated. Government spending has in part stimulated consumer spending and propped up the economy longer than most expected. The labor market is mixed; while headline numbers are strong, average hours worked have softened and much of the job growth came in part-time work.


The reported rate of wage growth has caught up to inflation generally, but consumer debt is rising and aggregate savings are now below pre-pandemic levels. Meanwhile, a cloud of concern hovers over commercial real estate, given higher cap rates and roll risks, especially for office space in markets with reduced occupancies. Texas GDP growth and total Texas personal income are stronger than national GDP and income growth.

While such conditions often favor investments in land, buyers are exhibiting caution.
 Lynn Krebs, Ph.D. (lkrebs@tamu.edu) is a research economist with the Texas Real Estate Research Center.

Statewide Annual Change (Percent) Price Per Acre 5.0 Total Dollar Volume -59.2 Sales Volume -44.6 Average Acreage -7.5 Total Acres -61.2
Insuring Multiple Residences A Tale of Two Homes
BY RICHARD RUDOLPH
Key Takeaways
• Insuring unoccupied homes presents unique risks.
• Make sure company knows policy is for a second home.
• Listing a home on any online rental marketplace presents further complications.
Homeowners insurance is a special insurance policy to protect the property and liability exposures arising out of an individual’s primary residence, but some individuals have more than one residence, often called a “get-away” home. When there is more than one residence, the homeowner must be aware of the insurance ramifications of having alternative residences to avoid problems with both the primary and secondary residences. There are additional considerations for homeowners who choose to list properties as short or long-term rentals.
The basic way to insure a get-away home is with an ordinary homeowners insurance policy, but disclosing to the insurance company that this home is not the primary residence. This is because a vacant or unoccupied home presents a higher risk to the insurance company as no one is around to look after the home for what could be extended periods of time. Failure to disclose the dwelling as a secondary (and therefore less occupied home) may result in an unpleasant surprise if a loss occurs to the secondary residence. In some instances, failing to disclose this fact
TG SPRING 2024 7 RESIDENTIAL
may result in the cancellation of policies for both homes.
The secondary dwelling and its appurtenant structures are insured for property losses in the same manner as the primary dwelling. Since liability insurance for the homeowner is based primarily on the actions of the insureds rather than on a specific location and, therefore, is shared, the homeowner is paying for duplicate coverage without benefiting from it, resulting in wasted premiums. However, attempting to remove the duplicate coverage would result in a higher premium on the property portion of the policy and less favorable coverage.
Tips for Ensuring Secondary Home is Covered
Homeowners insurance policies distinguish between an unoccupied house and a vacant house; the key difference being the homeowner’s intention to return to the primary residence. For insurance purposes, an unoccupied house is one left in a state that suggests the owner will return “shortly.” For example, unlike
with a vacant house, the utilities in an unoccupied house are fully functional, and the personal effects remain.
Some exclusions and restrictions are activated when a property is deemed to be unoccupied or vacant. To minimize the chance of a loss not being covered because of an interpretation by a claims adjuster that the home is unoccupied or vacant, there are several steps a homeowner should take.
1. Read the entire homeowners policy to understand the definitions that are relevant to a secondary residence. Because insurance policies are difficult to read without training, the insured should speak to a professional insurance agent or broker from whom they purchased the policy to determine exactly what the policy says about unoccupancy and vacancy.
If there is a reasonable possibility— based on policy wording, the custom and practice of the specific insurance company providing the homeowners insurance policy, or relevant case law—that a secondary home would be considered vacant if left unoccupied
for an extended time, the homeowner should consider finding a new insurance company with a less stringent interpretation of vacancy. Fortunately for the homeowner, this situation, while not unheard of, is uncommon.
2. Purchase insurance coverage for both primary and secondary homes from the same insurance company. The reason is two-fold. First, many insurers do not wish to insure secondary homes on a standalone basis. Second, since the homeowners insurance policy provides liability coverage to the insureds at or away from the premises, in the event of a liability loss such as an insured striking a person with an errant golf ball, two insurance companies would be involved in any claim. Even with the same insurance company on both homes, both policies would cover the loss, but the limit of liability is not increased; instead, it is shared by both policies. While the homeowners insurance policy contains a clause addressing “Other Insurance,” this provision is nonetheless often contested by homeowners following a loss. In addition, using the same insurance company avoids


8 TG SPRING 2024
Where Check in Check out Who Search destinations Add dates Add dates Add guests HOUSE RENTAL
gaps and overlaps in coverage that may result in time-consuming coverage disputes and expensive litigation.
3. Be certain the insurance company knows the policy is for a secondary residence. Some insurance companies have specific underwriting rules about secondary homes, and the best time to learn those is before the policy is written, because the homeowner will certainly learn them after a loss occurs.
4. Because of restrictions contained in the standard homeowners policy, use common sense in handling utilities when the home, whether primary or secondary, is to be left unoccupied for an extended period. That means taking reasonable care to maintain heat or to shut off the water supply and drain all systems and appliances. However, if the home has
an automatic sprinkler system, take care to shut off the water supply and drain everything without disabling the protective device. Failure to maintain the automatic sprinkler may jeopardize fire coverage. Money saved by zealously turning off all utilities is small compared with the cost of an uninsured or partially insured loss.
5. Install a video surveillance system or cameras to protect against theft and vandalism. While such devices do not prevent losses, their presence may deter the “professional” burglar and aid in identifying the perpetrators and recovering stolen property. This step may be important because of the policy conditions found in the definition of
the theft peril regarding vacancy.
Secondary homes can be rewarding and enjoyable, but insuring one requires care and judgment both with the purchase of insurance coverage and with the normal steps of maintaining and caring for the property.


FELLOW RESEARCH

Richard Rudolph, Ph.D. (famousreindeer2@yahoo.com) is a research fellow with the Texas Real Estate Research Center and has 20 years of experience in insurance brokerage and 30 years of experience in insurance and risk management consulting and education.
For more on this, read the online version of this article.


Because the secondary residence is not used much of the time, the owner may decide to list it on an online marketplace for short-term and long-term rentals. This adds an entirely new layer of complexity in the purchase of homeowners insurance policies. Here are some of the potential problem areas facing the homeowner/ landlord.
“Business” is defined and excluded or limited unless “no ‘insured’ receives less than $2,000 in total compensation for the 12 months before the beginning of the policy period.” So, offering short-term or long-term rentals to the general public could easily be seen as operating a business, and if the rental income exceeds $2,000, the exclusion could be triggered, and an otherwise covered loss could be denied.
For landlord’s furnishings, the policy pays “up to $2,500 for your appliances, carpeting, and other household furnishings, in each apartment on the ‘residence premises’ regularly rented or held for rental to others by an ‘insured,’” but the peril of theft is excluded.
Personal liability has an exclusion for “business” with an exception for “the rental or holding for rental of an ‘insured location,’ on an occasional basis if used only as a residence.” “Occasional basis” is not defined in the policy, but rather is determined after the loss by the claims adjuster.
Coverage for medical payments does not apply “to any person, other than a ‘residence employee’ of an ‘insured,’ regularly residing on any part of the ‘insured location.’”
Under damage to property of others, the sublimit of $1,000 is not available for “property owned by or rented to a tenant of an ‘insured’ or rising out of a ‘business’ engaged in by an ‘insured.’”
In short, the homeowner/landlord may be personally responsible for damage to the home and its contents, or for personal injury, medical payments, or property damage of the renters. The homeowners insurance policy may expose the homeowner to significant coverage gaps.
Because some insurance companies will not insure homes that are used as rentals, homeowners who rent their homes need to disclose their plans to offer the home for rent on an online market.
Some insurance companies will offer an endorsement that allows for “occasional” rentals and provide limited coverage. Again, “occasional” is not defined and is therefore subject to interpretation after a loss occurs.
Another option—and it’s an extreme one—is purchasing business or commercial property and liability insurance on the house, which is more costly than a homeowners insurance policy with less coverage.
A homeowner offering their home for short-term or longterm rental does have the convenient option of purchasing coverage offered by the online platform (such as Airbnb), but that coverage typically is more limited in scope.
Homeowners wishing to rent their “unoccupied” home, whether the primary or secondary residence, should discuss this matter with their insurance agent or broker to determine which option is appropriate.
TG SPRING 2024 9
Lessons from
How Natural Disasters Affect Homebuying
By Wesley Miller


Key Takeaways
• Out-of-Houston migration spiked after the 2017 storm.
• Property damage pushes people out of homeownership.
• Destruction was unevenly distributed socioeconomically.
• Damage-induced movers tend to relocate to higher-income neighborhoods.
Natural disasters have shortterm and long-term impacts on local demographics and housing markets. There is an immediate impact on economic activity amid damage to physical capital and infrastructure. These disruptions spill into labor markets by affecting transportation networks and as individuals focus on recovery. In the long-run, natural disasters typically lead to net out-migration, decreased income, and lower real estate values.
While the regional impacts of disasters are well documented, much less is known about how Texans have responded in terms of their housing
and neighborhood choices. Housing market outcomes following disasters reflect the choices of those directly impacted and others whose choices may reflect awareness of the disaster. Households and businesses may change their location and investment choices based on an area’s perceived disaster risks.
These choices drive housing activity during the recovery process, and understanding the circumstances in a post-disaster market can make real estate professionals better equipped to find housing for their clients after these events. Moreover, household responses to natural disasters have
10 TG SPRING 2024 RESIDENTIAL
Homebuying Decisions Harvey


important implications for changes to the local tax base and neighborhood composition. All these factors interact with policy decisions surrounding land use and building regulation, insurance markets, and disaster relief.
It’s possible to glean some insights from Hurricane Harvey, which wreaked havoc on hundreds of thousands of people in the Houston area when it struck in August 2017.
Harvey produced record-level rainfall that impacted more than 200,000 Houston homes, approximately 10 percent of the MSA’s housing stock, and caused $125 billion in direct damage. The shock to local home
sales was immediate as the storm disrupted real estate transactions (Figure 1). Housing sales, however, normalized within a few months. A deeper understanding of disaster response is necessary to explain the recovery pattern.
Socioeconomics of Flooding
Flooding from Harvey was widespread, but the destruction was unevenly distributed. Those impacted were different socioeconomically for several reasons.
Individuals differ in their desire and ability to address disaster risk. Risk-averse individuals may select locations away from water sources or implement mitigation measures (e.g., the installation of flood vents). Others may value water as an amenity and prefer to live near the natural resource, increasing their risk of flooding. In some cases, they discount the risk relative to the benefits of being near the water.
Impacts also differ because communities may make different choices in terms of infrastructure investment and maintenance. This can lead to varying levels of local damage.
Historical development patterns also influence the differences in disaster impact. For instance, older neighborhoods may be near waterways because of the historic importance of water-borne trade.
Harvey’s Impact on Migration and Home Sales
It’s common for residents to leave an area in the wake of a natural disaster. Indeed, out-of-Houston migration spiked immediately after Harvey.
Migration rates were roughly the same in flooded and non-flooded census blocks, suggesting neighborhood-level damage played little role in individuals’ mobility decisions. Property-level damage, however, appears to have a bigger influence
on behavior. Households exposed to $10,000 of flood damage were 40 percent more likely to move out of their pre-Harvey residence within six months of the storm compared with their non-flooded neighbors.
The initial wave of moves occurred in 4Q2017 and 1Q2018 before settling through 2019. Damage caused an immediate increase in within-county moves that persisted for nearly two years. In contrast, there was a delayed decrease in out-of-county moves that lasted several quarters before dissipating. Longer-distance moves may require more planning and may be more costly, potentially explaining the delayed response after a disaster.
Economic theory predicts an aggregate decrease in home sales after natural disasters because of decreases in both housing stock and demand. Similar to the pattern in migration, there’s little relationship between neighborhoodlevel damage and home sales (Figure 2). The number of home sales in highand low-damage subdivisions track similarly before and after Hurricane Harvey. If anything, high-damage subdivisions suffer a stronger shock on impact, then rebound higher for longer.
However, property-level damage caused home sales to drop in the short run. Suffering $10,000 of damage decreased the odds that homeowners would sell within six months by 21 percent compared with their non-flooded neighbors. The cumulative impact grew for about a year and persisted through 2019.
Homeowners considering moving may choose to repair their property before selling, and many flooded households were forced to wait months after Hurricane Harvey for full disbursement of disaster aid or insurance payments to help fund this investment.
TG SPRING 2024 11
Impact on Homeownership
While a natural disaster’s impact on relocation decisions lessens over time, the impact on homebuying is persistent.
For example, there is a substantial transition into renter occupancy for those who end up selling their house after suffering propety damage. Looking only at these movers, households exposed to $10,000 of damage are 3 percent less likely to own their next residence compared with their nonflooded neighbors. In other words, Harvey-related damage prevented roughly 1,100 home sales through 2019, resulting in around $300 million in lost dollar volume.
This change in housing consumption directly impacted household wealth. The transition from homeowner to renter occurred between 2017 and 2022, when Houston’s average sale price increased 42 percent. The average pre-storm home value for flood-exposed households who moved to rental properties was roughly $245,000. Applying the average increase in sale price, these homes would have surpassed an average of
$347,000 by 2022. This appreciation, combined with an average of $73,000 of damage (a positive if the homeowner receives money from insurance or through government assistance) incurred by these households, suggests approximately $175,000 of potential lost wealth for households who became renters because of flooding.
Where do Impacted Homeowners Go?
Flood damage influences the types of neighborhoods and homes where individuals choose to live. Houston households impacted by flooding tended to move to higher-valued homes and higher-income neighborhoods. These changes in socioeconomic environment, combined with the estimated decrease in homeownership, highlight the potential tradeoffs in a postdisaster environment.
Since disaster damage pushes people out of their neighborhoods and into new economic environments, the impacts of extreme weather may extend into other aspects of life. These neighborhood effects may
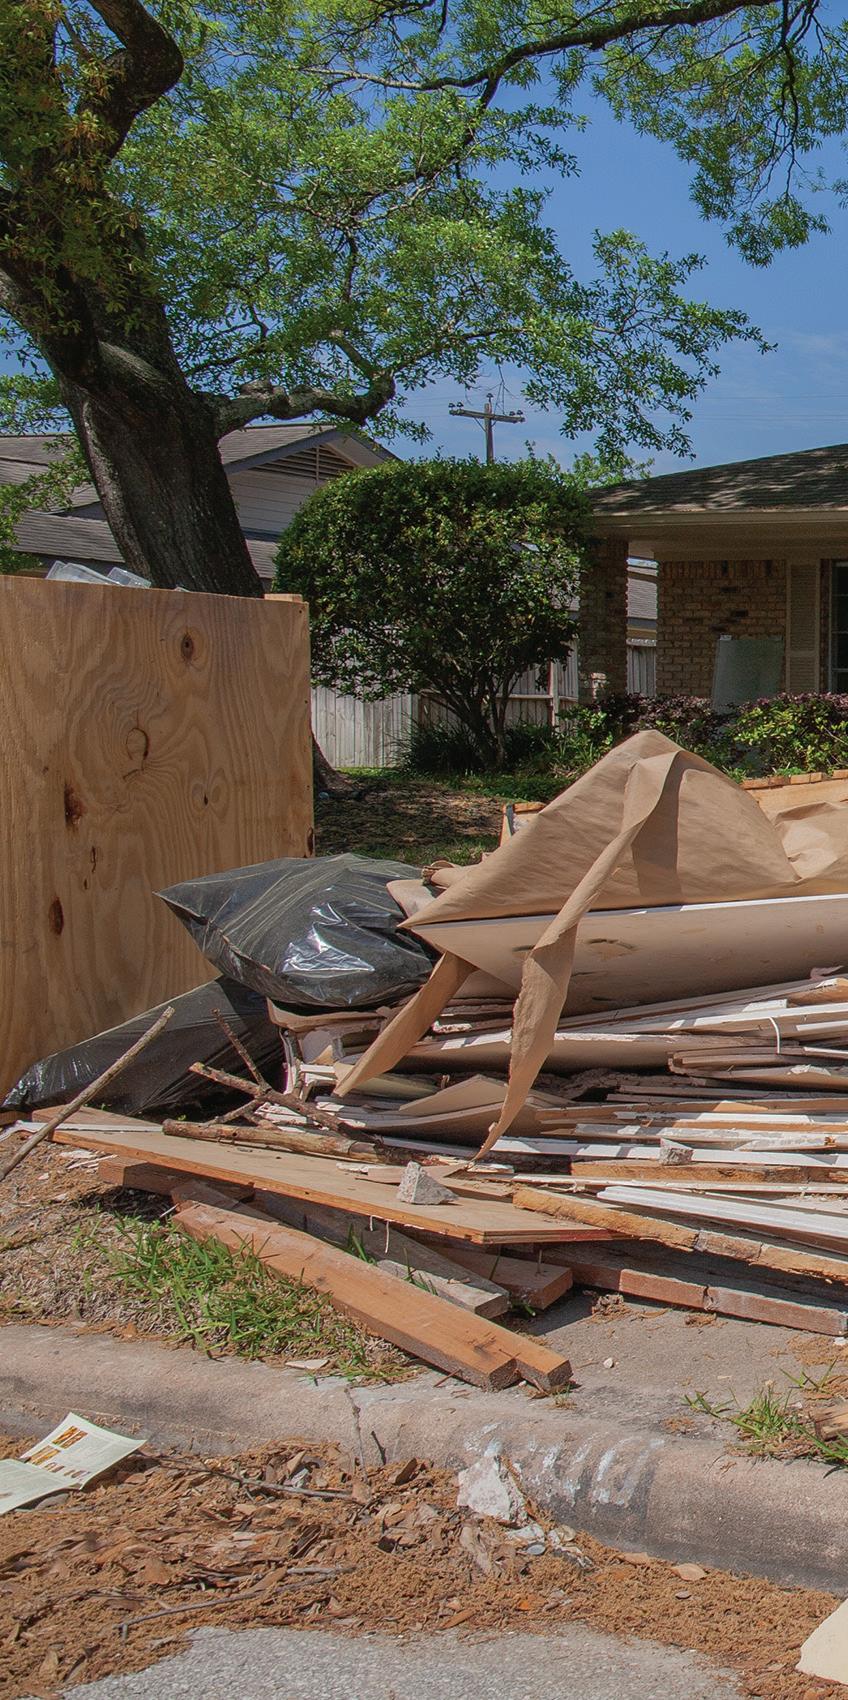
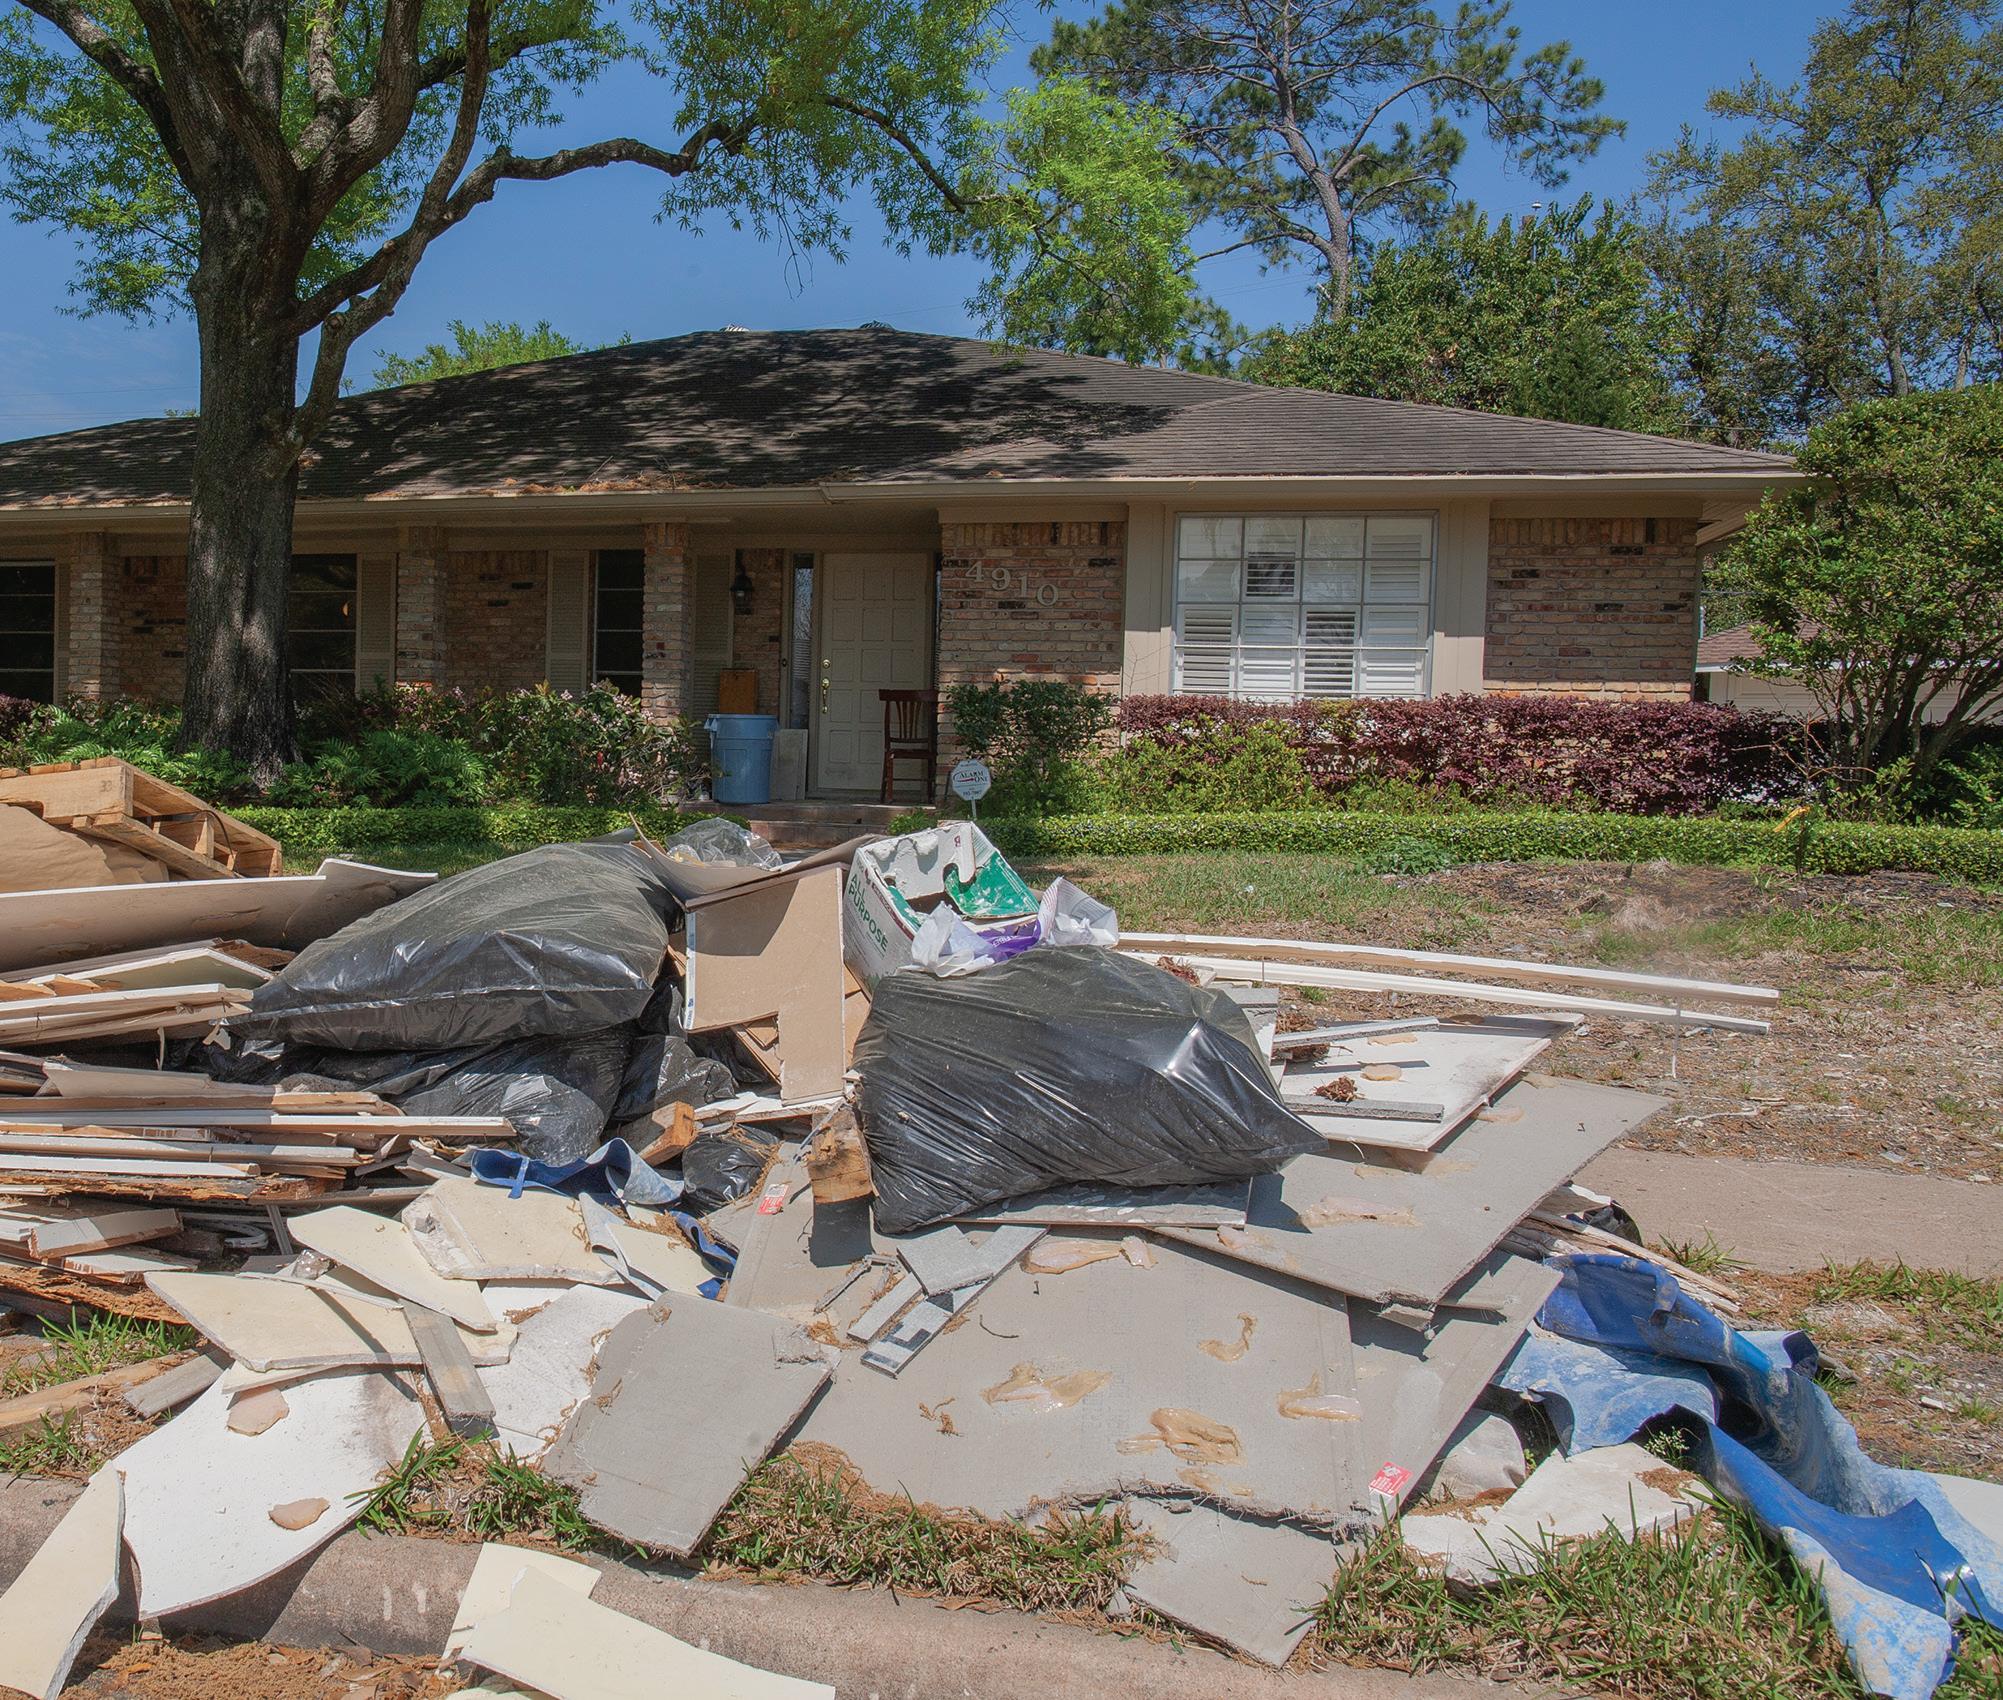
HURRICANE
in 2017, impacting more than 200,000 homes—roughly 10 percent of the city’s housing stock—and causing $125 billion in direct damage.

12 TG SPRING 2024
6,000 5,000 4,000 3,000 2,000 1,000 0 2013 2014 2015 2016 2017 2018 2019 2020 Count (Seasonally Adjusted) Closed Listings 2013 2014 2015 2016 2017 18,000 15,000 12,000 9,000 6,000 3,000 0 Count (Seasonally Adjusted) Deed Transactions
Figure 1. Post-Harvey Drop in Houston Home Sales
Notes: Monthly counts are seasonally adjusted. Sources: Multiple Listing Service and deed transaction data are obtained from the Texas Real Estate Research Center’s Data Relevance Project and CoreLogic, respectively.
HARVEY HIT HOUSTON

For more information, read Miller’s technical report How Natural Disasters Affect Homebuying Decisions, by scanning the QR code.

improve or hurt the transition into different types of housing.
The combination of results raises important questions about the effectiveness of disaster aid. For example, the delayed effect on housing transactions may indicate that Small Business Administration loans are keeping people from losing their homes immediately after catastrophic events. Despite this assistance, disaster damage eventually led to a substantial transition out of homeownership and into rental housing. It’s unclear what ought to happen because of this transition, especially as flooded households tend to relocate into higher income neighborhoods that may offer improved economic opportunities.

Wesley Miller (wamiller@tamu.edu) is a senior research associate with the Texas Real Estate Research Center.
TG SPRING 2024 13 Transactions (Seasonally Adjusted) 1,000 800 600 400 200 0
Reservoirs’ Subdivisions 2011 2012 2013 2014 2015 2016 2017 2018 2019 High Damage Subdivision Low Damage Subdivision
Source: CoreLogic
Figure 2. Home
Sales
in Houston’s Addicks, Barker
Notes: The count of CoreLogic deed transactions are collapsed at the subdivision-phase level. Subdivision-phases with above zero average property damage are classified as “high damage.” The two series are residualized by quarter and rescaled by the constant term.


the Future Bake to


Texas Food and Beverage Manufacturing
 By Daniel Oney


INDUSTRIAL
14 TG SPRING 2024


Key Takeaways


• Food and beverage manufacturing is a growing industry with much economic potential.
• Investment is on the rise.

• Perishable raw materials need specialized places and workers with specific skills.


More than 128,000 Texans earn their daily bread manufacturing food for the rest of the state. While the industry is already important and growing, there’s room for more local investment. That’s essential for jobs, real estate, and the lives of Texans.


• Bakeries, snack food manufacturers, and beverage plants are examples of providers that locate in major markets.
The food-manufacturing industry is different from other goods-producing industries. The raw material is perishable. Food is also essential, and this attracts a lot of attention. The industry is heavily scrutinized from cultural, health and nutrition, and even national security perspectives. These distinctions impact site selection and operations in important ways.
An Industry with a Unique Flavor


Food spoils quickly, adding cost and complexity to the industry. Extraordinary efforts go into moving products
from farm and feedlot to consumers quickly. Factories, warehouses, trucks, and rail cars that serve the industry must have refrigeration and freezer capacity, and workers with specialized skills are needed to maintain the air conditioners and freezers. Running and maintaining specialized equipment to quickly process, preserve, and package food adds further to the industry’s talent burden. Food-manufacturing facilities tend toward hot and cold climate extremes and can be messy environments. This means the industry pays a premium for production talent at every skill level.
Such manufacturers balance access to suppliers and access to customers when siting facilities. With enough capital investment, most any food can be grown anywhere. In practice, it is often cheaper to source crops and animals from where


FALL 2023
TG SPRING 2024 15
nature favors them. In these cases, initial processing may locate near the source. Examples include grain milling, animal and seafood processing, and winemaking. Once processed, the intermediate products can be shipped elsewhere for consumption or as ingredients in higher valueadded products. Firms can locate these facilities closer to consumers. Bakeries, snack food manufacturers, and beverage plants are examples of providers that locate in major markets. These differences mean some food-processing activities are more concentrated than others. This, in turn, influences the talent and facilities needed in each local market.
The importance of food makes it highly political. Because of the health risks that accompany improperly processed food, the industry is heavily regulated. Federal farm legislation, in the form of price supports and other incentives, influences the costs faced by food manufacturers.
In addition, food is a matter of national security, grouped with other sectors such as pharmaceuticals and semiconductors as having critical strategic importance. The COVID pandemic demonstrated the risks from the failure in food supply chains.
And, of course, food manufacturing is strongly influenced by consumer preferences. Food is intimately associated with culture, health, and lifestyle, so manufacturers must deal with changing interests and tastes. Important examples include attitudes on environmental stewardship, farm worker and animal welfare, or genetically modified crops and animals. Markets are impacted by growing cultural diversity and interest in cooking and new cuisines.
Measuring Industry Growth
Food manufacturing may be assessed in several ways, including by payroll employment, business establishments, and capital investment. Nationally in 2023, 2.1 million people worked in food and beverage manufacturing, accounting for 16 percent of all manufacturing jobs. The nearly 130,000 Texas food and beverage jobs account for a smaller share of state manufacturing jobs (13 percent).
After a period of flat employment, food manufacturing has grown dramatically. Except for a temporary reverse during the COVID pandemic, the industry has been on an upward trend since 2014. Texas employment
outpaced the nation with over double the national increase in the last five years (15 percent versus 6 percent, respectively).
In the last five years, food and beverage manufacturing employment also exceeded the change in overall employment. Nationally, employment grew by 4.9 percent while food and beverage employment grew by 7.9 percent. In Texas, the five-year increase in food and beverage was 14.9 percent compared with total job growth of 11.5 percent.
In Texas, most food jobs are in three subsectors: animal processing, beverages, and bakeries and tortilla manufacturing (Figure 1). Almost 43,000 Texans work in animal slaughtering and processing. Nearly 22,000 bake, and an additional 20,000 produce beverages.
Five-year growth in the subsectors range from an 8 percent job loss in seafood processing to a whopping 42 percent increase in the “other food” category (Figure 2). Beverage employment growth came in at a strong 26 percent. Most sectors in Texas have been adding jobs faster than the overall Texas economy. Seafood, grain and oilseed milling, and dairy products were the only sectors that didn’t see rapid growth.
16 TG SPRING 2024
Figure 1. Food and Beverage Manufacturing Jobs by Sector
Source: Texas Real Estate Research Center analysis of U.S. Bureau of Labor Statistics data
Food and Beverage Subsector
Seafood Preparation and Packaging
Dairy Products
Grain and Oilseed Milling
U.S. Total
U.S. Food
Texas Total Animal Processing
Sugar and Confectionery Products
Bakeries and Tortillas
Texas Food
Animal Food
Fruit/ Vegetable Preserving and Specialty Foods
Beverage Manufacturing
Other Food
Business establishments are another helpful way to measure the industry. The federal government collects data annually on establishments that are defined as a stand-alone business operation. Tracking establishments helps assess real estate demand since, just as households are the demographic unit that occupies a residence, establishments are the economic unit that occupies commercial space.
Across the U.S., the five-year change in all industries, total manufacturing, and food-and-beveragemanufacturing establishments was 5,
-2.9, and 15.9 percent, respectively, according to the most recently available data, which were from 2021. In Texas, the comparable changes were all positive and higher than their national counterparts at 10.2, 3.8, and 23.5 percent, respectively.
Food and beverage manufacturing has seen robust growth, beating overall manufacturing by nearly 20 percent at the state and national levels.
Industry Investment Rising
In the five years ending in 2022, food-manufacturing firms made almost $350 billion in investments in
productive assets (facilities, equipment, etc.) Over those five years, the annual level of investment increased by 39 percent, exceeding the 27 percent change in investment for manufacturing overall. Investment in foodmanufacturing structures (excluding equipment) grew even faster than the total capital investment rate. Over five years, food and beverage was up 70 percent, compared with a 57 percent increase in overall manufacturing.
Investment in specialized food processing and refrigerated space has also grown. In Texas, 4.4 million square feet of such space was added in the last two and a half years according to Costar. This space had a 7.7 percent vacancy rate and saw rents at $8.25 in 4Q2023. Rent rates were in the double digits in the waning quarters of the pandemic.
Texas is indeed a powerhouse food manufacturer, ranking second among states in most food subsectors. However, Texas does not have an exceptionally high concentration of food manufacturing. The location quotient for most subsectors is less than the national average of 1.00. Some of these deficits are from a lack of crops or animals locally, but there are opportunities to expand some subsectors. Secondary and higher value-added products such as animal food, confections, and other

BAKERIES AND TORTILLA FACTORIES are big business in Texas. They provide more than 21,600 jobs, making them the second-biggest source of jobs in the state’s food and beverage manufacturing sector.


TG SPRING 2024 17
–7.9% 3.5% 3.9% 5.2% 6.3% 11.7% 11.8% 12.2% 14.4% 15.4% 19.3% 19.4% 26.1% 41.8%
Figure 2. Five-Year Employment Change by
Source: Texas Real Estate Research Center analysis of U.S. Bureau of Labor Statistics data
Food Manufacturing Industry Concentration by MSA
Note: Food LQ = (local food and beverage establishments/total local establishments)/ (U.S. food and beverage establishments/total U.S. establishments. A Food LQ of 1.00 means the industry is at the same concentration as it is nationally. Less/ greater than 1.00 means it is at a lower/higher than average concentration.
Source: TRERC analysis of U.S. Census Bureau County Business Patterns data
foods and beverages can be made almost anywhere. These all have lower-than-average concentrations in the state.
Food Manufacturing Across Texas Metros
Food manufacturing plays a role in every Texas metro’s economy, and a substantial one in some. The larger markets host the most establishments. The Metroplex is home to 24 percent of all establishments, followed by Houston (20 percent), Austin (11 percent), and San Antonio (8 percent).
When considering the concentration of establishments, a different picture emerges. Food and beverage manufacturing is most heavily concentrated in San Angelo, Waco, Sherman, and the two Rio Grande Valley metro areas
of McAllen and Brownsville (see map and table). Of the Big Four metros, only Austin has a higher-than-average concentration, at a modest 1.02. This means the industry is underrepresented in many Texas cities. These deficits represent important economic development opportunities, especially with Texas’ rapid growth.
Hungry for Growth
Food and beverage manufacturing is an important and growing industry with much more potential for the Texas economy. Continued population growth will no doubt motivate more investment by this industry in the state. Those
For
businesses will need specialized spaces and workers with specific skills.
Real estate and workforce stakeholder support will be needed to boost the industry. Any enhancements to Texas’ agricultural sectors, including farms, fisheries, orchards, and ranches, can only help attract more interest.

Daniel Oney, Ph.D. (doney@tamu.edu)

this, read
18 TG SPRING 2024
is research director with the Texas Real Estate Research Center. Number of Food and Beverage Manufacturing Establishments by Texas MSA Abilene 21 Amarillo 32 Austin-Round Rock 311 Beaumont-Port Arthur 20 Brownsville-Harlingen 40 College Station-Bryan 18 Corpus Christi 30 Dallas-Fort Worth-Arlington 661 El Paso 80 Houston-The Woodlands-Sugar Land 554 Killeen-Temple 25 Laredo 18 Longview 16 Lubbock 30 McAllen-Edinburg-Mission 81 Midland 10 Odessa 13 San Angelo 22 San Antonio-New Braunfels 224 Sherman-Denison 17 Texarkana 7 Tyler 28 Victoria 10 Waco 40 Wichita Falls 7 Texas 2,782 Note: The Texas total includes 467 establishments not located in an MSA. Source: TRERC analysis of U.S. Census Bureau County Business Patterns data 0 - 0.49 0.5 - 0.74 0.75 - 0.99 Texas MSA Food LQ 1.00 - 1.24 1.25+
more on
the full article on the Texas Real Estate Research Center’s website by scanning the QR code.
Keeping It Clean Texas Property Assessed Clean Energy Act
By Harold D. Hunt By Harold D. Hunt


Key Takeaways
• The Property Assessed Clean Energy Act (PACE) makes it feasible for commercial property owners to install energy efficiency and water conservation upgrades.
• Improvements must be permanently fixed to commercial property.
• Local governments can choose to offer PACE in specific geographic areas.
• Helps create more jobs in manufacturing, construction, and service sectors.
Financial barriers have discouraged many commercial building owners in Texas from investing in energy efficiency and water conservation upgrades. Structures in Texas account for approximately 70 percent of electricity use and 40 percent of total energy use according to the state comptroller. The Texas Property Assessed Clean Energy (PACE) Act was designed to address those barriers by making such investments financially feasible.
Ten years have passed since the PACE Act was adopted by the Texas Legislature and signed by thengovernor Rick Perry. Low interest rates and the pandemic initially hindered the program’s popularity. However, today’s higher interest rate environment has worked in the program’s favor.
What is the PACE Program?
The PACE program enables owners of commercial and industrial properties to obtain low-cost, long-term loans targeted at reducing energy and water consumption. Loans can be up
to 100 percent of all costs associated with the design and installation of the upgrades, up to a maximum of 25 percent of the property’s as-complete market value. Loans can cover labor and material costs expended during the installation or modification of improvements, permit fees, inspection fees, lender’s fees, program application and administrative fees, project development and engineering fees, independent third-party reviewer (ITPR) fees, and any other fees or costs incurred during the installation process.
State law enables but does not require cities and counties to offer a PACE program. If a local government chooses to offer PACE, the governing body is required to designate the specific geographic area (the “region”) where PACE assessments can be placed. Regional PACE programs can make it easier for rural counties and smaller local governments to offer PACE financing.
Participating properties must be inside the jurisdiction of a city or
TG SPRING 2024 19 COMMERCIAL
county PACE program. Property owners interested in participating can contact local county or city officials to determine whether a PACE program is in place. If not, scan the QR code for information on creating one.
Another helpful website is Texaspaceauthority.org (QR code). The site lists PACE lenders, PACE contractors, a map of 94 local or county governments with a PACE program in Texas, and a list of projects completed since inception. Contractors and engineers familiar with the PACE program are listed along with the maximum and minimum amounts lenders will fund and where they are located. Capital stack examples and case studies of completed projects are also available.
Program Benefits
The program offers commercial property owners a number of benefits.
Retrofits or new construction upgrades financed using the PACE program are designed to generate positive cash flow to property owners. The quality and efficiency of a region’s building stock is improved while helping to create more jobs in the manufacturing, construction, and service sectors. PACE can also put underused properties back on the tax rolls.
Finally, PACE projects qualify for any additional rebates and incentives offered by governments, utility providers, or manufacturers.
How Financing Works
PACE loans are secured by annual property assessments and are automatically transferred to successive property owners in a sale.
The PACE Act authorizes two sources for financing PACE assessments that are secured by a property lien: third-party financing (private

lenders) and public financing (bonds). Although local governments have the option to issue bonds for PACE financing, none in Texas have chosen to do so. Private funding minimizes local government risk associated with PACE projects.
Each property owner pays only the portion of an assessment that accumulates during their ownership. Thus far, Texas has had minimal experience with transfers. Assessments can also be passed through to tenants in commercial lease agreements.
Local government enforcement is nonrecourse and limited to pastdue installments and related penalties. Any assessments in arrears are also subject to the enforcement terms in the underlying loan agreement enforceable by the lender under contract law. However, any installments that have not yet come due are not eligible for debt collection.
A PACE lien is a first lien against the property and has the same priority status as a lien for ad valorem
taxes. The senior lien status of PACE assessments reduces the risk of nonpayment, making PACE loans more secure and attractive to lenders.
Lenders also benefit from PACE financing because the property is protected from income losses and valuation declines resulting from deferred maintenance.
“Deferred maintenance is the last untapped economy in Texas,” said Charlene Heydinger, president of Texas PACE Authority (TPA) and a third-party administrator. “If we can help companies deal with deferred maintenance, think of the jobs that would be created.”
“PACE loans secured by a tax assessment lien are a very safe investment. But a major hurdle to doing a PACE loan is always going to be getting the senior lender on board,” said PACE lender Sean Ribble, Senior Director of Originations for Nuveen Green Capital. “Banks may be wary of PACE at first, but they also want to do business with commercial property
20 TG SPRING 2024
THIS LITHIUM BROMIDE ABSORPTION HEAT PUMP, which recovers waste heat to produce useful hot water for heating and industrial processes, is the kind of energy-saving technology PACE is intended to help finance.

owners. By adding a PACE loan to the capital stack, a bank can keep dry powder on the credit side by lowering their loan amount while still fostering a relationship with the property owner.”
When a pre-existing mortgage lien on a property is in place, that mortgagee must be given written notice of the owner’s intention to participate in the PACE program at least 30 days before entering into a PACE contract. Furthermore, the pre-existing mortgagee must give written consent to participation in the PACE program.
The lien takes effect when it is recorded in the property records and runs until the assessment, interest, and any penalty are paid in full. Any unpaid portion transfers to a new owner in a sale and is not eliminated by foreclosure.
Delinquent installments of the assessments incur the same interest and penalties as delinquent property taxes. A local government may recover costs and expenses, including attorney’s fees, to collect any
For information on how local governments can establish a PACE program in their regions, read Hunt’s complete article online by scanning the QR code.
delinquencies just like a suit to collect unpaid property taxes.
Positive cash flows to the property owner are achieved immediately because cost savings must exceed the PACE assessment to qualify. Improvement costs are amortized over their useful life. However, the term of the PACE financing agreement cannot exceed the useful life of the upgrades.
“PACE is a great program, but 25to 30-year fixed rate loans are traditionally a better fit for the institutional sector,” said Ribble. “There is a duration risk for traditional lenders paying short-term rates to depositors that can change quickly while being tied to long-term, fixed-rate loan revenues. PACE loans are a much better match and a great source of revenue for life insurance companies and pension funds. Those groups are also being asked to show some percentage of a green component in their investment portfolios. PACE fits that requirement nicely.”
The PACE Act permits PACE assessments to be placed on privately owned commercial real property (including not-for-profit real property), privately owned industrial real property or privately owned residential real property consisting of five or more dwelling units. The act specifically excludes “undeveloped” lots and any government-owned real property.
“If the local central appraisal district (CAD) determines that a property is improved under the property tax code, it is considered developed for purposes of the PACE Act,” said Heydinger.
The Act authorizes PACE funding for the installation of “qualified” improvements. Qualified improvements must be permanently fixed to the real property and decrease water and/or energy consumption. This includes renewables and products or devices on the customer’s side of the meter
that use energy-related technology to generate electricity, provide thermal energy, or regulate temperature.
Multiple energy and/or water saving measures may be installed. The useful life of a project implementing multiple upgrades is calculated using a weighted average. As with single upgrades, the weighted average must be longer than the assessment term.
Property owners must demonstrate the financial ability to pay PACE assessments. Participants must verify that they are the legal property owner, are current on mortgage and tax payments, are not insolvent or bankrupt, and hold clean title to the property.
Getting the Word Out
“The biggest challenge we face with the PACE program is visibility,” said Heydinger. “Unfortunately, few people in Texas know about it. We try to get in front of every chamber of commerce, economic development council, commercial property trade organization, and real estate council to educate them. Property owners and managers are another group. But the group TPA really needs to get in front of is commercial brokers who are helping put the capital stacks together for financing. My ultimate goal is to help make PACE boring. After everyone uses it and trusts it, PACE will hopefully become an integral part of financing for commercial properties in Texas.”
“Hopefully, the PACE program will continue to grow,” says Glenn Silva, Chief Operating Officer of Lone Star PACE and a PACE program administrator. “Texas is seeing significant in-migration from around the country, and those folks aren’t bringing any extra water or energy with them.”
 Harold D. Hunt, Ph.D. (hhunt@tamu.edu)
is a research economist with the Texas Real Estate Research Center.
TG SPRING 2024 21


 By
By

2024 Texas Real Estate Forecast

Key Macro Drivers

the TRERC Research Team


Our 2024 Texas Real Estate Forecast introduced an innovative approach to how TRERC evaluates projections for the real estate economy in Texas. The TRERC research teams, giving the most weight to macro drivers at a statewide level, assumed market behaviors would fluctuate before year-end. After one quarter, those drivers did change, triggering necessary revisions to help connect the dots for contingency planning across the state. The team consensus, using both quantitative and qualitative methods to reset the forecast, is reflected here. To look back at our original forecast, please use the QR code.


West
Continued legal political division brings risks over spending and debt policy. Risks from many global conflicts are relatively high.
Legal changes expected


24 TG SPRING 2024
Original Winter 2024 Revised Spring 2024 How it changed ECONOMIC OUTPUT JOBS INTEREST RATES LEGAL & GEOPOLITICAL INFLATION ENERGY PRICES INCOME SPENDING POPULATION
2024 T EXASREALESTATEFORECAS T U.S. 1% to 1.5% U.S. 0.8% to 1% Federal Reserve Fed Funds Target Range 4.5% to 5.5% Consumer Price Index 2% to 3% West Texas Intermediate $80 to $100, ending 2024 at $90 TX 2% to 2.5% TX 1.1% to 2.7% TX 2.7% to 3.8% (nominal) U.S. 2% to 4% (nominal) 1% to 2% Henry Hub Natural Gas Prices $2.75 to $3.75, ending 2024 at $3.50 Producer Price Index 1% to 2% 30-Year FMR 6% to 8%
U.S. 1.9% to 2.9% U.S. 1% to 2% 30-Year FMR 6% to 7.5%
TX 2.9% to 3.9% TX 2% to 3% Consumer Price Index 2% to 3%
Texas Intermediate $80 to $100, ending 2024 at $90 TX 2.7% to 3.8% (nominal) U.S. 2% to 4% (nominal) 1% to 2%
Hub Natural Gas Prices $2.75 to $3.75, ending 2024 at $3.50 Producer Price Index 1% to 2% * Federal Reserve Fed Funds Target Range 4.5% to 5.5% UPDATE
Henry


Projections


Why it changed

Single-Family Housing
Deliveries
Prices
Sales
Rent
Multifamily Housing
Deliveries
Rent

LAND COMMERCIAL RESIDENTIAL
Rural Land Market
Sales
Prices

Office Space
Deliveries
Net Absorption
Rent
Retail Space
Deliveries
Net Absorption
Rent
Industrial Space
Deliveries
Stable pipeline this year.
Prices flat to potentially higher by year-end.
Sales could see a small increase over 2023.
Single-family rents flat to slightly positive.
Few new starts this year.
Rent increases are less than originally projected on strong deliveries.
Seeing smaller declines and expecting some increases in the second half of the year.
Overall statewide prices are still expected to be lower year over year.
Considerable uncertainty remains over the ultimate back-to-the-office equilibrium. Distress will continue, but macro trends signal no significant departure from the winter forecast.
Retail occupancy and rent growth have remained strong. There are some concerns over a consumer slowdown, but there is insufficient evidence to soften the winter forecast.


Net Absorption
Rent
LEGAL


*
The Supreme Court is expected to rule soon on two consolidated cases, LoperBrightEnters.v.Raimondo and Relentless,Inc.v.U.S. Dept.ofCommerce. Under current law, when courts review agency rules, they often defer to administrative interpretations under a policy known as Chevron deference. A decision that narrows
Big-box leasing has cooled, but small— especially infill—properties remain in high demand. Fundamentals remain as projected in the winter forecast.
or overrules Chevron could bring about significant changes in judicial review of agency rules, because a large portion of federal law is not made by Congress, but by rulemaking authority delegated to federal administrative agencies.


Original Winter 2024 Revised Spring 2024
Unchanged Decrease Flat Increase Key:
Not-So-Obvious Real Estate Investment Tax Strategies
By William D. Elliott

Key Takeaways
• Convert separate property into community property.
• Retitle community property into each spouse’s name.
• Gift tax applies to the transfer of asset value from one generation to another.
Some tax strategies for real estate investors are so common and so elementary that they are often overlooked. However, they are no less effective. Here are a few.
Converting Separate Property into Community Property
Texas is a community property state. The idea behind community property is that the family is a basic, single social unit. Each spouse with community property owns an undivided one-half share of the marital assets. This includes assets acquired during marriage, no matter whose name is on the deed or title.
Exceptions to the community property rule are for gifts to or inherited by a spouse or assets acquired before marriage. These are separate property, not community property. With separate property, title matters. The person whose name is on the deed or account statement owns separate property.
Many people are moving to Texas, and they usually bring with them separate property from their former locations (unless they moved from one of the few other community property states). If they start acquiring Texas assets, such as a home, they’ll own a mix of separate and community property. Very few think about what to
26 TG SPRING 2024 TAXES
do with their mixed separate and community property. The obvious strategy is to convert separate property into community property.
One distinct tax advantage of community property is the double step-up in basis.
Under federal income tax law, IRC § 1014(b)(6), all community property (including both the decedent’s onehalf interest in the community property and the surviving spouse’s one-half interest in the community property) receives a new basis equal to its fair market value on the death of the first spouse. When a spouse dies, the cost basis for both community onehalf interests is stepped-up, and the assets may be sold by the surviving spouse without recognizing a capital gain. This tremendous tax benefit is unavailable for separate property. The conversion, which is handled by written agreement, is reasonably simple. If it is such a great strategy, why don’t more people use it? There are several reasons:
• Inertia.
• Being uninformed.
• The possibility of divorce.
In a divorce, generally speaking, separate property is off limits in the division of property. If a spouse owning separate property doubts the marriage will last, self-interest dictates keeping separate property separate.
Retitling Community Property into Each Spouse’s Name
Valuation advantage is another benefit of converting separate property into community property. Not only should those with a net worth over $27 million (using 2024 exemption amounts) consider converting separate property to community property, they should title the community one-half interests in each spouse’s name.
Example 1: A husband and wife own 1,000 shares of stock in Widget Co. as community property. The stock is re-issued with 500 shares in the husband’s name and 500 in the wife’s name.
In that example, the stock remains community property whether titled to one or both spouses. Having both spouses’ names on the deed, title, or account statement creates an opportunity for valuation discounting, because neither spouse owns a majority of the corporate stock. Therefore, an appraiser of the corporation will consider a non-control discount. This type of discount could range up to 15 or even 20 percent.

Example 2: A husband and wife own 1,000 shares in Widget Co. but the shares are titled in the husband’s name. The company is valued at $1 million. On the husband’s or wife’s death, each of their taxable estate value is $500,000.
Example 3: Same facts as example 2, except the husband and wife each own 500 shares and have separate stock certificates. If the husband or wife dies, the value of his/her half is potentially subject to a 20 percent valuation non-majority control discount (meaning the taxable estate value would be $400,000, not $500,000).
With this very slight change in ownership, the couple takes advantage of a valuation discount.
Gifting An Investment Opportunity

Real estate investors who have accumulated a portfolio often give a great deal of thought to how to transfer some of the parents’ wealth to children or grandchildren with the least gift tax. Common strategies focus on minimizing taxable value of the properties through family partnerships and trusts. At the heart of these strategies is the reality that the gift tax applies to the transfer of asset values from one generation to another.
The gift tax is imposed when one individual transfers property to another while receiving nothing, or
less than full value, in return. This defi nition encompasses numerous gifts that may not initially appear to signifi cantly affect gift tax reporting. In 2023, each taxpayer had a $12.92 million lifetime exemption available to use during life or at death to transfer assets tax-free to others. That exemption increased to $13.61 million in 2024. Many are concerned that the exemption amount is scheduled to drop on Jan. 1, 2026, to about $7 million, indexed for infl ation. In addition to the lifetime exemption, annual gifts worth $17,000 or less per donee (person who receives a gift) in 2023 ($34,000 if splitting gifts with a spouse) are excluded from the available lifetime exemption.
Consider the following examples:

Example 4A: A parent buys some real property and gifts the property to a trust for the child. A gift tax will be imposed on the value of the real property, which would presumably be the recent purchase price.
Example 4B: Rather than purchasing the real property herself, the parent uses an existing trust for the child to purchase the property. Since existing money in the child’s trust was used, no gift tax should be imposed. There was no gift to the child. The parent only gave the child an opportunity.
Each of these strategies contains details and nuances not addressed in this article, and each requires careful planning. Before making any financial decisions, consult an attorney or a tax professional.

RESEARCH


William Elliott (bill@wdelliottlaw. com) is a research fellow with the Texas Real Estate Research Center and a Dallas tax attorney, Board Certified, Tax Law; Board Certified, Estate Planning & Probate; Texas Board of Legal Specialization; and Fellow American College of Tax Counsel.
TG SPRING 2024 27
FELLOW


Q& QA


Third-Party Financing Addendum-Lender Approval
By Kerri Lewis and Avis Wukasch
What if the lender-required repairs under Paragraph 7E of the One-to-Four Residential Contract do not exceed 5 percent, the option period has passed, and the buyer or seller can’t or won’t make the repairs?
If neither the buyer nor seller will make lender-required repairs that are less than 5 percent, the lender has a choice. If the lender decides to waive the repairs and make the loan anyway, the buyer does not have an out to get the earnest money back. However, if the lender refuses to make the loan without the required repairs, the lender can send the buyer a letter stating that the property does not meet the lender’s property underwriting requirements. If the Third-Party Financing Addendum was attached to the contract, the buyer could terminate the contract (at least three days before closing) and get a return of the earnest money.
QThe buyer and I just received notice that the property did not appraise. We are five days away from closing. What do we do?
A A
The buyer should inform you of their choice in this matter. The buyer may have other resources for closing this property that can be used, or the buyer may wish to terminate the transaction. If the buyer has no other resources, you should quickly prepare TREC Form
39-6, Notice of Buyer’s Termination of Contract, filling out Paragraph 3 and sending this form to the listing agent/ broker with a copy of the lender’s letter setting out the reasons for denial of the loan. This must be done no later than three days before closing for the buyer to meet her obligations under the Third-Party Financing Addendum to receive a refund of the earnest money.
What the Law Says
The contract is a binding agreement between the parties to the transaction. All terms of the parties’ agreement for the transaction should be reflected in the contract or addenda. Paragraph 2B of the Third-Party Financing.Addendum allows for termination of the contract and return of earnest money if the property does not satisfy the lender’s underwriting requirements (including appraised value and required lender repairs) if the buyer sends the seller a termination notice and a copy of the lender’s denial letter no later than three days before closing. Time is of the essence in Paragraph 2B, so the notice must be given within the time set out in the contract.
For Example
The closing of the contract is scheduled for May 15th. On May 10th the lender notifies the buyer that the loan cannot be made because the property did not appraise high enough. The buyer has no other resources to
buy down the loan or otherwise close on the property, but spends a few days looking around for options. The buyer sends the notice of termination to the seller on May 13th. This is too late. The buyer will not be entitled to the return of the earnest money under the terms of the Third-Party Financing Addendum. The way to count is to start with the closing date of May 15th as day zero and count back three days, which would be May 12th.
Best Practice
Brokers and agents representing buyers need to understand the time frames in the contract and all the addenda. The buyer approval in Paragraph 2A of the Third-Party Financing Addendum has a set negotiated timeframe for completion, while the property approval in Paragraph 2B of the Third-Party Financing Addendum can occur anytime. If the buyer wants to terminate the contract and receive a return of the earnest money, the buyer must receive a denial letter from the lender and send it to the seller no later than three days before closing. Best practice is to have a system to help remember key dates for the contract and associated addenda.
Kerri Lewis, J.D. (kerrilewis13@ gmail.com) is a member of the State Bar of Texas and former general counsel for the Texas Real Estate Commission (TREC). Avis Wukasch (avis@2oldchicks.com) is a broker and former TREC chair. Both are research fellows with the Texas Real Estate Research Center.


Nothing in this publication should be construed as legal advice for a particular situation.
28 TG SPRING 2024
RESEARCH
FELLOW
Brokerage


delivered to you quarterly TEXAS BORDER ECONOMY @recentertx our Texas economic overview OUTLOOK FOR THE TEXAS ECONOMY TECHNICAL REPORT OCTOBER 2023 DATA 2046 Outlook for the Texas Economy JOSHUA ROBERSON LEAD DATA ANALYST KOBY McMEANS RESEARCH INTERN Texas Real Estate Research Center up-to-the-minute news NEWSTALK TEXAS www.recenter.tamu.edu VISIT US ONLINE AT Helping Texans make the best real estate decisions since 1971. free email newsletter RECON stay on top of Texas housing TEXAS HOUSING INSIGHT TECHNICAL REPORT OCTOBER 2023 DATA 2120 RESEARCH INTERN KOBY McMEANS LEAD DATA ANALYST JOSHUA ROBERSON TEXAS HOUSING INSIGHT our informed projections for 2024 2024 TEXAS REAL ESTATE FORECAST 2024 T EXASREALESTATEFORECAS T 2024 Texas Real Estate Forecast statewide small rural land sales TEXAS SMALL RURAL LAND TR TECHNICAL REPORT SEPTEMBER 2023 2391 TEXAS A&M UNIVERSITY Texas Real Estate Research Center Lynn Krebs Research Economist Texas Small Rural Land
