
1 minute read
ArcGIS Software


Studyofenvironmentalfactorsandgreeninfrastructureontheheat islandeffectandheatvulnerabilityindexinSouthwestofCityChicago
In order to evaluate community-level vulnerability to pollution across Chicago, I used the methodology of the CalEnviroScreen 3.0. By using different data sources including CMAP and projecting them on ArcGIS, I was able to find out following patterns:
Advertisement
Communities with low socioeconomic status and high rates of chronic health conditions are especially vulnerable to the impacts of air pollution
In Chicago, with its history of segregation and disinvestment in Black and Latinx communities, the differences between neighborhoods are stark
Some communities have rates of poverty, cardiovascular disease, and chronic obstructive pulmonary disease (COPD) that are ten times greater than others.
Structural racism and economic hardships contribute to this gap.
Adobe Suite
The Geospatial Analysis and Visualization (GSAV) course helped me to develop skills in the spatial analysis and visualization of data, including development of maps and models that can communicate complex information. In this course, a project was assigned individually to develop the East Side Site Plan of UIC based on the original master plan developed by Booth Hanson. With the help of Adobe Illustrator and Google Earth Software, I was able to recreate a site plan which allowed me to visually convey the development within the built environment of UIC east campus.

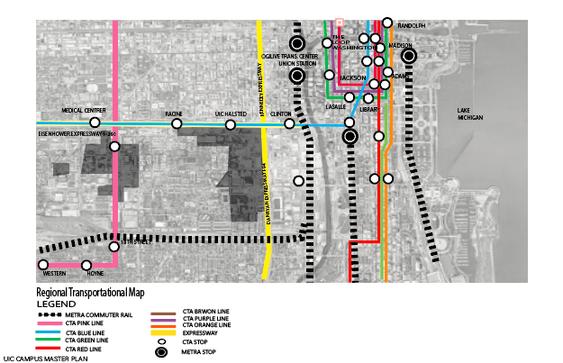
With the help of Google Earth Software and Adobe Illustrator, I created a Regional Transportation Map of Chicago outlining the routes of CTA trains by specifically focusing the downtown and UIC East Campus..
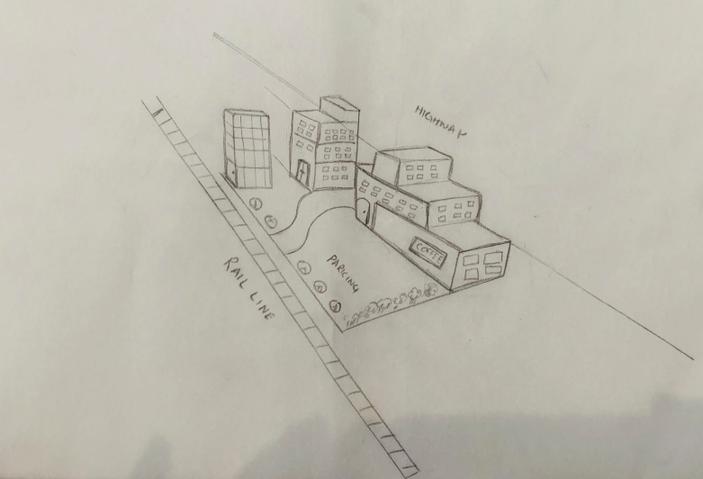
In this exercise, we were split into groups and given blocks to come up with a site plan on a designated actual public space. The main idea behind this exercise was not only to come up with a two-point perspective of the site plan but also to incorporate the principles of equity and sustainability which foster the Transit-oriented Development (TOD). Each student even in the same group came up with his/her version of mixedused development.
In the sketch shown above, I came up with the kind of mixed-use development which has commercial activity on the ground floor and affordable housing on the above. Moreover, this site plan also left space for a parking lot between the dwelling units and the rail line so that people living in the buildings are not bothered by noise pollution. Another thing to counter this issue was to have plants at the boundaries of this development.
InDesign Cut Sheets Project & Poster
Design (front)

InDesign Cut Sheets Project & Poster
Design (back)
preventhomelessnessthrough financialassistanceto householdsfacingeviction


