QUEENS CHRONICLE, Thursday, January 30, 2020 Page 4
j US CENSUS
2020
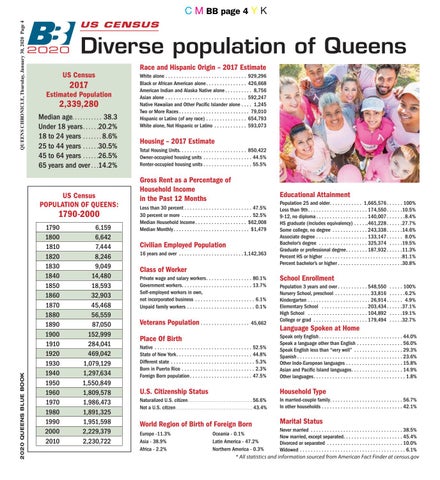
Diverse population of Queens Race and Hispanic Origin – 2017 Estimate
US Census
2017 Estimated Population
2,339,280 Median age. . . . . . . . . . . 38.3 Under 18 years . . . . . .20.2% 18 to 24 years . . . . . . . 8.6% 25 to 44 years . . . . . .30.5% 45 to 64 years . . . . . .26.5% 65 years and over . . .14.2%
US Census POPULATION OF QUEENS:
1790-2000
2020 QUEENS BLUE BOOK
C M BB page 4 Y K
1790 1800 1810 1820 1830 1840 1850 1860 1870 1880 1890 1900 1910 1920 1930 1940 1950 1960 1970 1980 1990 2000 2010
6,159 6,642 7,444 8,246 9,049 14,480 18,593 32,903 45,468 56,559 87,050 152,999 284,041 469,042 1,079,129 1,297,634 1,550,849 1,809,578 1,986,473 1,891,325 1,951,598 2,229,379 2,230,722
White alone . . . . . . . . . . . . . . . . . . . . . . . . . . . . . . 929,296 Black or African American alone . . . . . . . . . . . . . . . 426,668 American Indian and Alaska Native alone . . . . . . . . . . 8,756 Asian alone . . . . . . . . . . . . . . . . . . . . . . . . . . . . . . 592,247 Native Hawaiian and Other Pacific Islander alone . . . . 1,245 Two or More Races . . . . . . . . . . . . . . . . . . . . . . . . . . 79,010 Hispanic or Latino (of any race) . . . . . . . . . . . . . . . 654,793 White alone, Not Hispanic or Latino . . . . . . . . . . . . 593,073
Housing – 2017 Estimate Total Housing Units. . . . . . . . . . . . . . . . . . . . . . . . . 850,422 Owner-occupied housing units . . . . . . . . . . . . . . . . . . 44.5% Renter-occupied housing units . . . . . . . . . . . . . . . . . . 55.5%
Gross Rent as a Percentage of Household Income in the Past 12 Months
Educational Attainment
Less than 30 percent . . . . . . . . . . . . . . . . . . . . . . . . . 47.5% 30 percent or more . . . . . . . . . . . . . . . . . . . . . . . . . . 52.5% Median Household Income . . . . . . . . . . . . . . . . . . . $62,008 Median Monthly . . . . . . . . . . . . . . . . . . . . . . . . . . . . $1,479
Civilian Employed Population 16 years and over . . . . . . . . . . . . . . . . . . . . . . . . 1,142,363
Population 25 and older. . . . . . . . . . . . 1,665,576 . . . . . . 100% Less than 9th . . . . . . . . . . . . . . . . . . . . . . 174,550 . . . . . .10.5% 9-12, no diploma . . . . . . . . . . . . . . . . . . . 140,007 . . . . . . .8.4% HS graduate (includes equivalency) . . . . ..461,228 . . . . . .27.7% Some college, no degree . . . . . . . . . . . . . 243,338 . . . . . .14.6% Associate degree . . . . . . . . . . . . . . . . . . . 133,147 . . . . . . 8.0% Bachelor’s degree . . . . . . . . . . . . . . . . . . 325,374 . . . . .19.5% Graduate or professional degree. . . . . . . . 187,932 . . . . . .11.3% Percent HS or higher . . . . . . . . . . . . . . . . . . . . . . . . . . . . .81.1% Percent bachelor’s or higher . . . . . . . . . . . . . . . . . . . . . . . .30.8%
Class of Worker Private wage and salary workers. . . . . . . . . . . . . . . . . 80.1% Government workers. . . . . . . . . . . . . . . . . . . . . . . . . . 13.7% Self-employed workers in own, not incorporated business . . . . . . . . . . . . . . . . . . . . . . 6.1% Unpaid family workers . . . . . . . . . . . . . . . . . . . . . . . . . 0.1%
Veterans Population . . . . . . . . . . . . . . . . . .
45,662
School Enrollment Population 3 years and over . . . . . . . . . . . 548,550 . . . . . 100% Nursery School, preschool . . . . . . . . . . . . . 33,816 . . . . . .6.2% Kindergarten . . . . . . . . . . . . . . . . . . . . . . . 26,914 . . . . . . 4.9% Elementary School . . . . . . . . . . . . . . . . . 203,434 . . . . . .37.1% High School . . . . . . . . . . . . . . . . . . . . . . 104,892 . . . . .19.1% College or grad . . . . . . . . . . . . . . . . . . . . 179,494 . . . . .32.7%
Language Spoken at Home
Native . . . . . . . . . . . . . . . . . . . . . . . . . . . . . . . . . . . . 52.5% State of New York. . . . . . . . . . . . . . . . . . . . . . . . . . . . 44.8% Different state . . . . . . . . . . . . . . . . . . . . . . . . . . . . . . . 5.3% Born in Puerto Rico . . . . . . . . . . . . . . . . . . . . . . . . . . . 2.3% Foreign Born population . . . . . . . . . . . . . . . . . . . . . . . 47.5%
Speak only English . . . . . . . . . . . . . . . . . . . . . . . . . . . . . . . 44.0% Speak a language other than English . . . . . . . . . . . . . . . . . 56.0% Speak English less than “very well” . . . . . . . . . . . . . . . . . . 29.3% Spanish . . . . . . . . . . . . . . . . . . . . . . . . . . . . . . . . . . . . . . . 23.6% Other Indo-European languages . . . . . . . . . . . . . . . . . . . . . 15.8% Asian and Pacific Island languages. . . . . . . . . . . . . . . . . . . 14.9% Other languages. . . . . . . . . . . . . . . . . . . . . . . . . . . . . . . . . . 1.8%
U.S. Citizenship Status
Household Type
Naturalized U.S. citizen . . . . . . . . . . . . . . . . . . . . . . . . . . . . . . . . . . . . . . . . 56.6% Not a U.S. citizen . . . . . . . . . . . . . . . . . . . . . . . . . . . . . . . . . . . . . . . . . . . . . . . 43.4%
In married-couple family. . . . . . . . . . . . . . . . . . . . . . . . . . . 56.7% In other households . . . . . . . . . . . . . . . . . . . . . . . . . . . . . . 42.1%
World Region of Birth of Foreign Born
Marital Status
Place Of Birth
Europe -11.3% Asia - 38.9% Africa - 2.2%
Never married . . . . . . . . . . . . . . . . . . . . . . . . . . . . . . . . . . 38.5% Oceania - 0.1% Now married, except separated. . . . . . . . . . . . . . . . . . . . . . 45.4% Latin America - 47.2% Divorced or separated . . . . . . . . . . . . . . . . . . . . . . . . . . . . 10.0% Northern America - 0.3% Widowed . . . . . . . . . . . . . . . . . . . . . . . . . . . . . . . . . . . . . . . 6.1% * All statistics and information sourced from American Fact Finder at census.gov