
10 minute read
Environmental Monitoring of Soil and Water from the Wetland Pond on the Prairie View A&M University 90-Acres Property


Abstract Zulfa Eisa and Dr. Richard W. Griffin College of Agriculture and Human Sciences, Cooperative Agricultural Research Center, Prairie View A&M University, Prairie View, TX, 77446
Hypothesis Results and Discussion Conclusions
Soil pH measurements were conducted at 4 selected sites along the perimeter of the wetland pond on the at Prairie View A&M University 90-Acres property. The pH data were analyzed using descriptive and inferential statistics on Microsoft Excel spreadsheets followed by entry of the data into a matrix in order to allow a geographic comparison of the data that could be projected as a pH map of the property. This portion of the project focused on the statistical comparison of the following parameters, by site, monitoring day, and monitoring period: 1) soil pH values; 2) water pH values; and 3) soil and water pH values. The most important results from the comparisons include: 1) during weeks 1-4, the soil pH averages by site ranged from 5.14 (South) to 7.18 (South) and water pH values ranged from 6.74 (North) to 9.41 (North); 2) during weeks 1-4, using a t-test, the soil pH mean (5.84) was statistically lower than the water pH mean (8.01) with a p < 0.005; and 3) the null hypothesis was rejected, because the average soil pH proved to be statistically lower than the average water pH in this wetland pond ecosystem in East Central Texas.
Introduction
The pH (reaction) is a measure of the acidity versus the alkalinity of the soil and water and determines the capacity of that medium to exchange nutrients with plants. As well as affecting the ability of plants to uptake nutrients by both chemical and biological processes, the pH also affects the diversity and species of soil microbes. The pH is measured on a scale of 0 –14 and a pH of 7 indicates neutral conditions, a pH above 7 indicates alkaline conditions and a pH below 7 indicates acidic conditions (Gardiner and Miller, 2008). Soil affects the pH of water when soil and water meet in the riparian buffer, the soil acidity levels interact and combine to influence the adjacent water. Ultimately, the water drains away and the soil assumes a slightly different acidic content. The acidity of the soil is very important, because the acidic or alkaline soil governs the kinds of plants that can grow and how easily roots can extract the necessary nutrients for their survival.
Objectives
The objectives of this research were to: 1) measure the soil and water pH at 4 selected sites along the wetland pond; 2) to compare the pH values within and across the monitoring sites; and 3) determine the geospatial variability of the recorded values by site location using comparative analyses. The null hypothesis was that the soil and water, at each monitoring site, have the same pH values.
Materials and Methods
Oakton PCTSTestr TM 5 –pH setting for this study • Soil Samples • Water Samples • 150 mL Plastic Sample Cups • 500-600 mL Plastic Beaker (Probe Rinse Container) • Deionized Water for Soil Samples • Pasture Stick (distance measurement) • Sharpshooter Shovel for soil sample collection • Sharpie; Pens/Pencils • Data Record Sheets • Stirring Rods (plastic) • Computer (Mac) Methods The soil research project was conducted according to the following referenced methods: pH (3-point Standardization Method) –measured using standard pH buffers (4, 7, and 10) to check probe status, then following standard methodology (Schoeneberger et al., and Soil Survey Staff. 2012); (Soil Science Division Staff, 2017). Soil and water pH measurements were conducted at 4 selected sites along the perimeter of the wetland pond on the Prairie View A&M University 90-Acres property. Site labels were: North, East, South, West. Soil and water pH measurements were collected once per week during 4 weeks with a total of 3 replicates measured at each sampling location.
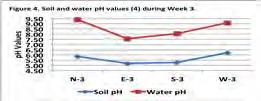
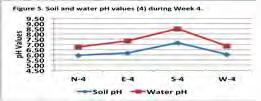
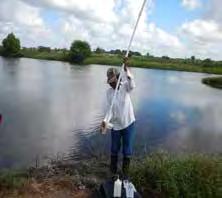
Photo 1. Environmental setting of soil and water pH sampling sites on the 90-Acres property.
In conclusion, the most important points gathered from this research project included: 1) lowest average soil pH was recorded at North site during 50% (2/4 weeks) of monitoring period followed by 25% each at East and South sites; 2) highest average soil pH was recorded at each of South and West sites during 50% (2/4 weeks) of monitoring period; 3) lowest average water pH was recorded at East site during 50% of monitoring period followed by 25% each at North and South sites; 4) highest average water pH was recorded at North site during 75% (3/4 weeks) of monitoring period followed by 25% at South site; 5) statistical analyses (t-tests) indicated that average soil pH was statistically lower than average water pH during entire monitoring period using a p = 0.05; and 6) null hypothesis was rejected, because average soil pH proved to be statistically lower than average water pH in this wetland pond ecosystem in East Central Texas.
Future Studies
Additional project work in the future may continue the monitoring while also collecting data from the larger watershed in order to determine the source of the alkaline materials that are influencing the water pH values in this critical ecosystem.
References
Gardiner, D.T. and R. Miller. 2008. Soils in Environment. 11 th Edition. Pearson Prentice Columbus, Ohio. Schoeneberger, P.J., D.A. Wysocki, E.C. Benham, and Soil Survey Staff. 2012. Field book f or describing and sampling soils, Version 3.0. Natural Resources Conservation Service, National Soil Survey Center, Lincoln, NE. Soil Science Division Staff. 2017. Soil survey manual. C. Ditzler, K. Scheffe, and H.C. Monger (eds.). USDA Handbook 18. Government Printing Office. Washington, D.C.
Acknowledgements
R&I’s Office of Undergraduate Research (OUR and Undergraduate Medical Academy, Prairie View A&M University.
Introduction
The pH (reaction) is a measure of the acidity versus the alkalinity of the soil and water and determines the capacity of that medium to exchange nutrients with plants. As well as affecting the ability of plants to uptake nutrients by both chemical and biological processes, the pH also affects the diversity and species of soil microbes. The pH is measured on a scale of 0 – 14, and a pH of 7 indicates neutral conditions, a pH above 7 indicates alkaline conditions and a pH below 7 indicates acidic conditions (Gardiner and Miller, 2008). The objectives of this research were to 1) measure the soil and water pH at four selected sites along the wetland pond; 2) to compare the pH values within and across the monitoring sites, and 3) determine the geospatial variability of the recorded values by site location using comparative analyses. The null hypothesis was that the soil and water, at each monitoring site, have the same pH values.
Materials and Methods
The materials included: Oakton PCTSTestrTM5 – pH setting for this study; 150 mL Plastic Sample Cups; 500-600 mL; Deionized Water; Sharpshooter Shovel; Sharpie; Pens/ Pencils; Data Record Sheets; Stirring Rods (plastic); and Computer (Mac). The soil research project was conducted according to the following referenced methods: pH (3-point Standardization Method) – measured using standard pH buffers (4, 7, and 10) to check probe status, then following standard methodology (Schoeneberger et al., and Soil Survey Staff. 2012); (Soil Science Division Staff, 2017). Soil and water pH measurements were conducted at four selected sites along the perimeter of the wetland pond on the Prairie View A&M University 90-Acres property. Site labels were: North (N), East (E), South (S), and West (W). Soil and water pH measurements were collected once per week during a 3-week period, with a total of 3 replicates measured at each sampling location. An additional data collection occurred during March 2020.
Results and Discussion
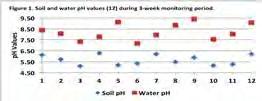
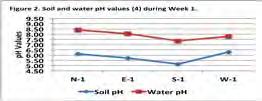
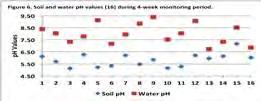
The most essential results gathered from the research project are focused on soil and water pH values collected from sampling sites by week and during the entire monitoring period. As a summary, during weeks 1-3, the soil pH averages by site ranged from 5.14 (S) to 6.29 (W), and water pH values ranged from 7.17 (E) to 9.41 (N). During week 1, the soil pH averages by site ranged from 5.14 (S) to 6.29 (W), and water pH values ranged from 7.36 (S) to 8.41 (N). During week 2, the soil pH averages by site ranged from 5.22 (N) to 6.21 (S), and water pH values ranged from 7.17 (E) to 9.13 (N). During week 3, the soil pH averages by site ranged from 5.17 (E) to 6.23 (W), and water pH values ranged from 7.55 (E) to 9.41 (N). During week 4, the soil pH averages by site ranged from 5.96 (N) to 7.18 (S), and water pH values ranged from 6.74 (N) to 8.52 (S). As a summary, during weeks 1-4, the soil pH averages by site ranged from 5.14 (S) to 7.18 (S), and water pH values ranged from 6.74 (N) to 9.41 (N). Statistical analyses comparing the soil and water pH data using t-tests indicated that during the initial monitoring period (3 weeks), the soil pH mean (5.67) was statistically lower than the water pH mean (8.23) with a p < 0.005. During week 1, the soil pH mean (5.82) was statistically lower than the water pH mean (7.90) with a p < 0.005. During week 2, the soil pH mean (5.57) was statistically lower than the water pH mean (8.27) with a p < 0.005. During week 3, the soil pH mean (5.64) was statistically lower than the water pH mean (8.52) with a 0.01 < p < 0.005. During week 4, the soil pH mean (6.34) was statistically lower than the water pH mean (7.36) with a 0.025 < p < 0.05. As a summary, during weeks 1-4, the soil pH mean (5.84) was statistically lower than the water pH mean (8.01) with a p < 0.005.
Conclusion(s) or Summary
In conclusion, the most important points gathered from this research project included: 1) the lowest average soil pH was recorded at the North site during 50% (2 weeks/ 4 weeks) of the monitoring period followed by 25% each at the East and the South sites, therefore, the soil pH was never lowest at the West site; 2) the highest average soil pH was recorded at each of the South and the West sites during 50% (2 weeks/ 4 weeks) of the monitoring period, therefore the soil pH was never highest at either the North or the East sites; 3) the lowest average water pH was recorded at the East site during 50% of the monitoring period followed by 25% each at the North and the South sites, therefore, the water pH was never lowest at the West site; 4) the highest average water pH was recorded at each of the North site during 75% (3 weeks/ 4 weeks) of the monitoring period followed by 25% at the South site, therefore the water pH was never highest at either the East or the West sites; 5) the statistical analyses (t-tests) indicated that the average soil pH was statistically lower than the average water pH during the entire monitoring period using a p = 0.05; and 6) The null hypothesis was rejected, because the average soil pH proved to be statistically lower than the average water pH in this wetland pond ecosystem in East Central Texas.
References
Gardiner, D.T., and R. Miller. 2008. Soils in Our Environment. 11th Edition. Pearson Prentice Hall. Columbus, Ohio. Schoeneberger, P.J., D.A. Wysocki, E.C. Benham, and Soil Survey Staff. 2012. Field book for describing and sampling soils, Version 3.0. Natural Resources Conservation Service, National Soil Survey Center, Lincoln, NE. United States Department of Agriculture. 2017. Soil Survey Manual. Soil Science Division Staff. Agriculture Handbook No. 18. U.S. Government Printing Office, Washington, DC.
Zulfa Eisa is a senior, majoring in Agriculture with a concentration in Plant and Soil Sciences. Dr. Richard W. Griffin is a Professor of Agriculture with research interests in soils, soil health, ecological based agricultural production systems, and environmental quality.
PRAIRIE VIEW A&M UNIVERSITY RESEARCH & INNOVATION

P.O. Box 519, MS 6000 Wilhelmina Delco Bldg., Suite 120 Prairie View, TX 77446 (936) 261-1570 | www.pvamu.edu/research


