AN END TO THE LEVERAGE-FINANCED GROWTH? The lessons of the ECB’s and other central banks’ decadelong foray into monetary adventurism are best seen not in the anaemic - in growth potential terms - Europe, but in the U.S. which historically leads both monetary and fiscal responses to recessionary threats and economic recoveries. And these lessons are beyond being worrying. In plain factual terms, they are frightening.
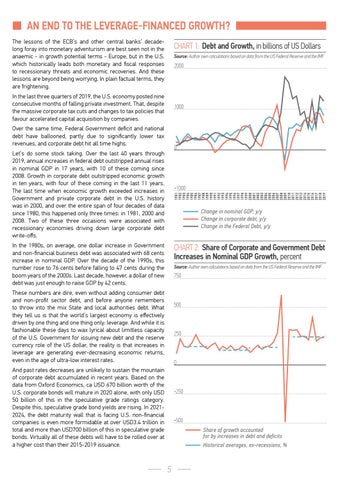
CHART 1: Debt and Growth, in billions of US Dollars Source: Author own calculations based on data from the US Federal Reserve and the IMF
2000
In the last three quarters of 2019, the U.S. economy posted nine consecutive months of falling private investment. That, despite the massive corporate tax cuts and changes to tax policies that favour accelerated capital acquisition by companies.
1000
Over the same time, Federal Government deficit and national debt have ballooned, partly due to significantly lower tax revenues, and corporate debt hit all time highs.
0
Let’s do some stock taking. Over the last 40 years through 2019, annual increases in federal debt outstripped annual rises in nominal GDP in 17 years, with 10 of these coming since 2008. Growth in corporate debt outstripped economic growth in ten years, with four of these coming in the last 11 years. The last time when economic growth exceeded increases in Government and private corporate debt in the U.S. history was in 2000, and over the entire span of four decades of data since 1980, this happened only three times: in 1981, 2000 and 2008. Two of these three occasions were associated with recessionary economies driving down large corporate debt write-offs.
1981 1982 1983 1984 1985 1986 1987 1988 1989 1990 1991 1992 1993 1994 1995 1996 1997 1998 1999 2000 2001 2002 2003 2004 2005 2006 2007 2008 2009 2010 2011 2012 2013 2014 2015 2016 2017 2018 2019
-1000
Change in nominal GDP, y/y Change in corporate debt, y/y Change in the Federal Debt, y/y
In the 1980s, on average, one dollar increase in Government and non-financial business debt was associated with 68 cents increase in nominal GDP. Over the decade of the 1990s, this number rose to 76 cents before falling to 47 cents during the boom years of the 2000s. Last decade, however, a dollar of new debt was just enough to raise GDP by 42 cents.
CHART 2: Share of Corporate and Government Debt Increases in Nominal GDP Growth, percent Source: Author own calculations based on data from the US Federal Reserve and the IMF
750
These numbers are dire, even without adding consumer debt and non-profit sector debt, and before anyone remembers to throw into the mix State and local authorities debt. What they tell us is that the world’s largest economy is effectively driven by one thing and one thing only: leverage. And while it is fashionable these days to wax lyrical about limitless capacity of the U.S. Government for issuing new debt and the reserve currency role of the US dollar, the reality is that increases in leverage are generating ever-decreasing economic returns, even in the age of ultra-low interest rates.
500
250
0
And past rates decreases are unlikely to sustain the mountain of corporate debt accumulated in recent years. Based on the data from Oxford Economics, ca USD 670 billion worth of the U.S. corporate bonds will mature in 2020 alone, with only USD 50 billion of this in the speculative grade ratings category. Despite this, speculative grade bond yields are rising. In 20212024, the debt maturity wall that is facing U.S. non-financial companies is even more formidable at over USD3.4 trillion in total and more than USD700 billion of this in speculative grade bonds. Virtually all of these debts will have to be rolled over at a higher cost than their 2015-2019 issuance.
-250
-500 Share of growth accounted for by increases in debt and deficits Historical averages, ex-recessions, %
5