FIRST QUARTER REPORT
For the period ended March 31, 2023

2023

For the period ended March 31, 2023
This document contains management’s discussion and analysis of the financial condition, financial performance and cash flows of Power Corporation of Canada (the Corporation) for the three months ended March 31, 2023 and the unaudited interim condensed consolidated financial statements of the Corporation as at and for the three months ended March 31, 2023. This document has been filed with the securities regulatory authorities in each of the provinces and territories of Canada and is available under the Corporation’s profile on SEDAR at www.sedar.com.
MAY 15, 2023
ALL TABULAR AMOUNTS ARE IN MILLIONS OF CANADIAN DOLLARS, UNLESS OTHERWISE NOTED. The following presents Management’s Discussion and Analysis (MD&A) of the financial condition and financial performance of Power Corporation of Canada (Power Corporation or the Corporation) (TSX: POW; POW.PR.E), a public corporation, for the three-month period ended March 31, 2023. The 2022 comparative periods are unaudited and are restated for the adoption of IFRS 17, Insurance Contracts and IFRS 9, Financial Instruments. This MD&A should be read in conjunction with the unaudited interim condensed consolidated financial statements of Power Corporation and notes thereto for the threemonth period ended March 31, 2023 (the Interim Consolidated Financial Statements), the MD&A for the year ended December 31, 2022 (the 2022 Annual MD&A), and the audited consolidated financial statements and notes thereto for the year ended December 31, 2022 (the 2022 Consolidated Financial Statements). Additional information relating to Power Corporation, including its Annual Information Form, may be found on the Corporation’s website at www.powercorporation.com and on SEDAR at www.sedar.com.
FORWARD-LOOKING STATEMENTS › Certain statements in this MD&A, other than statements of historical fact, are forward-looking statements based on certain assumptions and reflect the Corporation’s current expectations, or with respect to disclosure regarding the Corporation’s public subsidiaries, reflect such subsidiaries’ current expectations as disclosed in their respective MD&A. Forward-looking statements are provided for the purposes of assisting the reader in understanding the Corporation’s financial performance, financial position and cash flows as at and for the periods ended on certain dates and to present information about management’s current expectations and plans relating to the future and the reader is cautioned that such statements may not be appropriate for other purposes. These statements may include, without limitation, statements regarding the operations, business, financial condition, expected financial results, performance, prospects, opportunities, priorities, targets, goals, ongoing objectives, strategies and outlook of the Corporation and its subsidiaries including the fintech strategy, as well as the outlook for North American and international economies for the current fiscal year and subsequent periods, the Corporation’s NCIB (as defined herein) commenced in 2023 and the return of net cash proceeds from the sale of its interest in ChinaAMC (as defined herein) to IGM (as defined herein), statements concerning deferred taxes, statements concerning the expected impacts of IFRS 17, management of standalone businesses to realize value over time, fundraising activities by investment platforms, capital commitments by the Power group and third parties, the intended acquisition opportunity of Portage Fintech Acquisition Corporation, the completion of the Bellus (as defined herein) transaction, the objective to maintain a minimum level of cash and cash equivalents relative to fixed charges, and the Corporation’s subsidiaries’ disclosed expectations, including in respect of the proposed acquisition of IPC (as defined herein) by Canada Life (as defined herein) from IGM (including the impacts and timing thereof), the completion of the Webhelp (as defined herein) transaction, as well as expectations as a result of the acquisition of the Prudential (as defined herein) full-service retirement business (including the impacts and timing thereof), and the purchase by IGM of an interest in Rockefeller (as defined herein). Forward-looking statements include statements that are predictive in nature, depend upon or refer to future events or conditions, or include words such as “expects”, “anticipates”, “plans”, “believes”, “estimates”, “seeks”, “intends”, “targets”, “projects”, “forecasts” or negative versions thereof and other similar expressions, or future or conditional verbs such as “may”, “will”, “should”, “would” and “could”.
By its nature, this information is subject to inherent risks and uncertainties that may be general or specific and which give r ise to the possibility that expectations, forecasts, predictions, projections or conclusions will not prove to be accurate, that assumptions may not be correct and that objectives, strategic goals and priorities will not be achieved. A variety of factors, many of which are beyond the Corporation’s and its subsidiaries’ control, affect the operations, performance and results of the Corporation and its subsidiaries and their businesses, and could cause actual results to differ materially from current expectations of estimated or anticipated events or results. These factors include, but are not limited to: the impact or unanticipated impact of general economic, political and market factors in North America and internationally, fluctuations in interest rates, inflation and foreign exchange rates, monetary policies, business investment and the health of local and global equity and capital markets, management of market liquidity and funding risks, risks related to investments in private companies and illiquid securities, risks associated with financial instruments, changes in accounting policies and methods used to report financial condition (including uncertainties associated with significant judgments, estimates and assumptions), the effect of applying future accounting changes, business competition, operational and reputational risks, technological changes, cybersecurity risks, changes in government regulation and legislation, changes in tax laws, unexpected judicial or regulatory proceedings, catastrophic events, man-made disasters, terrorist attacks, wars and other conflicts (such as the invasion of Ukraine), or an outbreak of a public health pandemic or other public health crises (such as COVID-19), the Corporation’s and its subsidiaries’ ability to complete strategic transactions, integrate acquisitions and implement other growth strategies, the Corporation’s and its subsidiaries’ success in anticipating and managing the foregoing factors, and with respect to forward-looking statements of the Corporation’s subsidiaries disclosed in this MD&A, the factors identified by such subsidiaries in their respective MD&A.
The reader is cautioned to consider these and other factors, uncertainties and potential events carefully and not to put undue reliance on forward-looking statements. Information contained in forward-looking statements is based upon certain material assumptions that were applied in drawing a conclusion or making a forecast or projection, including management’s perceptions of historical trends, current conditions and expected future developments, that any required approvals (including regulatory approvals) for strategic transactions, acquisitions, divestitures or other growth or optimization strategies will be received when and on such terms as are expected, as well as other considerations that are believed to be appropriate in the circumstances, including the availability of cash to complete purchases under the NCIB, that the list of risks and uncertainties in the previous paragraph, collectively, are not expected to have a material impact on the Corporation and its subsidiaries, and with respect to forward-looking statements of the Corporation’s subsidiaries disclosed in this MD&A, the risks identified by such subsidiaries in their respective MD&A and Annual Information Form most recently filed with the securities regulatory authorities in Canada and available at www.sedar.com. While the Corporation considers these assumptions to be reasonable based on information currently available to management, they may prove to be incorrect.
Other than as specifically required by applicable Canadian law, the Corporation undertakes no obligation to update any forward-looking statement to reflect events or circumstances after the date on which such statement is made, or to reflect the occurrence of unanticipated events, whether as a result of new information, future events or results, or otherwise.
Additional information about the risks and uncertainties of the Corporation’s business and material factors or assumptions on which information contained in forward looking statements is based is provided in its disclosure materials, including this MD&A and its most recent Annual Information Form, filed with the securities regulatory authorities in Canada and available at www.sedar.com.
NON-IFRS FINANCIAL MEASURES › This MD&A contains financial measures (including ratios) that do not have a standard meaning under International Financial Reporting Standards (IFRS). Terms by which non-IFRS financial measures are identified include, but are not limited to, “adjusted net earnings”, “adjusted net earnings per share”, “adjusted net asset value”, “adjusted net asset value per share”, “consolidated assets and assets under management”, “consolidated assets and assets under administration” and “fee-related earnings”. Management uses these financial measures in its presentation and analysis of the financial performance, financial condition and cash flows of Power Corporation, and believes that they provide additional meaningful information to readers in their analysis of the results of the Corporation. These non-IFRS financial measures may not be comparable to similar measures used by other entities. Refer to the section “Non-IFRS Financial Measures” in this MD&A for the appropriate reconciliations of these non-IFRS financial measures to measures prescribed by IFRS as well as additional details on each measure. Reconciliations of the adjusted net asset value and the holding company balance sheet are also included in the section “Adjusted Net Asset Value”. This MD&A also includes other measures used to discuss activities of the Corporation’s consolidated publicly traded operating companies and alternative asset investment platforms including, but not limited to, “assets under management”, “assets under administration”, “assets under management and advisement”, “book value per participating share”, “carried interest”, “fee-bearing capital”, “market capitalization”, “net asset value”, “net carried interest” and “unfunded commitments”. As well, the presentation of the holding company is used to present and analyze the financial position and cash flows of Power Corporation as a holding company. Refer to the section “Other Measures” in this MD&A for a definition of each measure.
Holdings Inc.
Power Sustainable Lios
GBL Groupe Bruxelles Lambert Prudential
GEA GEA Group AG
Grayhawk Grayhawk Wealth Holdings Inc.
Holcim Holcim Ltd.
IFRS International Financial Reporting Standards
IGM or IGM Financial IGM Financial Inc.
IG Wealth Management Investors Group Inc.
Imerys Imerys SA
Investment Planning Investment Planning Counsel Inc.
Counsel or IPC
PSEIP
Putnam
Rockefeller
Power Sustainable Lios Inc.
Prudential Financial, Inc.
Power Sustainable Energy
Infrastructure Partnership
Putnam Investments, LLC
Rockefeller Capital Management
Sagard Sagard Holdings Inc.
Sagard Credit Partners I
Sagard Credit Partners, LP
Sagard Credit Partners II Sagard Credit Partners II, LP
Sagard Healthcare Partners Sagard Healthcare Royalty Partners, LP
Sagard Holdings Management Sagard Holdings Management Inc.
Irish Life Irish Life Group Limited or SHMI
Lifeco Great-West Lifeco Inc.
Sagard MidCap Sagard MidCap II, Sagard MidCap III, and
Lion or Lion Electric The Lion Electric Company Sagard MidCap IV
LMPG LMPG Inc.
Sagard Senior Lending Partners Sagard Senior Lending Partners
Mackenzie or Mackenzie Financial Corporation or SSLP Holdings (I and II) LP, and Mackenzie Investments
Sagard Senior Lending Partners
MassMutual Massachusetts Mutual Life Insurance Company Holdings (I-U and II-U) LP
MOWI Mowi ASA Sanoptis Sanoptis AG
Nautilus or Nautilus Solar Nautilus Solar Energy, LLC SGS SGS SA
NCREIF National Council of Real Estate
SIX
Swiss Stock Exchange
Investment Fiduciaries SPEC Sagard Private Equity Canada LP
Northleaf Northleaf Capital Group Ltd.
NYSE New York Stock Exchange
TotalEnergies
TSX
TotalEnergies SA
Toronto Stock Exchange
Ontex Ontex Group NV Umicore Umicore, NV/SA
OSE Oslo Stock Exchange
USPF
GWL U.S. Property Fund L.P.
OSFI Office of the Superintendent of Wealthsimple Wealthsimple Financial Corp. Financial Institutions
Webhelp Webhelp Group
XETR
PanAgora PanAgora Asset Management, Inc.
XETRA Stock Exchange
POWER CORPORATION OF CANADA
Incorporated in 192 , Power Corporation (TSX: POW; POW.PR.E) is an international management and holding company that focuses on financial services in North America, Europe and Asia. Its core holdings are leading insurance, retirement, wealth management and investment businesses, including a portfolio of alternative asset investment platforms. Through Power Financial, it controls Lifeco and IGM and has an active fintech strategy. It also holds, jointly with the Frère Group of Belgium, a controlling interest in GBL.
Power Corporation conducts its investment activities, built upon a network of deep and long-standing relationships, to provide superior returns. Investment activities include investments in alternative asset managers, Sagard and Power Sustainable, investment funds, and interests in China resulting from more than 0 years of engagement. The Corporation aims to act like an owner with a long-term perspective and a strategic vision anchored in strong core values.
Power Corporation adheres to four overriding investing principles to pursue its objective of achieving sustainable long-term value creation in the best interests of the Corporation:
Long-term perspective
Leading franchises with attractive growth profiles
Strong governance oversight
Prudent approach to risk management
Power Corporation’s value creation strategy is focused on financial services, designed to generate long-term sustainable growth in earnings and dividends, and is based upon three key levers:
Operating company organic levers: organic growth strategies at the publicly traded operating companies;
Operating company inorganic levers: deployment and redeployment of capital; and
Holding company levers: actions that can be taken at the Corporation and between the Corporation and its publicly traded operating companies and investments.
Power Corporation, through its alternative asset investment platforms, is developing alternative asset management businesses which build upon the investment capabilities that have been created over many years in several high-growth asset classes. The alternative asset investment platforms are focused on growing their asset management businesses through raising third-party capital and the Corporation intends to continue to provide seed capital to the different investment products managed by each:
Sagard is a multi-strategy alternative asset management firm active in venture capital & growth, private equity, private credit, royalties and real estate. Sagard also engages in private wealth management. Sagard looks to generate attractive returns by matching investment opportunities with flexible capital solutions and pairing entrepreneurs with teams that have deep industry knowledge.
Power Sustainable is a sustainability-led global alternative asset manager with a long-term investment approach. Power Sustainable aims to create long-term value by actively investing in entrepreneurial management teams, companies and projects with sustainable business models. Power Sustainable currently manages four main strategies, including Power Sustainable China, Power Sustainable Energy Infrastructure, Power Sustainable Lios and Power Sustainable Infrastructure Credit.
The Corporation also has significant influence and controlling interests in several standalone businesses managed to create and realize value over time.
The Corporation and its subsidiaries adopted IFRS 17, Insurance Contracts (IFRS 17), replacing IFRS , Insurance Contracts (IFRS ) effective January 1, 2023. IFRS 17 impacted only Lifeco due to its insurance activities. While the new standard changes the measurement and timing of recognition of insurance contracts and the corresponding presentation and disclosures in the Corporation’s consolidated financial statements, it does not have a material impact or change to Lifeco’s underlying business strategy.
The Corporation and its subsidiaries have also adopted IFRS 9, Financial Instruments (IFRS 9), replacing IAS 39, Financial Instruments: Recognition and Measurement effective January 1, 2023. IFRS 9 provides changes to financial instruments accounting for the following: classification and measurement of financial instruments based on a business model approach for managing financial assets and the contractual cash flow characteristics of the financial asset; impairment based on an expected loss model; and hedge accounting that incorporates the risk management practices of an entity. The adoption of IFRS 9 has not resulted in a material change in assets, liabilities and earnings.
Refer to the section “Changes in Accounting Policies” as well as Note 2 and Note 3 to the Corporation’s Interim Consolidated Financial Statements for addition information.
The Corporation is reporting under the new standards for the first time for the quarter ended March 31, 2023. Quarterly comparative results for the year ended December 31, 2022 have been restated, as applicable, in alignment with the new standards. The impacts of the adoption of IFRS 17 include:
January 1, 2022 participating shareholders' equity decreased by approximately 10% on the adoption of IFRS 17 on January 1, 2023 in line with original expectations, primarily due to the establishment of the contractual service margin (CSM), partially offset by the removal of provisions no longer required under IFRS 17.
The CSM established by Lifeco for in-force contracts at January 1, 2022 was $ .1 billion associated with shareholders’ equity and $ billion associated with non-controlling interests. This does not include the CSM on in-force segregated fund business which does not have a material impact on capital.
The comparative March 31, 2022 adjusted net earnings [ ] reported by Lifeco decreased by approximately 1. % as a result of the transition. Approximately 70% of Lifeco’s business experienced limited or no change in 2022 comparative earnings with the adoption of IFRS 17, and for the businesses more impacted the main drivers of the change in earnings relate to the introduction of the CSM and the removal of the direct link between asset and liability measurement. The decrease in Lifeco’s adjusted net earnings was driven by a deferral of new business gains and certain trading activity, partially offset by higher in-force earnings driven by the CSM amortization and deferral of certain non-financial experience.
There is an expected increase in net earnings volatility driven by the removal of the direct link between asset and liability measurement that existed under the Canadian Asset Liability Matching (CALM) process under IFRS . The adoption of IFRS 17 and IFRS 9 has led to an increase in the Corporation’s net earnings volatility due to market experience that was a result of the heightened market volatility in 2022.
Part B of this MD&A further describes the impacts of the adoption of IFRS 17 and IFRS 9 and the expected increase in net earnings volatility at Lifeco.
Effective the first quarter of 2023, the Corporation introduced a refined definition of adjusted net earnings, a non-IFRS financial measure. This change is consistent with the introduction of a refined definition of base earnings (losses) by Lifeco with the adoption of IFRS 17 on January 1, 2023. Lifeco’s base earnings (losses) continues to represent its management’s view of the underlying business performance of Lifeco and provides an alternate measure to understand the underlying business performance of Lifeco compared with its IFRS-reported net earnings. The definition of Adjustments continues to include what the Corporation previously presented, including Lifeco’s impact of assumption changes and management actions that impact the measurement of assets and liabilities, and marketrelated impacts where actual market returns in the current period are different than longer-term expected returns on assets and liabilities. The definition of Lifeco’s base earnings has been refined by Lifeco to exclude the following impacts that are included in IFRS-reported net earnings for an improved representation of Lifeco’s underlying business performance, as well as for consistency and comparability with its financial services peers:
Realized gains (losses) on the sale of assets measured at fair value through other comprehensive income (FVOCI); The direct equity and interest rate impacts on the measurement of surplus assets and liabilities; and Amortization of acquisition-related finite life intangible assets.
The Corporation has updated its definition of adjusted net earnings in line with Lifeco’s change. The comparative periods have been restated to reflect this change.
Refer to the section “Non-IFRS Financial Measures” for the refined definition of the Corporation’s adjusted net earnings.
The Corporation’s MD&A consists of three parts:
Part A – Power Corporation, presented on a consolidated basis, and including a discussion of the contribution to the holding company from Lifeco, IGM, GBL, and its alternative asset investment platforms and other investments;
Part B – Lifeco’s interim MD&A, as prepared and disclosed by Lifeco in accordance with applicable securities legislation, and which is also available either directly from SEDAR (www.sedar.com) or from Lifeco’s website (www.greatwestlifeco.com);
Part C – IGM’s interim MD&A, as prepared and disclosed by IGM in accordance with applicable securities legislation, and which is also available either directly from SEDAR (www.sedar.com) or from IGM’s website (www.igmfinancial.com).
Lifeco (TSX: GWO) and IGM (TSX: IGM) are public companies listed on the Toronto Stock Exchange. GBL is a public company listed on the Brussels Stock Exchange (EBR: GBLB). Market capitalizations reported in the following sections are at March 31, 2023 (refer to the section “Other Measures”).
The following chart reflects the economic interests held by the Corporation at March 31, 2023, which include the operating subsidiaries (Lifeco and IGM) and its interest in GBL, held through Power Financial, and interests held through the Corporation’s alternative asset investment platforms.
In bold: Publicly listed holdings
[ ] Lifeco, through Canada Life, holds a 3.9% interest in IGM, and IGM holds a 2. % interest in Lifeco.
[ ] Represents a 9.9% non-controlling voting interest. The interest in Northleaf is held through an acquisition vehicle in which IGM holds an 0% equity interest and Lifeco holds a 20% equity interest.
[ ] Held through Parjointco, a jointly controlled corporation ( 0%). Parjointco has a .0% voting interest in GBL. Refer to the section “GBL” for a list of investments.
[4] Includes a controlling interest in Portage Ventures I, Portage Ventures II, Portage Ventures III and Wealthsimple, held through Power Financial, Lifeco and IGM.
[5] Refer to the section “Alternative Asset Investment Platforms” for a list of investments held by each investment platform.
The Corporation holds controlling interests, through Power Financial, in Lifeco and IGM. It also has significant holdings in a portfolio of European-based global companies through its investment in GBL.
Lifeco
Great-West Lifeco Inc. (TSX: GWO), market capitalization of $33. billion at March 31, 2023, is an international financial services holding company with interests in life insurance, health insurance, retirement savings, wealth and asset management and reinsurance businesses. Lifeco operates primarily in Canada, the United States (U.S.) and Europe under the brands Canada Life, Empower, Putnam Investments and Irish Life. For reporting purposes, Lifeco has four major reportable segments: Canada, the United States, Europe, and Capital and Risk Solutions. Lifeco is advancing its business strategy and driving momentum across its portfolio, including enhancing its reporting and disclosures to focus on three key value drivers for its business: Workplace Solutions (including group life & health, group retirement, and pension administration and recordkeeping services); Wealth & Asset Management (including retail savings and wealth products); and Insurance & Risk Solutions (including life insurance, disability, and critical illness coverage for individuals, and payout annuities for individuals and pension plans as well as reinsurance). Accordingly, in the first quarter of 2023 Lifeco updated how it refers to the business units within the Canada, Europe and U.S. segments.
The Canada segment is operated by Canada Life primarily through the Workplace Solutions, Individual Wealth Management, and Insurance & Annuities business units. Through the Workplace Solutions business unit, Lifeco offers group life and health and group retirement products through employer sponsored plans and individual product solutions, including life, accidental death and dismemberment, disability, critical illness, health and dental protection, and creditor insurance, as well as retirement savings and income and annuity products and other speciality products. Through the Individual Wealth Management business unit, Lifeco provides wealth savings and income products to individuals. The Insurance & Annuities business unit offers life, disability and critical illness insurance products to individuals, as well as individual life annuities and single-premium group annuities.
On April 3, 2023, subsequent to quarter-end, Canada Life announced an agreement to acquire Investment Planning Counsel, a leading independent wealth management firm, from IGM. This acquisition accelerates Lifeco’s strategy of building the leading platform for independent advisors in Canada. With this acquisition, Canada Life will be one of the largest non-bank wealth management providers in Canada. Canada Life will acquire IPC for a total cash consideration of $ 7 million, subject to adjustments. Lifeco expects to incur transaction and integration costs of $2 million pre-tax over 1 months after the deal is closed. The transaction is expected to close by the end of 2023 and is subject to customary closing conditions including regulatory approvals. The Corporation, through IGM, currently consolidates IPC and therefore the transaction will not have a significant impact on the Corporation’s consolidated statements of earnings and balance sheets.
The United States segment is operated by Empower through the Empower Defined Contribution and the Empower Personal Wealth business units, as well by Putnam through the Asset Management business unit. The Empower Defined Contribution business unit helps people with saving, investing and advice through employer-sponsored plans and individual product solutions. The Empower Personal Wealth business unit offers retail wealth management products and services. This includes the full-service retirement services business of Prudential acquired in 2022 and the results of the business acquired from Personal Capital. The Asset Management business unit, and specifically the Putnam brand, provides investment management services, related administrative functions and distribution services, and offers a broad range of investment products. The Corporate business unit includes items not associated directly with or allocated to the Empower and Asset Management business units, as well as a retained block of life insurance, predominately participating policies, which are now administered by Protective Life Insurance Company (Protective Life), as well as a closed retrocession block of life insurance.
On April 1, 2022, Empower completed the acquisition of the full-service retirement services business of Prudential. With the completion of the acquisition, Empower’s reach in the U.S. has expanded to approximately 2,000 workplace savings plans as of March 31, 2023. Lifeco funded the total transaction value of US$3, 0 million with US$1,193 million of Limited Recourse Capital Notes (LRCN Series 1) and US$ 23 million of short-term debt, in addition to its existing resources.
Lifeco anticipates realizing cost synergies through the migration of Prudential’s retirement services business onto Empower’s record-keeping platform. Estimated run-rate cost synergies are expected to be US$1 0 million and to be phased in over 2 months, primarily when systems migrations are completed. As of March 31, 2023, US$ 3 million of pre-tax run-rate cost synergies had been achieved. Revenue synergies of US$20 million are expected by Lifeco on a run-rate basis by the end of 202 and Lifeco expects them to grow to US$ 0 million by 202 . Lifeco expects to incur one-time integration and restructuring expenses of US$170 million pre-tax related to the Prudential acquisition, of which US$ million pre-tax had been incurred as of March 31, 2023. Lifeco expects the integration to be completed in the first half of 202
The Europe segment operates under the Canada Life brand in the United Kingdom (U.K.) and Germany and under the Irish Life brand in Ireland. The Workplace Solutions business unit consists of group life and health insurance business in the U.K. and Ireland as well as group retirement and insurance brokerage services in Ireland. The Individual Wealth & Asset Management business unit consists of investment products (including life bonds, retirement drawdown and pension) offered in the U.K., pension, savings and investment products offered in Ireland and individual and group pensions in Germany. Irish Life Investment Managers (ILIM) is one of Lifeco’s fund management operations in Ireland. In addition to managing assets on behalf of companies in the Lifeco group, ILIM also manages assets for a wide range of institutional clients across Europe and North America. The Insurance & Annuities business unit consists of bulk and individual payout annuities offered in the U.K. and Ireland, equity-release mortgages offered in the U.K., and individual insurance offered in Ireland and Germany.
The Capital and Risk Solutions segment includes Lifeco’s reinsurance business which operates primarily in the U.S., Barbados, Bermuda and Ireland. Reinsurance products are provided through Canada Life and its subsidiaries and include both reinsurance and retrocession business transacted directly with clients or through reinsurance brokers.
On January 12, 2023, the Corporation and IGM completed a transaction under which IGM sold approximately 1 .2 million common shares of Lifeco, representing a 1. % interest in Lifeco, to Power Financial. Refer to the section “ChinaAMC” below. At March 31, 2023, Power Financial and IGM held interests of .2% and 2. %, respectively, in Lifeco’s common shares, representing approximately % of the voting rights attached to all outstanding Lifeco voting shares. The Insurance Companies Act limits voting rights in life insurance companies to %.
See Part B of this MD&A for additional information on Lifeco.
IGM Financial Inc. (TSX: IGM), market capitalization of $9. billion at March 31, 2023, is a leading wealth and asset management company supporting advisors and the clients they serve in Canada, and institutional investors throughout North America, Europe and Asia. IGM’s principal operating subsidiaries are wealth manager IG Wealth Management and asset manager Mackenzie Investments. IGM also holds a number of strategic investments that provide benefits to the operating subsidiaries while furthering IGM’s growth prospects. IGM has three reportable segments: Wealth Management, Asset Management, and Strategic Investments and Other.
The Wealth Management segment reflects the activities of operating companies that are principally focused on providing financial planning and related services to Canadian households and represents the activities of IG Wealth Management and Investment Planning Counsel. These firms are retail distribution organizations that serve Canadian households through their securities dealers, mutual fund dealers and other subsidiaries licensed to distribute financial products and services. The Wealth Management segment provides a comprehensive planning approach through IG Wealth Management and IPC advisors by offering a broad range of financial products and services in the areas of advanced financial planning, mortgages and banking, insurance, and securities. IG Wealth Management distinguishes itself from its competition by offering comprehensive planning to its clients that synchronizes their financial lives. Investment Planning Counsel is an independent distributor of financial products, services and advice in Canada.
The Asset Management segment reflects the activities of operating companies primarily focused on providing investment management services, and represents the operations of Mackenzie Investments. Investment management services are provided to a suite of investment funds that are distributed through third-party dealers and financial advisors, and through institutional advisory mandates to financial institutions, pensions and other institutional investors. Mackenzie Investments is a diversified asset management solutions provider and provides investment management and related services with a wide range of investment mandates through a boutique structure and uses multiple distribution channels. Mackenzie seeks to be Canada’s preferred global asset management solutions provider and business partner.
The Strategic Investments and Other segment primarily represents the key strategic investments made by IGM, including ChinaAMC, Lifeco, Northleaf, Wealthsimple, and the Portage Ventures funds (refer to the section “Alternative Asset Investment Platforms”), as well as unallocated capital.
On April 3, 2023, subsequent to quarter-end, IGM Financial purchased a 20. % equity interest in Rockefeller, a leading U.S. independent financial services advisory firm, for consideration of approximately US$ 22 million payable on June 2, 2023.
Highlights of the Rockefeller transaction include:
The expansion of IGM’s wealth management footprint, through Rockefeller, into the U.S., with a brand and business model focused on the high-net-worth and ultra-high-net-worth segments;
A strategic ownership position with two board seats and rights enhancing IGM’s opportunity to increase its equity interest in Rockefeller in the future; and
The opportunity for knowledge sharing and collaboration between Rockefeller and IGM’s wealth management business.
Concurrently with the Rockefeller transaction, IGM announced that it has entered into an agreement to sell 100% of the common shares of IPC to Canada Life for cash consideration of $ 7 million. The sale of IPC to Canada Life is expected to close by the end of 2023, subject to customary closing conditions, including regulatory approvals. IGM currently consolidates IPC, and subsequent to the close of the transaction IPC will be consolidated by Lifeco; therefore, the transaction will not have a significant impact on the Corporation’s consolidated statements of earnings and balance sheets.
On January 12, 2023, the Corporation and IGM completed the previously announced transaction in which the group’s interest in ChinaAMC was combined under IGM. The Corporation sold its 13.9% interest in ChinaAMC to Mackenzie, for aggregate consideration of $1.1 billion in cash, increasing IGM’s interest in ChinaAMC to 27. %. The Corporation’s shareholders will continue to participate in ChinaAMC through the Corporation’s interest in IGM. The Corporation accounted for the group’s 27. % interest in ChinaAMC as an associate in its consolidated financial statements; therefore, the transaction did not have an impact on the carrying value of the investment in ChinaAMC in the consolidated balance sheet.
In a separate transaction, on January 12, 2023, IGM sold approximately 1 .2 million Lifeco common shares to Power Financial, for cash consideration of $ 3 million. IGM’s interest in Lifeco was thereby reduced from .0% to 2. %. Power Financial’s equity interest in Lifeco increased to .2%. IGM recorded a gain on sale of the Lifeco shares of $179 million pre-tax, which the Corporation has eliminated on consolidation.
The Corporation expects to return a portion of the net cash proceeds from the transaction to its shareholders, after factoring in the purchase of Lifeco common shares, through share repurchases over time pursuant to normal course issuer bids.
At March 31, 2023, Power Financial and Canada Life, a subsidiary of Lifeco, held interests of 2.1% and 3.9%, respectively, in IGM’s common shares.
See Part C of this MD&A for additional information on IGM.
Power Financial Europe SA, a wholly owned subsidiary of Power Financial, and the Frère Group each hold a 0% interest in Parjointco. At March 31, 2023, Parjointco held a 29. % indirect ( .0% of the voting rights) controlling interest in GBL, a Belgian holding company listed on the Brussels Stock Exchange.
GBL (EBR: GBLB), market capitalization of €12.0 billion at March 31, 2023, is an established investment holding company. As a leading and active investor in Europe, GBL is focused on long-term value creation with the support of a stable family shareholder base and perceives environmental, social and governance (ESG) factors as being inextricably linked to value creation. GBL aims to grow its diversified high-quality portfolio of listed, private and alternative investments through GBL Capital. In addition, GBL is developing its third-party asset management activity through Sienna Investment Managers, a wholly owned subsidiary. GBL’s portfolio is composed of global companies, leaders in their sectors, in which GBL can contribute to value creation by being an active professional investor.
At March 31, 2023, GBL’s portfolio was mainly comprised of the following investments:
PUBLICLY LISTED
Imerys (EPA: NK) – mineral-based specialty solutions for industry
SGS (SIX: SGSN) – inspection, verification, testing and certification solutions
adidas (XETR: ADS) – design, development, production and distribution of sporting goods
Pernod Ricard (EPA: RI) – wines and spirits
PRIVATELY HELD
Webhelp – business process outsourcer, specializing in customer experience, sales and marketing services and payment services
Canyon – direct-to-consumer manufacturer of premium bicycles
Holcim (SIX: HOLN) – construction materials and solutions including cement, aggregates and concrete
Umicore (EBR: UMI) – materials technology and recycling of precious metals
GEA (XETR: G1A) – supplier of equipment and project management for a wide range of processing industries primarily in the food and beverage sectors
Ontex (EBR: ONTEX) – personal hygiene solutions provider
Affidea – provider of advanced diagnostics and outpatient services
Sanoptis – ophthalmology services
Voodoo – developer and publisher of mobile games
Parques Reunidos – leisure park operator
Through GBL Capital and Sienna Investment Managers, GBL has expanded its activities into alternative asset management and is developing an alternative investment portfolio including investments in funds externally managed and direct private equity co-investments, and as well offers a full range of investment strategies through its third-party fund managers. Strategies managed by Sienna Investment Managers include Sienna Real Estate, Sienna Gestion, Sienna Private Credit, Sienna Private Equity, Sienna Venture Capital and Sienna Multi-Manager Private Equity, dedicated to primary and secondary fund investing and direct co-investments.
During the first quarter of 2023, GBL reduced its exposure in certain of its publicly listed investments, generating total proceeds of approximately €2 9 million, including:
MOWI: GBL disposed of its residual interest in MOWI of 1.9%, for proceeds of €1 million, and generated a net loss for GBL of € million (no impact on the net consolidated result in accordance with IFRS 9).
Pernod Ricard: GBL completed its disposal plan, reducing its interest in Pernod Ricard from .9% at December 31, 2022 to .7%, for proceeds of €110 million, and generated a net gain for GBL of €7 million based on the historical acquisition price (no impact on the net consolidated result in accordance with IFRS 9).
On March 30, 2023, Webhelp and Concentrix Corporation (Concentrix) (Nasdaq: CNXC) announced that they had entered into an agreement to combine, thereby creating a prominent global player in customer experience. These companies are highly complementary, and the combined group will be better positioned for growth, margin expansion and value creation. The implied valuation of GBL’s stake in Webhelp, at the time of the announcement, of €1, 29 million corresponds to an economic gain of approximately €0.7 billion based on GBL’s historical acquisition price of its initial investment in November 2019. Upon completion of this transaction, expected by the end of 2023, the liability to Webhelp’s minority shareholders, valued at €1. billion at March 31, 2023, will be extinguished without any cash impact for GBL. GBL will be paid, according to the deal terms, in (i) Concentrix shares representing approximately 12.9% of outstanding common shares; (ii) earn-out shares that could give access to additional capital of the combined entity if certain thresholds are reached; and (iii) a seller note entitling GBL to receive approximately € 00 million in cash on the second anniversary of the transaction closing.
In the first quarter of 2023, GBL repurchased, directly and through its subsidiaries, 1.9 million shares of its own capital for a total consideration of €1 7 million, representing 1.2% of GBL’s capital at March 31, 2023. As of March 31, 2023, GBL has completed 92. % of its fifth allocation for share buybacks of € 00 million. On March 9, 2023, GBL’s board of directors approved a sixth allocation for share buybacks of € 00 million.
GBL reported a net asset value (refer to the section “Other Measures”) at March 31, 2023 of €1 , 9 million, compared with €17,77 million at December 31, 2022.
GBL’s financial results and other disclosures are derived from publicly disclosed information, as issued by GBL in its first quarter of 2023 press release. Further information on GBL’s results is available on its website (www.gbl.be).
Since the launch of the first Sagard fund in Europe in 2002, Power Corporation has continued to develop alternative asset investment platforms (investment platforms) that manage portfolios in several alternative asset classes in three principal geographies: Europe, North America, and China. The alternative asset investment platforms offer alternative strategies to traditional long-term investment strategies. Traditional long-term investment strategies generally invest in publicly traded stocks and fixed income investments, whereas the alternative asset strategies include venture capital, private equity, private credit as well as real estate and infrastructure. The investment platforms Sagard and Power Sustainable are managed locally by experienced investment professionals who have an in-depth knowledge of the local markets and benefit from collaboration within the Power group of companies. Power Corporation’s investment platforms seek to generate attractive returns for their investors by: i) attracting experienced investment teams to execute on investment strategies where the investment platforms’ ecosystem gives them a competitive advantage; ii) leveraging the global network created over decades by the Power group to drive the commercial success of their investment strategies and underlying investments; and iii) providing flexible capital solutions to solve a range of business and financing needs.
The investment platforms comprise asset management and investing activities. Earnings from asset management activities include income earned from management fees and carried interest, net of investment platform expenses. Earnings from investing activities comprise income earned on the capital invested by the Corporation (proprietary capital) in the investment funds managed by each platform and the share of earnings (losses) of controlled and consolidated subsidiaries held within the investment platforms.
Power Corporation invests proprietary capital in the strategies of its investment platforms to support their growth and development as asset managers. The investment platforms’ growth strategy is focused primarily on raising third-party capital, and the Corporation expects that its proprietary capital will represent an increasingly smaller proportion of future funds. The Corporation seeks to earn attractive returns on its proprietary capital investments commensurate with the risk profile of the underlying investments in each strategy. Returns are expected to be realized over differing time horizons: Income-related strategies such as Private Credit, Royalties and Power Sustainable Energy Infrastructure Partnership are expected to generate returns on a regular basis; and Capital appreciation strategies such as Venture Capital & Growth, Private Equity and Power Sustainable China are expected to generate returns as investments are monetized.
Sagard is a multi-strategy alternative asset management firm with professionals principally located in Canada, the U.S. and Europe. Sagard seeks to generate attractive returns by matching investment opportunities with flexible capital solutions and pairing entrepreneurs with teams that have deep industry knowledge. Sagard develops long-term partnerships and empowers the growth of its investments through a unique global network of portfolio companies, limited partners, advisors and other valued relationships.
The alternative investment management business of Sagard is consolidated under Sagard Holdings Management Inc. (SHMI). The Corporation, through Sagard, held a 79.0% controlling interest in SHMI at March 31, 2023 ( 0.9% at December 31, 2022). The operations of Sagard are comprised of asset management and investing activities.
At March 31, 2023, Sagard had US$1 .3 billion of assets under management (US$1 .0 billion at December 31, 2022), including unfunded commitments (refer to the section “Other Measures”), across five asset classes: venture capital & growth, private equity, private credit, royalties and real estate, including US$1.0 billion through its private wealth investment platform (same as at December 31, 2022).
Composition of assets under management is as follows: (In
[ ] Includes assets managed through its private wealth investment platform.
[ ] Associated companies includes commitments from management, as well as commitments from Lifeco, IGM and GBL.
[ ] Refer to the section “Other Measures”.
The following table summarizes the funds managed by Sagard and the Corporation’s interests in each of the funds:
millions; except as otherwise noted)
[ ] Associated companies includes commitments from management as well as commitments from Lifeco ($33 million in Portage Ventures II, US$ 9 million in Portage Ventures III, $ 0 million in SPEC, € 0 million in Sagard MidCap IV, US$ 0 million in Sagard Credit Partners II, up to US$120 million in SSLP, and US$2 1 million in USPF), IGM ($33 million in Portage Ventures II and US$2 million in Portage Ventures III), Pargesa (€33 million in Sagard MidCap II), and GBL (€102 million in Sagard MidCap II, €192 million in Sagard MidCap III, €1 0 million in Sagard MidCap IV and € 0 million in Sagard NewGen). Lifeco and IGM have invested $2 million and $2 million, respectively, in Portage Ventures I.
[ ] Represents the base management fees and carried interest of each fund.
[ ] Includes an interest in Portage Ventures I and Portage Ventures II of 3 .0% and 7.7%, respectively, held through Power Financial.
[4] Includes investments held by Portage Ventures I, Power Financial and IGM, through limited partnerships controlled by Power Financial, in Wealthsimple.
[5] During the investment period, management fees were based on committed capital. Since the close of the investment period, management fees are based on invested capital, which may include a reserve for follow-on investments.
[6] The Corporation’s interest is held in carried interest units.
[ ] Fundraising activities continue for Sagard Senior Lending Partners.
[ ] USPF is managed by EverWest through a management service agreement. USPF is an open-end real estate fund and generally invests all committed capital; as such the capital commitment of the fund is representative of the net asset value (refer to the section “Other Measures”).
The following table summarizes the activities of each of the funds managed by Sagard:
millions; except as otherwise noted) Currency
[ ] Excludes distributions which have been recalled by the fund for reinvestment, as well as distributions made by the fund due to rebalancing from increases in fund size.
[ ] Net asset value (NAV) of the fund represents the fair value of investments held within the fund, net of any liabilities, and includes the controlled and consolidated investments held through the fund presented at fair value. Refer to the section “Adjusted Net Asset Value” for a description of the Corporation’s fair value adjustments to controlled and consolidated investments.
[ ] Includes investments held by Portage Ventures I, Power Financial and IGM, through limited partnerships controlled by Power Financial, in Wealthsimple, which represents a fair value of $0.9 billion at March 31, 2023 (same as at December 31, 2022).
[4] On April 21, 2022, Sagard MidCap II disposed of its last investment.
[5] Total funded commitment represents the net cash funded for portfolio investments and fund expenses since inception, excluding amounts that have been recalled by the fund. The unfunded commitment of Sagard Credit Partners I and Sagard Healthcare Partners includes amounts distributed of $270 million and $110 million, respectively, which are recallable by the fund.
Portage, a global fintech and financial services investment platform within Sagard, had assets under management of US$2.1 billion (C$2. billion) at March 31, 2023 (same as at December 31, 2022), including unfunded commitments and an investment in Wealthsimple, a consolidated subsidiary. Portage’s mission is to empower entrepreneurs reshaping financial services and its team partners with ambitious companies across all stages, through Portage Ventures and Portage Capital Solutions. Portage has also sponsored a special purpose acquisition company, Portage Fintech Acquisition Corporation.
Portage Ventures is a global fintech venture capital investment strategy dedicated to supporting fintech innovators in insurance, consumer & small and medium business finance, wealth & asset management, and fintech enablers. Through its funds, Portage Ventures has invested in more than 90 fintech companies and investment funds. The Corporation, through investments held by Power Financial, together with Lifeco, IGM and Sagard, are anchor investors in the Portage Ventures I, Portage Ventures II and Portage Ventures III funds.
Portage Ventures I held investments of $122 million at March 31, 2023 ($129 million at December 31, 2022), excluding the investment in Wealthsimple, a consolidated subsidiary discussed below.
Portage Ventures II had total capital commitments of $ 27 million at March 31, 2023, of which Sagard has committed $20 million and Power Financial, Lifeco and IGM have each committed $33 million, for a total of $119 million. At March 31, 2023, the fair value of Portage Ventures II’s investment portfolio was $797 million ($ 10 million at December 31, 2022).
Portage Ventures III had total capital commitments of US$ million at March 31, 2023, of which Sagard committed US$1 million and Lifeco and IGM have committed US$ 9 million and US$2 million, respectively. At March 31, 2023, the fair value of Portage Ventures III’s investment portfolio was $2 3 million (US$19 million), ($23 million (US$17 million) at December 31, 2022).
In July 2022, Portage launched Portage Capital Solutions, a capital partner for fintech and financial services businesses which aims to deliver flexible equity capital solutions and resources to later-stage fintech and financial services companies, and will generally target investments over $ 0 million. Portage Capital Solutions commenced fundraising efforts in the third quarter of 2022. In the first quarter of 2023, Portage Capital Solutions completed its first warehouse investment. At March 31, 2023, the fair value of the fund’s investment portfolio was $ 0 million (US$37 million).
Portage launched Portage SPAC in the second quarter of 2021, a special purpose acquisition company focused on fintech and financial services opportunities sponsored by PFTA I LP, an affiliate of Sagard. On July 21, 2021, Portage SPAC successfully completed an initial public offering of 2 .9 million units at a price of US$10.00 per unit of PFTA, raising gross proceeds of US$2 9 million, including the exercise of the over-allotment option granted to underwriters of the offering. Since July 21, 2021, the units have been listed on the Nasdaq exchange and trade under the ticker symbol “PFTAU”. Each unit consists of one Class A ordinary share of PFTA and one-third of one redeemable warrant. Sagard indirectly holds a % economic interest in PFTA through Class B shares and private warrants. Sagard has determined that it has significant influence over PFTA through PFTA I LP, and accounts for its interest as an associate using the equity method.
Portage SPAC is focused on acquisition opportunities in industries that complement the platform’s industry knowledge and capitalize on its ability to source and acquire a business in the fintech or financial services ecosystem.
Sagard, under its private equity asset class, had assets under management of US$2. billion at March 31, 2023 (US$2. billion at December 31, 2022), including unfunded commitments and an investment in a controlled subsidiary, managed under three strategies including Sagard Private Equity Canada, Sagard Midcap (Europe), and Sagard NewGen (Europe).
Sagard Private Equity Canada is a private equity strategy investing in the Canadian middle market, with a focus on business and financial services, as well as manufacturing. At March 31, 2023, SPEC had total capital commitments of $ 0 million, of which Sagard and Lifeco have committed $1 million and $ 0 million, respectively.
Sagard MidCap is a European private equity investment strategy which invests in middle-market business services, healthcare, food & consumer, and industrial sectors.
Sagard MidCap III, a fund launched in 2013, had total committed capital of €729 million at March 31, 2023.
Sagard established and manages a special purpose co-investment vehicle, Sagard Minority Extended Participation Fund 1 S.L.P. (Sagard MEP). At March 31, 2023, Sagard MEP had total commitments of €207 million and is a continuation fund that has invested in certain portfolio companies, alongside new financial investors, formerly held by Sagard MidCap III.
Sagard MidCap IV, a fund launched in 2020, had total committed capital of € 1 million at March 31, 2023, of which the Corporation and Lifeco have committed an amount of €1 0 million and € 0 million, respectively.
Sagard NewGen, a fund launched in 2020, is a European lower-middle-market private equity investment strategy that invests in high-growth technology and healthcare industry leaders, with investment sizes typically between €10 million and € 0 million. In the first quarter of 2023, the fund completed its final close and is closed to new capital commitments. At March 31, 2023, Sagard NewGen had total committed capital of €313 million, of which the Corporation has committed an amount of € 0 million. At March 31, 2023, the fair value of Sagard NewGen’s investment portfolio, excluding an investment in a controlled subsidiary, was $2 3 million (€179 million), ($2 7 million (€171 million) at December 31, 2022).
In May 2023, subsequent to quarter-end, the Corporation has entered into agreements to sell in secondary transactions €2 million of its total commitment in Sagard NewGen, of which €1 million is currently invested. Upon close of the transactions, the Corporation’s total commitment in Sagard NewGen will decrease to €3 million.
Sagard, under the private credit asset class, had assets under management of US$2.3 billion, including unfunded commitments, at March 31, 2023 (US$2.1 billion at December 31, 2022) managed under two strategies, Sagard Credit and Sagard Senior Lending.
Sagard Credit is a non-sponsor, direct-lending strategy focused on middle-market public and private companies in North America. It provides bespoke debt solutions across the credit spectrum in first- and second-lien loans, such as unsecured and mezzanine financings, tailored to a company’s specific needs.
Sagard Credit Partners I, a fund launched in 2017, had total capital commitments of US$ 7 million at March 31, 2023, of which Sagard has committed US$100 million. Sagard Credit Partners I closed its investment period in December 2021.
Sagard Credit Partners II is a successor fund to Sagard Credit Partners I and was launched in 2020. At March 31, 2023, Sagard Credit Partners II had commitments totalling US$1,1 7 million, of which Sagard and Lifeco have each committed US$ 0 million.
Sagard also manages, through a separately managed account with Lifeco, an additional investment of up to US$200 million.
Sagard Senior Lending is a senior direct-lending strategy focused on middle-market companies in North America. It provides non-sponsor first-lien, floating-rate debt to public and private middle-market companies to help fund growth and other strategic initiatives. Sagard Senior Lending Partners, a fund launched in 2022, had total committed capital of US$31 million at March 31, 2023, of which US$237 million was callable and included a commitment of up to US$120 million from Lifeco (US$ 1 million currently callable).
Sagard also manages, through a separately managed account with Lifeco, an additional investment of up to US$2 0 million under the Sagard Senior Lending strategy at March 31, 2023.
Sagard continues its fundraising activities for Sagard Senior Lending Partners.
Sagard Healthcare, a biopharmaceutical royalties investment strategy, invests in royalties and credit backed by approved and commercialized biopharmaceutical products, diagnostics and medical devices. Assets under management in Sagard Healthcare were US$91 million, including unfunded commitments and assets managed on behalf of co-investors, at March 31, 2023 (US$911 million at December 31, 2022). Sagard Healthcare aims to accelerate the returns on innovation for owners of intellectual property, while offering investors an attractive healthcare exposure largely uncorrelated to other asset classes.
Sagard Healthcare Partners, a fund launched in 2019, had total capital commitments of US$72 million, of which Sagard has committed US$7 million.
EverWest, acquired in November 2021, is a full-service real estate investment platform operating in acquisitions, development, asset management, and property management in specific sub-markets within the United States. EverWest is headquartered in Denver, Colorado and has regional offices throughout the United States. EverWest manages assets with a fair value at March 31, 2023 of US$ .2 billion (US$ .3 billion at December 31, 2022), representing more than 130 properties.
EverWest offers a variety of investment strategies including separately managed accounts and funds. EverWest manages, through its separately managed account segment and legacy private investment vehicles, real estate assets with a fair value at March 31, 2023 of US$3. billion, which includes US$1.1 billion of assets managed on behalf of Lifeco (US$3. billion and US$1.2 billion, respectively, at December 31, 2022). EverWest’s flagship fund, USPF, is a core open-end real estate investment fund, and is included in the NCREIF Fund Index – Open-End Diversified Core Equity Index (NFIODCE). At March 31, 2023, USPF managed assets with a fair value of US$1. billion (US$1. billion at December 31, 2022).
Sagard indirectly holds a .0% controlling interest in Grayhawk, a private wealth investment platform offering independent, bespoke and client-centric investment solutions for Canadian families. Grayhawk had $1.3 billion in assets under management at March 31, 2023 (same as at December 31, 2022).
The Corporation holds the following investments in funds which are managed by Sagard, including the investments held through Power Financial:
[ ] Includes distributions which have been recalled by the fund and distributions due to rebalancing.
[ ] Includes investment in the controlled and consolidated subsidiary, Wealthsimple, at fair value.
[ ] The distributions to date and the fair value of the investment in Sagard NewGen do not include rebalancing as a result of the final close at March 31, 2023, as it occurred subsequent to the quarter-end.
Fintech Investments
Fintech investments are comprised of the Corporation’s investments, primarily held through Power Financial, in the Portage Ventures I, Portage Ventures II and Portage Ventures III funds and Wealthsimple. The Corporation’s investments in the Portage Ventures funds allow it to deepen its knowledge and accelerate the adoption of innovation within the Power group of companies, while significant investments such as Wealthsimple give direct access to novel capabilities.
At March 31, 2023, Portage Ventures I, Power Financial and IGM collectively held, through a limited partnership controlled by Power Financial, an undiluted equity interest in Wealthsimple of .2% ( .3% at December 31, 2022), representing a voting interest of % and a fully diluted equity interest of 2. %. Wealthsimple is one of Canada’s leading financial technology companies, and operates one of the country’s largest and fastest-growing digital investing platforms.
Wealthsimple continues to strengthen its presence in the marketplace and offers a suite of financial products, ranging from investing to spending, saving and tax. At March 31, 2023, Wealthsimple had 2.1 million clients, excluding tax filers, across the Canadian market with assets under administration of $21.3 billion, compared with $19. billion at March 31, 2022.
Wealthsimple also offers private asset funds, which allows retail investors to access a sector typically reserved for institutional and high-net-worth individuals. So far, a venture capital and growth equity fund has been made available to its investors. In the first quarter of 2023, through a partnership with Sagard, Wealthsimple announced the launch of Wealthsimple Private Credit, an investment fund that will primarily target investments in senior secured credit, which will be managed by Sagard’s private credit team.
The fair value of the Power group’s interest in Wealthsimple was $0.9 billion at March 31, 2023, (same as at December 31, 2022). The fair value of the Corporation’s 1 .9% equity interest in Wealthsimple, including its indirect interest held through Portage Ventures I, on a fully diluted basis, was $333 million at March 31, 2023 (same as at December 31, 2022).
At March 31, 2023, the Power group had invested $31 million in Wealthsimple (same as at December 31, 2022).
Power Sustainable is a pure-play sustainable investment manager with offices in Canada, China, and the U.S. Power Sustainable invests in companies and projects that contribute to decarbonization, social progress and quality growth, which are priorities shared by its global network of clients, asset owners, partners and employees. Power Sustainable is currently comprised of four strategies: Power Sustainable China, Power Sustainable Energy Infrastructure, Power Sustainable Lios and Power Sustainable Infrastructure Credit.
At March 31, 2023, Power Sustainable had $3. billion of assets under management ($3. billion at December 31, 2022), including unfunded commitments. Assets under management reflect the fair value of assets, net of liabilities and project debt, and includes unfunded commitments.
Composition of assets under management is as follows:
Refer to the section “Other Measures”.
The following table summarizes the strategies managed by Power Sustainable and the Corporation’s interests in each of the strategies:
March , 202
(in millions; except as otherwise noted)
[ ] Associated companies includes commitments from management as well as commitments from Lifeco of $220 million in PSEIP and $30 million in Power Sustainable Lios.
[ ] Power Sustainable China manages open-end funds and assets on behalf of clients through separate investment management agreements; as such, the capital commitment is representative of the NAV.
[ ] NAV of the fund represents the fair value of investments held within the fund, net of any liabilities and project debt, and includes the controlled and consolidated investments held through the fund presented at fair value. Refer to the section “Adjusted Net Asset Value” for a description of the Corporation’s fair value adjustments to controlled and consolidated investments.
[4] The interest in the fund is based on invested capital as of March 31, 2023. Excludes direct investments in energy assets, which have a net asset value of $ 02 million.
[5] Fund commitments of up to $219 million, of which $1 1 million is currently callable.
Power Sustainable China
Power Sustainable China invests in mainland China’s public equity markets and is focused on providing returns with low levels of volatility. Power Sustainable China selects a high-conviction portfolio based on fundamental research and seeks to invest in well-led, high-quality companies that have a competitive edge versus their peers and are aligned with sustainable, long-term trends, as well as with business models that have significant alignment with the following goals: innovation and technology, decarbonization and quality growth.
Power Sustainable China manages China-based equity investment funds and holds a Private Fund Manager (PFM) licence for domestic Chinese investors. Power Sustainable China also manages the Corporation’s capital, which is invested in mainland China’s public equity markets through a Qualified Foreign Institutional Investor (QFII) licence as well as through the Hong Kong Stock Connect program. At March 31, 2023, Power Sustainable China had $9 million of assets under management ($9 million at December 31, 2022), of which $2 0 million of assets under management are on behalf of third-party investors ($279 million at December 31, 2022). Power Sustainable China continues fundraising activities across all investment vehicles.
Power Sustainable China earns management fees ranging between 0.7 % to 1. 0% which are charged on the net asset value of funds and investments managed, as well as performance fees earned on an absolute basis or relative to the MSCI China Index of 1 % to 20%.
Power Sustainable Energy Infrastructure
At March 31, 2023, Power Sustainable Energy Infrastructure (Power Sustainable Energy) had $2, 0 million of assets under management ($2,3 0 million at December 31, 2022), including unfunded commitments and direct investments in energy infrastructure, and operated a leading North American-focused renewable energy platform with 1.9 GW of utility-scale and distributed energy assets, including MW of assets under construction, and 37 MW of assets in advanced development projects. Through its wholly owned operating companies, Potentia Renewables and Nautilus Solar, Power Sustainable Energy has a dedicated team of over 100 in-house professionals to oversee the development, construction, financing and operation of renewable energy assets across North America.
Potentia Renewables: Power Sustainable holds a 100% interest in Potentia, a renewable energy generation company, which is a fully integrated developer, operator and manager of solar and wind energy assets, active in North America.
Nautilus Solar: Power Sustainable holds a 100% interest in Nautilus, a company headquartered in New Jersey, U.S. that acquires, develops, finances and manages distributed solar projects across community, municipal/utility-scale, commercial and industrial markets.
Power Sustainable Energy actively manages investments through PSEIP and through direct investments. Power Sustainable Energy earns management fees of 0. 0% to 1.00% charged on the net asset value of PSEIP as well as a carried interest of 1 %. Power Sustainable Energy also earns management fees of 0. % charged on the net asset value of direct investments.
At March 31, 2023, PSEIP had $2.0 billion of assets under management ($1.9 billion at December 31, 2022), including unfunded commitments, throughout North America. At March 31, 2023, PSEIP had total capital commitments of $1. billion dedicated to the renewable energy sector, including a total commitment of $ 0 million from Power Sustainable and $220 million from Lifeco.
In the first quarter of 2023, PSEIP invested $99 million in multiple solar and wind portfolios. At March 31, 2023, the NAV of PSEIP was $1,1 9 million ($1,03 million at December 31, 2022).
Power Sustainable Energy had $ 02 million of assets under management through direct investments in projects under development and in operation in North America at March 31, 2023 ($391 million at December 31, 2022). These direct investments have a combined 3 MW of solar and wind energy assets, including 30 MW of assets under construction, and 119 MW of assets in advanced development projects.
At March 31, 2023, the total assets on a consolidated basis of PSEIP and direct investments were $3. billion ($3. billion at December 31, 2022).
Power Sustainable Lios is a specialized North American agri-food private equity investment platform supporting the sustainability transformation occurring within our food system. Lios Fund I, its inaugural fund, invests in growth-oriented, mid-market companies across the food value chain in North America to drive positive and sustainable change. At March 31, 2023, Lios Fund I had total capital commitments of up to $219 million, of which $1 1 million is currently callable by the fund and includes a commitment from Lifeco of $30 million.
On March 9, 2023, Power Sustainable announced the launch of its Global and European infrastructure credit platforms. These platforms will target global investments in energy, transportation, social, digital and other sustainable infrastructure. The Global platform, based in Miami, will target sub-investment-grade infrastructure investments. The European platform, based in London, will target both investment-grade and sub-investment-grade infrastructure investments across the U.K. and Europe. The platforms will seek to support sustainable assets, portfolios and operating companies with tailored financing solutions. Power Sustainable expects to commence fundraising in the second half of 2023.
The Corporation holds the following investments in each of the strategies managed by Power Sustainable: March , 202 December , 2022 (in millions of Canadian dollars)
[ ] The fair value of the investments at March 31, 2023 includes $ 2 million held in cash ($ 3 million at December 31, 2022 net of unsettled transactions).
[ ] Investments to date includes $17 million invested in the Power Sustainable China platform since 200 to fund expenses ($1 0 million at December 31, 2022). The increase in the first quarter of 2023 primarily relates to the funding of a performance fee.
[ ] Includes the Corporation’s share of investments in controlled and consolidated subsidiaries held through PSEIP at fair value. Investments to date include amounts previously held through direct investments which were transferred to PSEIP in 2021 and in the third quarter of 2022.
[4] Includes the direct investments in energy infrastructure at fair value. Investments to date include funding related to the acquisitions of Potentia and Nautilus and related platform expenses prior to the establishment of Power Sustainable Energy Infrastructure.
Other investments and standalone businesses includes the Corporation’s investments in investment and hedge funds as well as the following equity investments in standalone businesses which are managed to create and realize value over time.
Peak: Sagard held a 2. % equity interest and a 0% voting interest in Peak at March 31, 2023. Peak designs, develops and commercializes sports equipment and apparel for ice hockey and lacrosse under iconic brands including Bauer. The Corporation’s investment is accounted for using the equity method.
LMPG: Power Sustainable, through Power Sustainable Energy, held a controlling interest of 9. % at March 31, 2023 (same as at December 31, 2022) in LMPG, an internationally recognized designer, developer, and manufacturer of a wide range of high-performance and sustainable specification-grade LED solutions for commercial, institutional, and urban environments.
On February 1 , 2023, LMPG announced the acquisition of Architectural Lighting Works (ALW), a privately owned, innovative interior and exterior architectural LED lighting solutions provider. ALW produces a diverse selection of linear, architectural decorative, cylinder and acoustic lighting products for commercial, institutional, corporate, and health care environments in North America.
Lion Electric (NYSE: LEV) (TSX: LEV): Power Sustainable, through Power Sustainable Energy, held a 3 % equity interest at March 31, 2023 (3 % at December 31, 2022) in Lion Electric. An innovative manufacturer of zero-emission vehicles, Lion Electric creates, designs and manufactures all-electric Class to Class commercial urban trucks and all-electric buses and minibuses for the school, paratransit and mass transit segments. Lion designs, builds and assembles many of its vehicles’ components, including chassis, battery packs, truck cabins and bus bodies.
At March 31, 2023, Power Sustainable also held 9, 2, 19 warrants. The fair value of the warrants was $ million at March 31, 2023 ($9 million at December 31, 2022).
The Interim Consolidated Financial Statements of the Corporation have been prepared in accordance with International Accounting Standard 3 Interim Financial Reporting (IAS 3 ) and are presented in Canadian dollars.
Consolidated financial statements present, as a single economic entity, the assets, liabilities, revenues, expenses and cash flows of the parent company and its subsidiaries. The consolidated financial statements present the financial results of Power Corporation (parent) and its subsidiaries after the elimination of intercompany balances and transactions.
The financial statements of the Corporation include the consolidated results of Power Financial which include the results of Lifeco, IGM, Wealthsimple and the Portage Ventures I, Portage Ventures II and Portage Ventures III funds, which are controlled by Power Financial.
Power Financial’s investment in GBL is held through Parjointco. Parjointco is a holding company jointly controlled by Power Financial and the Frère Group, and is accounted for using the equity method.
Under the equity method, the investment is initially recognized at cost and adjusted thereafter for changes in the share of net earnings (loss) and other comprehensive income (loss). The investment is reduced by the amount of dividends received.
The investment platforms manage and operate alternative asset investment funds in which third-party investors, the Corporation and associated companies can participate. The Corporation controls a fund when it is exposed, or has rights, to variable returns from its involvement with the fund and has the ability to affect those returns through its power to direct the relevant activities of the fund.
The following table summarizes the accounting presentation for the Corporation’s holdings:
Fair value through profit or loss (FVPL) [ ] Investments are marked to market through earnings and earnings include dividends received
impairment
Reversed if there is evidence the investment has recovered its value
Fair value through other comprehensive income (FVOCI)
The investments are marked to market through other comprehensive income (OCI)
Realized gains or losses on disposal remain permanently in equity and are transferred from OCI to retained earnings
Earnings consist of dividends received
At March 31, 2023, the Corporation’s main holdings were as follows:
[ ] Investments held by the Corporation through Power Financial.
[ ] IGM also holds a 2. % interest in Lifeco.
[ ] Canada Life also holds a 3.9% interest in IGM.
[4] Held through Parjointco, a jointly controlled corporation ( 0%). Parjointco holds a controlling interest in GBL.
[5] During the first quarter of 2023, management of Sagard made an additional investment in SHMI and acquired an interest of 1. %. SHMI also has a long-term incentive program pursuant to which certain key members of management have received, or will receive in the future, compensation in the form of equity of SHMI vesting over a -year period. At March 31, 2023, management of Sagard held a 1 .0% interest in SHMI. Lifeco also holds a 7.0% interest in SHMI.
[6] Portage Ventures I and IGM also hold interests of 10. % and 29.9%, respectively, in Wealthsimple (see also the section “Wealthsimple”).
[ ] Lifeco and IGM also hold equal interests of 1 % in Portage Ventures I.
[8] Power Financial holds a 7.7% interest, Sagard holds a .7% interest, and Lifeco and IGM also hold equal interests of 7.7% in Portage Ventures II.
[ ] Lifeco and IGM also hold interests of 9.0% and .0%, respectively, in Portage Ventures III.
[ ] Lifeco also holds a 12.3% interest in Sagard Private Equity Canada.
[ ] Lifeco also holds a .1% interest in Sagard MidCap IV.
[ ] Lifeco also holds a 4. % interest in Sagard Credit Partners II.
[ ] Lifeco also holds a 1 .9% interest in PSEIP.
At March 31, 2023, Parjointco’s main holdings were as follows:
The following table summarizes the classification of the investments held by the controlled and consolidated funds managed by the investment platforms:
[ ] Excludes investment in Wealthsimple which is controlled and consolidated by the Corporation.
[ ] Excludes an investment in a controlled and consolidated subsidiary.
This basis of presentation should be read in conjunction with the Basis of presentation and summary of material accounting policies (Note 2), Adoption of IFRS 17, Insurance Contracts and IFRS 9, Financial Instruments (Note 3) and Investments (Note ) of the Interim Consolidated Financial Statements, and the following notes to the Corporation’s 2022 Consolidated Financial Statements:
Investments in jointly controlled corporations and associates (Note 7);
Goodwill and intangible assets (Note 10); and
Non-controlling interests (Note 20).
This section presents:
The “Consolidated Statements of Earnings in accordance with IFRS”; and
A discussion of the contributions to Power Corporation of its operating subsidiaries (Lifeco and IGM) and GBL, which are held through Power Financial, the contribution of the Corporation’s alternative asset investment platforms and the Corporation’s other investments and standalone businesses to the net earnings and adjusted net earnings of Power Corporation.
Adjusted net earnings is a non-IFRS financial measure. Refer to the section “Non-IFRS Financial Measures” for a description and reconciliation of IFRS and non-IFRS financial measures.
The Corporation’s reportable segments include Lifeco, IGM Financial and GBL, which represent the Corporation’s investments in publicly traded operating companies, as well as the holding company. These reportable segments, in addition to the asset management activities, reflect Power Corporation’s management structure and internal financial reporting. The Corporation evaluates its performance based on the operating segment’s contribution to earnings.
The holding company comprises the corporate activities of the Corporation and Power Financial, on a combined basis, and presents the investment activities of the Corporation. The investment activities of the holding company, including the investments in Lifeco, IGM and controlled entities within the alternative asset investment platforms, are presented using the equity method. The holding company activities present the holding company’s assets and liabilities, including cash, investments, debentures and non-participating shares. The discussions included in the sections “Financial Position” and “Cash Flows” present the segmented balance sheet and cash flow statement of the holding company, which are presented in Note 23 of the Interim Consolidated Financial Statements, and reconciliations of these statements are provided throughout this MD&A.
Power Corporation’s consolidated statements of earnings for the three months ended March 31, 2023 are presented below. The Corporation’s reportable segments include Lifeco, IGM and GBL, as well as the holding company. This table reflects the contributions to the net earnings attributable to Power Corporation’s participating shareholders from its reportable segments and Sagard and Power Sustainable, the Corporation’s alternative asset investment platforms, which include controlled and consolidated investment funds and investments, and the Corporation’s other investments and standalone businesses.
[ ] “Alternative Asset Investment Platforms and Other” is comprised of the Corporation’s alternative asset investment platforms, which include consolidated investment funds, as well as the investment activities held through Power Financial including Portage Ventures I, Portage Ventures II and Wealthsimple, and the Corporation’s other investments and standalone businesses.
[ ] The results presented for Lifeco and IGM are as reported by each. The Effect of consolidation includes the elimination of intercompany transactions, the application of the Corporation’s accounting method for investments under common control, and reflects adjustments in accordance with IAS 39 for IGM for comparative periods presented prior to the Corporation’s adoption of IFRS 9 on January 1, 2023. The contribution from Lifeco, IGM, GBL and Alternative Asset Investment Platforms and Other to net earnings attributable to participating shareholders of the Corporation includes the effect of consolidation, and represents the contribution to the holding company.
[3] Includes net investment income and change in fair value through profit or loss included in the net investment result on the consolidated statements of earnings. As a holding company, the Corporation evaluates the performance of each segment based on its contribution to net and adjusted net earnings attributable to participating shareholders. A discussion of the results of Lifeco, IGM and GBL is provided in the section “Contribution to net earnings and adjusted net earnings” below.
This section details the contribution to the net earnings and adjusted net earnings attributable to Power Corporation’s participating shareholders from Lifeco, IGM, GBL and Sagard and Power Sustainable, the Corporation’s alternative asset investment platforms, which include the contribution from controlled and consolidated investments, and the Corporation’s other investments and standalone businesses. The corporate operations from Power Corporation and Power Financial are presented on a combined basis.
[ ] Adjusted net earnings is a non-IFRS financial measure. Refer to the section “Non-IFRS Financial Measures”. For a reconciliation of Lifeco, IGM, and Sagard and Power Sustainable’s non-IFRS adjusted net earnings to their net earnings, refer to the sections “Lifeco”, “IGM Financial”, and “Sagard and Power Sustainable” below which detail the contribution to net earnings and adjusted net earnings of each.
[ ] As reported by Lifeco, IGM and GBL.
[ ] See table below for details on Effect of consolidation.
[4] Consists of earnings (losses) of the Corporation’s investment platforms including investments held through Power Financial.
[5] On January 12, 2023, the Corporation and IGM completed a transaction in which the interest in ChinaAMC was combined under I GM. The Corporation sold its 13.9% interest in ChinaAMC to IGM and no longer holds a direct interest in ChinaAMC. Refer to the section “Adjustments” below.
[6] See the section “Adjustments” below, including details on Effect of consolidation.
[ ] Attributable to participating shareholders.
Effect of consolidation reflects:
The elimination of intercompany transactions;
The application of the Corporation’s accounting method for investments under common control to the reported net earnings of the publicly traded operating companies, which include:
i) An adjustment related to Lifeco’s investment in PSEIP; and
ii) An allocation of the results of the fintech portfolio, including Wealthsimple, Portage Ventures I, Portage Ventures II and Portage Ventures III, to the contributions from Lifeco and IGM based on their respective interest; and
Adjustments in accordance with IAS 39 for IGM and GBL for comparative periods presented prior to the Corporation’s adoption of IFRS 9 on January 1, 2023.
The following table summarizes the effect of consolidation on adjusted net earnings by nature for Lifeco, IGM and GBL:
Three months ended
Application of the Corporation’s accounting method on investments under common control and other
Application of the Corporation’s accounting method on investments under common control
[ ] Adjustments for IAS 39 are included in the comparative periods, prior to the adoption of IFRS 9 by the Corporation on January 1, 2023.
Net earnings
$313 million or $0. 7 per share, compared with $ 2 million or $1.2 per share in the corresponding period in 2022, a decrease of 3.3% on a per share basis, and $ 9 million or $0.1 per share in the fourth quarter of 2022.
Adjusted net earnings
$ 1 million or $0.77 per share, compared with $ 2 million or $0. per share in the corresponding period in 2022, an increase of 1 % on a per share basis, and $37 million or $0. 7 per share in the fourth quarter of 2022.
Contribution to net earnings and adjusted net earnings from Lifeco IGM and GBL Contribution to net earnings of $ 3 million, compared with $1,0 3 million in the corresponding period in 2022, a decrease of .7%, and $ 3 million in the fourth quarter of 2022.
Contribution to adjusted net earnings of $ 2 million, compared with $ 13 million in the corresponding period in 2022, an increase of 11.3%, and $72 million in the fourth quarter of 2022.
A discussion of the results of the Corporation is provided in the sections “Lifeco”, “IGM Financial”, “GBL”, “Sagard and Power Sustainable”, “Other investments and standalone businesses”, “Corporate operations”, and “Adjustments” below.
[ ] Power Financial’s average direct ownership in Lifeco was .0% for the quarter ended March 31, 2023 ( % in the corresponding period in 2022).
[ ] The Effect of consolidation includes the elimination of intercompany transactions and the application of the Corporation’s accounting method for investments under common control including an adjustment for Lifeco’s investment in PSEIP and an allocation of the results of the fintech portfolio.
[ ] Refer to the section “Adjustments” below for details of Effect of consolidation.
Adjusted and net earnings per share as reported by Lifeco
[ ] Attributable to Lifeco common shareholders.
[ ] Defined as “base earnings per common share” by Lifeco, a non-IFRS ratio; refer to Part B of this MD&A. Effective January 1, 2023, with the adoption of IFRS 17, Lifeco refined the definition of base earnings for an improved representation of Lifeco’s underlying business performance, as well as for consistency and comparability with financial services industry peers. The comparative periods have been adjusted to reflect this change.
[ ] See the section “Adjustments” below.
Contribution to adjusted and net earnings by segments as reported by Lifeco
[ ] Attributable to Lifeco common shareholders.
[ ] Defined as “base earnings” by Lifeco, a non-IFRS financial measure; refer to Part B of this MD&A for additional details including a definition and reconciliation by segment. Effective January 1, 2023, with the adoption of IFRS 17, Lifeco refined the definition of base earnings for an improved representation of Lifeco’s underlying business performance, as well as for consistency and comparability with financial services industry peers. The comparative periods have been adjusted to reflect this change.
[ ] Described as “items excluded from base earnings” by Lifeco; refer to Part B of this MD&A.
[4] See the section “Adjustments” below.
[5] Refer to Part B of this MD&A for more details, including a definition of these Adjustments.
Net earnings
$ 9 million or $0. per share, compared with $1,33 million or $1. 3 per share in the corresponding period in 2022, a decrease of .2% on a per share basis, and $ 2 million or $0. per share in the fourth quarter of 2022.
Adjusted net earnings
$ 0 million or $0. 7 per share, compared with $712 million or $0.7 per share in the corresponding period in 2022, an increase of 1 % on a per share basis, and $ 9 million or $0.93 per share in the fourth quarter of 2022.
Net earnings in the three-month period ended March 31, 2023 decreased by $210 million to $233 million, compared with the corresponding quarter in 2022. Adjusted net earnings in the three-month period ended March 31, 2023 were $27 million, an increase of $ million compared with the corresponding quarter in 2022, primarily due to:
More favourable group insurance long-term disability morbidity experience, pricing actions in the Group Life & Health business and higher earnings on surplus.
Partially offset by unfavourable individual insurance mortality experience.
Adjusted net earnings in the three-month period ended March 31, 2023 excluded Adjustments of negative $ million, compared with Adjustments of positive $219 million in the corresponding quarter in 2022. Market experience losses were $ 3 million in the first quarter of 2023 due to declining interest rates, compared with market experience gains of $22 million in the corresponding quarter in 2022 due to rising interest rates.
Net earnings in the three-month period ended March 31, 2023 increased by US$27 million (C$39 million) to US$11 million (C$1 1 million), compared with the corresponding quarter in 2022. Adjusted net earnings were US$1 9 million (C$200 million) in the three-month period ended March 31, 2023, an increase of US$37 million (C$ million), compared with the corresponding quarter in 2022, primarily due to:
An increase of US$ 7 million from the Empower business units to an adjusted net earnings of US$1 million, primarily due an increase of US$ 1 million related to the Prudential acquisition, as well as higher contributions from investment experience and realized synergies from the MassMutual acquisition. These items were partially offset by lower fee income driven by lower average equity markets.
Partially offset by
A decrease of US$19 million in the Asset Management business unit to an adjusted net loss of US$20 million, primarily due to lower asset-based fee income, partially offset by higher net investment income and lower volume-driven expenses; and
A decrease of US$11 million in the Corporate business unit to an adjusted net loss of US$17 million, primarily due to lower net investment income.
Adjusted net earnings in the three-month period ended March 31, 2023 excluded Adjustments of negative US$3 million (C$ 9 million), compared with negative US$2 million (C$32 million) in the corresponding quarter in 2022. The increase in Adjustments was primarily due to higher integration costs related to the Prudential acquisition partially offset by the nonrecurrence of integration costs related to the acquisition of Personal Capital incurred in the corresponding quarter in 2022 in the Empower business units.
Net earnings in the three-month period ended March 31, 2023 decreased by $ 0 million to $ 0 million, compared with the corresponding quarter in 2022. Adjusted net earnings in the three-month period ended March 31, 2023 were $17 million, an increase of $2 million compared with the corresponding quarter in 2022, primarily due to:
Favourable insurance and annuity results in the U.K. driven by a favourable reinsurance settlement gain as well as favourable impact of changes to certain tax estimates.
Partially offset by less favourable insurance and annuity results in Ireland as a result of higher mortality claims experience.
Adjusted net earnings in the three-month period ended March 31, 2023 excluded Adjustments of negative $13 million, compared with Adjustments of positive $3 million in the corresponding quarter in 2022. The decrease in Adjustments was primarily due to the Insurance & Annuities business unit as a result of negative returns on non-fixed income assets and declining risk-free interest rates in the three-month period ended March 31, 2023, compared with positive contributions from higher than expected non-fixed income asset returns and rising interest rates in the corresponding quarter in 2022.
Net earnings in the three-month period ended March 31, 2023 decreased by $ 0 million to $1 million, compared with the corresponding quarter in 2022. Adjusted net earnings in the three-month period ended March 31, 2023 were $1 7 million, a decrease of $1 million compared with the corresponding quarter in 2022, primarily due to:
Unfavourable mortality experience in the U.S. life business.
Partially offset by growth in the structured business and improved property catastrophe product margins.
Adjusted net earnings in the three-month period ended March 31, 2023 excluded Adjustments of positive $27 million, compared with positive $ 3 million in the corresponding quarter in 2022, driven by lower than expected net investment results as a result of declining interest rates in 2023, compared with rising interest rates in the corresponding quarter in 2022 and inflation impacts. A
Adjustments are items excluded from net earnings in the determination of adjusted net earnings by Lifeco’s management. Refer to the further discussion above in each of Lifeco’s operating segments.
In the first quarter of 2023, Adjustments with a negative earnings impact of $213 million after tax consist of:
Market experience losses of $1 million after tax ($209 million pre-tax);
Restructuring and integration costs of $19 million after tax ($2 million pre-tax) in the United States segment; and
Amortization of acquisition-related finite life intangibles of $33 million after tax ($ million pre-tax).
Partially offset by:
Positive earnings impact from assumption changes and management actions of $7 million after tax ($9 million pre-tax).
In the first quarter of 2022, Adjustments with a positive earnings impact of $ 22 million after tax consisted of:
Market experience gains of $ million after tax ($ million pre-tax).
Partially offset by:
Negative earnings impact from assumption changes and management actions of $1 million after tax ($19 million pre-tax);
Restructuring and integration costs of $12 million after tax ($17 million pre-tax) in the United States segment;
Transaction costs of $7 million after tax ($ million pre-tax) related to the acquisition of the full-service retirement business of Prudential, as well as acquisitions in the Europe segment; and
Amortization of acquisition-related finite life intangibles of $27 million after tax ($3 million pre-tax).
In the fourth quarter of 2022, Adjustments with a negative earnings impact of $ 17 million after tax consisted of: Market experience losses of $3 million after tax ($393 million pre-tax);
Negative earnings impact from assumption changes and management actions of $29 million after tax ($ million pre-tax);
Restructuring and integration costs of $32 million after tax ($ 3 million pre-tax) in the United States segment;
Transaction costs of $ million after tax ($ million pre-tax) related to acquisitions in the Europe segment; and
Amortization of acquisition-related finite life intangibles of $2 million after tax ($37 million pre-tax).
Partially offset by:
A positive impact from tax legislative changes of $ 3 million.
The information above has been derived from Lifeco’s interim and most recent Annual MD&A; see Part B of this MD&A for additional information on Lifeco’s interim results. Lifeco’s interim and most recent Annual MD&A are available under its profile on SEDAR (www.sedar.com).
[ ] Power Financial’s average direct ownership in IGM was 2.2% for the quarter ended March 31, 2023 ( 1.7% in the corresponding period in 2022).
[ ] The Effect of consolidation includes the elimination of intercompany transactions, the application of the Corporation’s accounting method for investments under common control including an allocation of the results of the fintech portfolio and reflected adjustments in accordance with IAS 39 for comparative periods presented prior to the Corporation’s adoption of IFRS 9 on January 1, 2023. The Effect of consolidation in the comparative periods has been restated for the application of IFRS 17.
[ ] Refer to the section “Adjustments” below for details of Effect of consolidation.
[ ] Available to
[ ] Adjusted net earnings per share is a non-IFRS ratio; refer to Part C of this MD&A.
[ ] See the section “Adjustments” below.
[4] Described as “Other items” by IGM; refer to Part C of this MD&A.
[ ] Debt and interest expense is allocated to each segment based on IGM’s assessment of: i) capacity to service the debt, and ii) where the debt is being serviced.
[ ] Available to IGM common shareholders.
[ ] Adjusted net earnings is a non-IFRS financial measure; refer to Part C of this MD&A for additional details including a definition and reconciliation. IGM does not allocate Adjustments to segments.
[4] Described as “Other items” by IGM; refer to Part C of this MD&A.
$3 1 million or $1. 0 per share, compared with $219 million or $0.91 per share in the corresponding period in 2022, an increase of 7 % on a per share basis, and $22 million or $0.9 per share in the fourth quarter of 2022. Net earnings in the first quarter of 2023 include IGM’s gain of $17 million recognized on the sale of a portion of its interest in Lifeco to the Corporation. The Corporation has eliminated this gain on consolidation.
Adjusted net earnings
$20 million or $0. 7 per share, compared with $219 million or $0.91 per share in the corresponding period in 2022, a decrease of % on a per share basis, and $22 million or $0.9 per share in the fourth quarter of 2022.
On January 1, 201 , IGM adopted IFRS 9, Financial Instruments. Power Corporation deferred the adoption of IFRS 9 to January 1, 2023. The contribution to Power Corporation for comparative periods presented prior to the Corporation’s adoption on January 1, 2023 includes adjustments to reverse the impact of the application of IFRS 9 by IGM.
Adjusted net earnings exclude Adjustments of a positive earnings impact of $17 million in the three-month period ended March 31, 2023. There were no Adjustments in the corresponding quarter in 2022. These Adjustments are not allocated to segments. The following is a summary of each segment’s net earnings:
Net earnings decreased by $1 million to $107 million in the three-month period ended March 31, 2023, compared with the corresponding quarter in 2022. Net earnings of Wealth Management includes $3 million of net earnings of IPC, which IGM has presented as discontinued operations. The decrease in net earnings is mainly related to a decrease in net earnings of IG Wealth Management of $13 million, primarily due to:
A decrease in other financial planning revenues of $1 million to $2 million, primarily due to lower earnings from mortgage banking operations and lower revenues from the distribution of insurance products;
A decrease in income from product and program fees of $9 million to $219 million, primarily due to the decrease in average assets under management of 3. %. The average product and program fee rate for the three-month period was basis points of average assets under management, compared with .0 basis points in 2022, reflecting price reductions in certain funds and changes in product mix; and
A decrease in income from advisory fees of $2 million to $291 million, primarily due to the decrease in average assets under advisement of 1. %, partially offset by an increase in the advisory fee rate. The average advisory fee rate for the three-month period was 102. basis points of average assets under advisement, compared with 101.9 basis points in 2022.
Partially offset by:
An increase in net investment income and other of $ million to $3 million. Net investment income and other primarily consists of unrealized gains or losses on investments in proprietary funds in the first quarter, and investment income earned on cash and cash equivalents and securities and other income not related to IG Wealth Management’s core business. It also includes a charge from the Strategic Investments and Other segment for the use of unallocated capital;
A decrease in sub-advisory expenses of $2 million to $ 3 million, primarily due to lower assets under management;
A decrease in advisory and business development expenses of $2 million to $223 million in the three-month period which includes compensation paid to advisors, the majority of which varies directly with assets or sales levels. Other advisory and business development expenses decreased by $7 million to $ 7 million in the three-month period, primarily due to decreases in other advisor program expenses and distribution of insurance products, partially offset by an increase in asset-based and sales-based compensation. Asset-based compensation increased by $1 million to $1 million, primarily due to deferred selling commission units maturing and other compensation changes partially offset by a decline in assets under advisement. Sales-based compensation payments are based upon the level of new assets contributed to client accounts and are capitalized and amortized as they reflect incremental costs to obtain a client contract. Sales-based compensation increased by $ million to $22 million; and
A decrease in income taxes of $ million to $3 million.
The Asset Management segment includes the fees received from IGM’s mutual funds, Wealth Management segment and third parties for investment management services.
Net earnings decreased by $ million to $ million in the three-month period ended March 31, 2023, compared with the corresponding quarter in 2022, primarily due to:
A decrease in net asset management fees, which is asset management fees offset by dealer compensation expenses, of $11 million to $1 3 million, mainly due to a decrease in net asset management fees – third party of $10 million, due to a 7.9% decrease in average assets under management, offset by an increase in the net asset management fee rate.
Mackenzie’s net asset management fee rate was .2 basis points for the three months ended March 31, 2023, compared with 3.2 basis points in 2022. The increase in rate was mainly driven by lower selling commissions. Management fees – Wealth Management decreased by $1 million to $2 million. The decrease in management fees was primarily due to a % decrease in average assets under management. Mackenzie’s management fee rate was 1 .1 basis points for the three months ended March 31, 2023, compared with 1 .7 basis points in 2022; and
An increase in expenses of $2 million to $11 million, primarily due to an increase in advisory and business development expenses of $3 million in the three-month period, partially offset by a decrease in operations and support expenses of $1 million. Advisory and business development expenses primarily include wholesale distribution activities which vary directly with assets or sales levels. Operations and support expenses includes costs associated with business operations, including technology and business processes, in-house investment management and product shelf management, corporate management and support functions. These expenses primarily reflect compensation, technology and other service provider expenses.
Partially offset by an increase in net investment income and other of $7 million to $ million. Net investment income and other primarily includes investment returns related to Mackenzie’s investments in proprietary funds, which are generally made in the process of launching a fund and are sold as third-party investors subscribe.
Assets under advisement (AUA) are a key performance indicator for the Wealth Management segment.
Assets under management (AUM) are the key driver of the Asset Management segment and a secondary driver of revenues and expenses within the Wealth Management segment in relation to its investment management activities. Refer to the section “Other Measures” for a definition of AUM and AUA.
assets under management and advisement were as follows:
[ ] Represents the consolidated assets under management and advisement of IGM. In the Wealth Management segment, assets under management is a component part of assets under advisement. All instances where the Asset Management segment is providing investment management services or distributing its products through the Wealth Management segment are eliminated in IGM’s reporting such that there is no double counting of the same client savings held at IGM’s operating companies.
[ ] Includes adjustment representing the elimination of double counting where business is reflected within multiple segments.
Total average assets under management and advisement were as follows:
[ ] Represents the consolidated assets under management and advisement of IGM. All instances where the Asset Management segment is providing investment management services or distributing its products through the Wealth Management segment are eliminated in IGM’s reporting such that there is no double counting of the same client savings held at IGM’s operating companies.
[ ] Includes adjustment representing the elimination of double counting where business is reflected within multiple segments.
Adjustments are items excluded from net earnings in the determination of adjusted net earnings by IGM’s management.
In the first quarter of 2023, adjusted net earnings excludes a positive impact of $17 million after tax ($179 million pre-tax) related to IGM’s sale of a portion of its investment in Lifeco to the Corporation. The Corporation has not included the amount of the gain on the sale of Lifeco in its Adjustments as this gain was eliminated on consolidation. There were no Adjustments reported by IGM in the first and fourth quarters of 2022.
The information above has been derived from IGM’s interim and most recent Annual MD&A; see Part C of this MD&A for additional information on IGM’s interim results. IGM’s interim and most recent Annual MD&A are available under its profile on SEDAR (www.sedar.com).
Three
ended (in millions of Canadian dollars)
[ ] Power Financial’s average indirect ownership in GBL was 1 .9% for the quarter ended March 31, 2023 (1 % in the corresponding period in 2022).
[ ] The Corporation adopted IFRS 9 on January 1, 2023. The contribution to the Corporation prior to January 1, 2023 includes an adjustment to account for GBL under IAS 39 as described below.
[ ] Described as “IFRS consolidated net result” in GBL’s publicly disclosed information.
Net earnings of €77 million, compared with a net loss of €12 million in the corresponding period in 2022, and a net loss of €112 million in the fourth quarter of 2022.
On January 1, 201 , GBL adopted IFRS 9, Financial Instruments. Power Corporation deferred the adoption of IFRS 9 to January 1, 2023, and applied IFRS 9 on a prospective basis. The Corporation has classified the investments held by GBL consistent with GBL’s IFRS 9 classification. GBL has classified its investments in public entities and Voodoo as fair value through other comprehensive income (FVOCI), an elective classification for equity instruments in which all fair value changes remain permanently in equity.
The investments in alternative funds and direct private equity co-investments are classified as fair value through profit or loss (FVPL). The transition requirements of IFRS 9 require that all unrealized gains and losses on investments previously classified as available for sale remain permanently in equity. Subsequent changes in fair value are recorded in earnings.
The following table presents adjustments to the contribution of GBL to Power Corporation’s earnings in accordance with IAS 39 for the comparative periods presented prior to the Corporation’s adoption of IFRS 9 on January 1, 2023:
Three months ended (in millions of Canadian dollars)
December , March ,
Partial disposal of interest in Pernod Ricard [ ] 6
Impairment charges on listed investments [2] ( )
Disposal of alternative funds and other [3]
Reversal of unrealized (gains) losses on alternative funds and other [ ]
Total
[
4
] During the fourth quarter of 2022, a portion of the investment in Pernod Ricard was disposed of, resulting in a gain. The gain was not reflected in GBL’s earnings as the investment is classified as FVOCI. Power Corporation’s share was $ 7 million and included a recovery from the reversal of a previous impairment.
[ ] Under IFRS 9, GBL classifies the majority of its investments in public entities as FVOCI, and as a result impairment charges are not recognized in earnings. The investment in Ontex has been previously impaired, resulting in an adjusted cost of € .99 per share. During the first quarter of 2022, the share price decreased to € 3, resulting in an impairment charge. The Corporation’s share was $1 million.
[ ] During the first and fourth quarters of 2022, investments held through alternative funds and other investments, classified as FVPL in accordance with IFRS 9, were disposed of, resulting in realized gains. Power Corporation’s share of the realized gains in accordance with IAS 39 was $11 million in the first quarter, and $3 million in the fourth quarter of 2022.
[4] GBL classifies investments in alternative funds as FVPL in accordance with IFRS 9, and recognized unrealized changes in fair value in earnings. Power Corporation did not recognize these unrealized fair value changes in earnings as it continued to classify these investments as available for sale in accordance with IAS 39.
GBL’s earnings includes dividends from its non-consolidated publicly listed investments, which are usually declared as follows:
Holcim (second quarter)
SGS (first quarter)
adidas (second quarter)
R E S U L T S
Umicore (second and third quarters)
Pernod Ricard (second and fourth quarters)
GEA (second quarter)
For the three-month period ended March 31, 2023, net earnings were €77 million, compared with a net loss of €12 million in the corresponding quarter in 2022. The increase in net earnings was mainly due to:
A decrease in other financial expenses of €190 million to € million in the three-month period ended March 31, 2023, compared with financial expenses of €19 million in the corresponding quarter in 2022. Other financial expenses in the first quarter of 2023 include a loss of €12 million on marking to market derivatives on convertible and exchangeable bonds issued by GBL and a negative impact of € million related to the increase in the liability to Webhelp’s minority shareholders, including the effect of discounting. In the corresponding quarter in 2022, other financial expenses in the first quarter included a gain of €72 million on marking to market derivatives on convertible and exchangeable bonds issued by GBL and a negative impact of €13 million related to the increase in the liability to Webhelp’s minority shareholders. As well, in the three-month period ended March 31, 2023, GBL recognized a net increase in the fair value of GBL Capital’s alternative funds and direct private equity co-investments not consolidated or accounted for using the equity method of €33 million, compared with a net decrease in fair value of €1 3 million in the corresponding quarter in 2022;
A decrease in other operating expenses of €19 million to € 7 million. The increase in liabilities recorded for Webhelp’s employee incentive plan was €3 million in the quarter, including the effect of discounting and vesting, compared with an increase in liabilities of € 3 million in the corresponding quarter in 2022;
An increase in the contribution from Imerys to GBL’s earnings of €1 million to a contribution to GBL of € million, compared with a contribution of € 0 million for the corresponding quarter in 2022;
A positive contribution from Sanoptis to GBL’s earnings of €7 million, acquired during the third quarter of 2022;
An increase in dividends of € million to €119 million, mainly due to an increase in the dividend received from SGS as a result of foreign exchange, partially offset by a decrease in dividends received from Mowi due to a decrease in GBL’s interest; and
A decrease in the negative contribution from gains (losses) from disposals, impairments and reversals of non-current assets of € million to a negative contribution to GBL of €1 million, compared with a net loss of € million in the corresponding quarter in 2022.
Partially offset by:
A decrease in the contribution from investments consolidated or accounted for using the equity method by GBL Capital and Sienna Investment Managers of €11 million to a negative contribution to GBL's earnings of €1 million, compared with a positive contribution of €10 million for the three-month period of 2022;
A decrease in the contribution from Piolin II S.à.r.l. to GBL’s earnings of €10 million to a negative contribution to GBL of €27 million, compared with a negative contribution of €17 million for the three-month period of 2022;
A decrease of €7 million in the contribution from Canyon to GBL’s earnings to a contribution to GBL of €1 million;
A decrease in GBL’s share in the net result of Webhelp of €3 million, to a contribution to GBL of €10 million; and
A negative contribution from Affidea, to GBL’s earnings of €3 million, acquired during the third quarter of 2022.
The average exchange rates for the three-month periods ended March 31, 2023 and 2022 were as follows:
March March
Euro/CAD .45 .4
Change %
The information above has been derived from GBL’s publicly disclosed financial information, as issued by GBL in its first quarter of 2023 press release. Further information on GBL’s results is available on its website (www.gbl.be).
Sagard and Power Sustainable comprise the results of the investment platforms, which includes income earned from asset management and investing activities. Asset management activities includes fee-related earnings (a non-IFRS financial measure, refer to the section “Non-IFRS Financial Measures”), which is comprised of management fees less investment platform expenses. Asset management activities also includes carried interest and income from other management activities. Investing activities comprises income earned on the capital invested by the Corporation (proprietary capital) in the investment funds managed by each platform and the share of earnings (losses) of controlled and consolidated subsidiaries held within the investment platforms.
Refer to the section “Alternative Asset Investment Platforms” for details and discussion related to the assets under management and fee-bearing capital of Sagard and Power Sustainable.
Income earned from investing activities (proprietary capital) is volatile in nature as it depends on many factors, including and primarily related to the timing of realizations.
Summary of Adjusted and net earnings (loss) from Sagard and Power Sustainable:
Three months ended
Contribution to Power Corporation’s:
[ ] In the second quarter of 2022, the presentation of Power Sustainable’s asset management activities was modified to separate certain activities provided by Potentia and Nautilus on behalf of PSEIP from its management activities. As well, an allocation of certain expenses is included in the Corporation's other investing activities. The comparative information has been restated to reflect these changes.
[ ] Includes management fees charged by the investment platform on proprietary capital and management of standalone businesses. Management fees paid by the Corporation are deducted from income from investing activities. In the first quarter of 2023, Sagard recognized a retroactive adjustment for management fees of $ million related to new capital committed in the final close of Sagard NewGen.
[ ] Fee-related earnings is a non-IFRS financial measure. Items excluded from fee-related earnings have been included in Other. Refer to the section “Non-IFRS Financial Measures” for a description and reconciliation. The comparative amounts have been restated in accordance with this presentation.
[ ] Net carried interest is comprised of carried interest earned, net of employee costs which are recognized over the vesting period. Carried interest is recognized based on changes in fair value of investments held within each consolidated fund, and based on carried interest earned when it is highly probable that a significant reversal will not occur with respect to unconsolidated funds. The Corporation’s share of carried interest expense payable by the fund is included in investing activities.
[4] The first quarter of 2022 included a reversal of net carried interest of $13 million, due to a decrease in the fair value of Wealthsimple in the period.
[5] Includes the Corporation’s share of earnings (losses) from Sagard’s private wealth investment platform and other asset management activities.
[6] Non-controlling interests include equity interests held in SHMI by Lifeco and management of Sagard.
[ ] The first quarter of 2023 and the fourth quarter of 2022 included net carried interest of $ million and $17 million, respectively, as a result of the increase in the net asset value of PSEIP. The fourth quarter of 2022 also included a reversal of performance fee payable due to a decline in value of investments within Power Sustainable China.
[8] Other includes development and asset management activities provided by Potentia and Nautilus on behalf of PSEIP.
Three months ended
Impairment charges on direct investments in energy infrastructure
[ ] Includes the Corporation’s share of earnings (losses) of Wealthsimple. The first quarter of 2022 included a reversal of carried interest payable of $13 million, due to a decrease in the fair value of Wealthsimple in the quarter. The net decrease in fair value of the Corporation’s investments, including its investments held through Power Financial in Portage Ventures I, Portage Ventures II, Portage Ventures III and Wealthsimple, was $ million in the three-month period ended March 31, 2023, compared with a decrease of $1 3 million in fair value in the corresponding period in 2022.
[ ] On adoption of IFRS 9 on January 1, 2023, the Corporation has classified its investments in Chinese public equities as FVOCI, an elective classification for equity instruments in which all fair value changes remain permanently in equity. Going forward, the contribution from investing activities will consist of dividend income and management and performance fee expenses. In 2022, the Corporation recognized realized losses on the disposal of investments in Power Sustainable China of $ million and $ million in the first and fourth quarters, respectively, and $13 million in impairments recorded in the first quarter due to declines in Chinese equity markets.
[ ] The first quarter of 2023 includes the Corporation’s share of carried interest expense of $9 million, which resulted from an increase in fair value of assets held in PSEIP and operating losses mainly related to seasonality. The fourth quarter of 2022 included the Corporation’s share of carried interest expense of $19 million, which resulted from an increase in fair value of assets held in PSEIP and operating losses mainly related to seasonality, partially offset by unrealized gains on derivative contracts hedging energy infrastructure projects of $10 million. The first quarter of 2022 included a gain on derivative contracts hedging energy infrastructure projects of $12 million, and excluded a charge of $10 million due to impairments on direct investments in energy infrastructure assets, recorded as an Adjustment (see the section “Adjustments” below).
[4] The first quarter of 2023 includes a charge of $33 million ($ 3 million in the fourth quarter of 2022) related to the Corporation’s share of the revaluation of noncontrolling interests liabilities which mainly resulted from an increase in fair value of assets held in PSEIP. The Corporation controls and consolidates the activities of PSEIP on a historical cost basis; however, equity interests held by third parties have redemption features and are classified as a financial liability, which are remeasured at their redemption value.
Adjustments (excluded from adjusted net earnings)
For the three-month period ended March 31, 2022, Power Sustainable recognized an impairment of $10 million on projects under construction which are included in direct investments in energy infrastructure within the Power Sustainable platform.
Other investments and standalone businesses includes the Corporation’s investments in investment and hedge funds and the share of earnings (losses) of standalone businesses.
Income earned from other investments is volatile in nature as it depends on many factors, including and primarily related to realizations.
[
] Consists mainly of foreign exchange gains or losses and interest on cash and cash equivalents.
[ ] Includes the Corporation’s share of earnings (losses) of Lion, LMPG, and Peak. The fourth quarter of 2022 included a non-cash impairment charge of $109 million after tax ($12 million pre-tax) reflecting a decline in the market value of Lion at December 31, 2022.
For the three-month period ended March 31, 2023, net earnings from other investments and standalone businesses was $1 million, compared with a net loss of $1 million in the corresponding quarter in 2022. Standalone businesses had a net loss of $ million, compared with net earnings of $ million in the corresponding quarter in 2022.
The Corporation holds an investment in Bellus Health Inc., a Canada-based late-stage biopharmaceutical company. The investment is accounted for as an associate using the equity method, with a carrying value of nil at March 31, 2023. On April 1 , 2023, subsequent to quarter-end, Bellus announced an agreement in which it will be acquired by GSK Inc. for US$1 .7 per share in cash. The Corporation expects to receive proceeds of approximately US$73 million. The transaction is subject to customary closing conditions including shareholder and regulatory approvals, and is expected to close in the third quarter of 2023.
Corporate operations include operating expenses, financing charges, depreciation and income taxes.
[ ] During the second quarter of 2022, the Corporation attached tandem share appreciation rights to certain options, which were reclassified as cash-settled share-based payments. The Corporation has entered into a total return swap agreement to manage exposure to the volatility of a portion of its cash-settled share-based payments and related liability. The first quarter of 2023 includes a net loss of $ million arising from the change in fair value of the liability, net of the gain on the remeasurement to fair value of the derivative instrument (net gain of $1 million in the fourth quarter of 2022)
[ ] Financing charges related to Power Financial were $ million in the three-month period ended March 31, 2023, same as in 2022.
The following table presents the Corporation’s share of Adjustments:
[ ] As reported by Lifeco and IGM.
[ ] The Effect of consolidation reflects i) the elimination of intercompany transactions, including the gain recognized by IGM on the sale of a portion of its interest in Lifeco to the Corporation in the first quarter of 2023; ii) the application of the Corporation’s accounting method for investments under common control to the Adjustments reported by Lifeco and IGM; iii) IGM’s share of Lifeco’s Adjustments, in accordance with the Corporation’s definition of Adjusted net earnings; and iv) adjustments in accordance with IAS 39 for IGM for comparative periods prior to the Corporation’s adoption of IFRS 9 on January 1, 2023.
ChinaAMC
On January 12, 2023, the Corporation and IGM completed a transaction in which the group’s interest in ChinaAMC was combined under IGM. The Corporation sold its 13.9% interest in ChinaAMC to IGM. As the Power group continues to hold a 27. % interest in ChinaAMC, the Corporation did not record a gain on the disposal of its interest. As a result of the transaction, the Corporation incurred transaction costs of $1 million and income taxes of $ 0 million. The Corporation has recorded these amounts as an Adjustment.
For additional information on each of Lifeco, IGM and Sagard and Power Sustainable, refer to their respective “Adjustments” sections above. Also refer to the section “Non-IFRS Financial Measures” in this MD&A.
CONSOLIDATED BALANCE SHEETS (CONDENSED)
The condensed balance sheets of Lifeco, IGM, and the combined holding company balance sheet of Power Corporation and Power Financial, as well as the alternative asset investment platforms and other, are presented below. These tables reconcile the holding company balance sheet with the condensed consolidated balance sheets of the Corporation at March 31, 2023 and December 31, 2022, which are included in Note 23 of the Interim Consolidated Financial Statements.
[ ] Includes consolidated investment funds and their controlled investments, Wealthsimple and standalone businesses.
[ ] Indirectly held through Parjointco. The holding company balance sheet includes the Corporation’s investment in GBL, which is separately presented in Note 23 of the Interim Consolidated Financial Statements.
[ ] The assets of Lifeco, IGM, and Alternative Asset Investment Platforms and Other exclude the corporate allocation of goodwill and intangible assets.
[4] The debentures and other debt instruments of controlled and consolidated investments are secured by their assets which are non-recourse to the Corporation.
[5] Lifeco’s non-controlling interests include the Participating Account surplus in subsidiaries.
[6] Non-controlling interests in Effect of consolidation represent non-controlling interests in the equity of Lifeco, IGM and controlled and consolidated investments.
The Corporation and its subsidiaries adopted IFRS 9, Financial Instruments to replace IAS 39, Financial Instruments: Recognition and Measurement on its effective date of January 1, 2023. The Corporation elected to present comparative information for certain of its financial assets, primarily those held by Lifeco, as if the classification and measurement requirements of IFRS 9 had been applied in the comparative period (IFRS 9 overlay), as permitted by the amendment to IFRS 17 published by the IASB in December 2021. Differences in asset classification under IAS 39 at December 31, 2022 and IFRS 9 at January 1, 2023 are outlined below.
Financial Assets
Bonds
Mortgage and other loans
Shares
Classification
IAS IFRS
Designated as FVPL
Classified as FVPL
Available for sale
Loans and receivables
Designated as FVPL
Available for sale
Loans and receivables
Designated as FVPL
Available for sale
Designated as FVPL
Classified as FVPL
Classified as FVPL
FVOCI
Amortized cost
Designated as FVPL
FVOCI
Amortized cost
Classified as FVPL
Classified as FVPL
Designated as FVPL
FVOCI
Amortized cost
Classified as FVPL
Classified as FVPL
FVOCI
The transition from IAS 39 to IFRS 9 results in a significantly larger portion of Lifeco’s bond and mortgage portfolios being measured at fair value under IFRS 9. Based on January 1, 2023 balances, the transition to IFRS 9 leads to 100% of Lifeco’s bond portfolio and 9% of its mortgage portfolio being measured at fair value, compared with 79% and 9%, respectively, under IAS 39, which is expected to result in greater net earnings volatility.
Total assets of the Corporation increased to $72 billion at March 31, 2023, compared with $70 billion at December 31, 2022, primarily due to market movement, new business growth as well as the impact of currency movement. Liabilities increased to $ 3.9 billion at March 31, 2023, compared with $ 3. billion at December 31, 2022, mainly due to the following, as disclosed by Lifeco:
Insurance contract liabilities increased by $3.3 billion, primarily due to market movements, partially offset by normal business movements.
Investment contract liabilities decreased by $0.2 billion, primarily due to normal business movements.
Investment and insurance contracts on account of segregated fund policyholders increased by $17.3 billion, primarily due to the combined impact of market value gains and investment income of $1 .7 billion, the impact of currency movement of $2.0 billion and net deposits of $0.9 billion, partially offset by the negative impact of non-controlling mutual fund interest of $1.3 billion.
Parts B and C of this MD&A include a discussion of the consolidated balance sheets of Lifeco and IGM, respectively.
In the holding company balance sheets shown below, Power Corporation and Power Financial are shown on a combined basis; investments in subsidiaries are presented using the equity method. This presentation assists the reader by identifying changes in the combined holding company balance sheet of Power Corporation and Power Financial, and presents the investment activities, as well as the holding company’s assets and liabilities, including cash, debentures and nonparticipating shares.
[ ] Cash equivalents include $ 07 million ($3 million at December 31, 2022) of fixed income securities with maturities of more than three months. In accordance with IFRS, these are classified as investments in the Interim Consolidated Financial Statements.
[ ] Indirectly held through Parjointco.
[ ] Includes Power Financial’s investments in Portage Ventures I, Portage Ventures II and Wealthsimple, presented using the equity method.
[4] On January 12, 2023, the Corporation and IGM completed a transaction in which the group’s interest in ChinaAMC was combined under IGM. Refer to the section “ChinaAMC” in the section “Overview”.
[5] Includes $ 3 million of dividends declared in the first quarter by IGM (same as at December 31, 2022) and received by Power Financial on April 2 , 2023.
[6] Includes Power Financial’s debentures of $2 0 million at March 31, 2023 (same as at December 31, 2022).
[ ] Perpetual preferred shares issued by Power Financial.
The following table shows the reconciliation of the investments held by the holding company, not accounted for using the equity method or consolidated, from the original measurement category under IAS 39 to the new measurement category under IFRS 9 on January 1, 2023.
Classification
Investments in shares IAS IFRS
Alternative asset investment platforms
Sagard
Sagard Private Equity Canada
Sagard MidCap II
Sagard MidCap IV
Sagard Credit Partners
Sagard Credit Partners II
Sagard Healthcare Partners
Power Sustainable
Power Sustainable China (public equities)
Other investments
Classified as FVPL
Available for sale
Available for sale
Classified as FVPL
Classified as FVPL
Classified as FVPL
Available for sale
Available for sale
Classified as FVPL
Classified as FVPL
Classified as FVPL
Classified as FVPL
Classified as FVPL
Classified as FVPL
FVOCI [ ]
Classified as FVPL
[ ] The Corporation has classified its investments in China public equities as FVOCI, an elective classification for equity instruments in which all fair value changes will remain permanently in equity.
Cash and cash equivalents held by the Corporation and Power Financial amounted to $1, 3 million at March 31, 2023, compared with $1,277 million at the end of December 2022 (see “Holding Company Statements of Cash Flows” below for details).
The cash and cash equivalents held by Sagard and Power Sustainable including Power Sustainable China amounted to $17 million at March 31, 2023 ($19 million at December 31, 2022) and are included in the carrying amount of the investment platforms.
[
The tables below present a continuity of the investments in Lifeco, IGM and GBL, which are presented using the equity method for the purposes of the holding company presentation. The carrying value of the investments in Lifeco, IGM and GBL, accounted for using the equity method, increased to $22,170 million at March 31, 2023, compared with $21, 00 million at December 31, 2022:
[
] The carrying value of the investments in Lifeco and IGM have been restated to reflect the proportionate share of Lifeco's impact on total equity on January 1, 2022 in connection with the adoption of IFRS 17 and IFRS 9. Upon adoption of IFRS 9, the Corporation elected to present comparative information for certain of Lifeco's financial assets as if the classification and measurement requirements of IFRS 9 had been applied in the comparative period, on an instrument-by-instrument basis, as permitted by the amendment to IFRS 17 published by the IASB in December 2021.
] GBL’s share of other comprehensive income (loss) includes $919 million of unrealized losses on available-for-sale investments and $1 million of unrealized losses on foreign currency translation.
[ ] Indirectly held through Parjointco.
[ ] The carrying value of the investments in Lifeco and IGM have been restated on January 1, 2023 to reflect the adoption of IFRS 9 primarily related to the impact on Lifeco’s transition from an incurred loss model under IAS 39 to an expected credit loss (ECL) model under IFRS 9 for the determination of allowances for credit losses.
[ ] On January 12, 2023, the Corporation acquired approximately 1 .2 million Lifeco common shares from IGM, for cash consideration of $ 3 million. Refer to the section “ChinaAMC” in the section “Overview”.
[4] Includes the effect of change in ownership as a result of i) the Corporation’s acquisition of an additional 1. % interest in Lifeco from IGM, and ii) the sale of the Corporation’s interest in ChinaAMC to IGM.
The table below presents the components of the alternative asset investment platforms, Sagard and Power Sustainable. The asset management companies, and controlled and consolidated investments held through the investment platforms, are presented using the equity method for the purposes of the holding company presentation.
Alternative asset investment platforms are comprised of the following investments:
[ ] Includes Power Financial’s investments in Portage Ventures I, Portage Ventures II and Wealthsimple.
The table below presents the components of other investments and standalone businesses; certain controlled standalone businesses are presented using the equity method for the purposes of the holding company presentation.
Other investments and standalone businesses are comprised of the following:
[ ] Includes portfolio investments in private investment funds and a select number of hedge funds. These investments are classified as fair value through profit or loss. At March 31, 2023, the Corporation had outstanding commitments to make future capital contributions to these funds for an aggregate amount of $3 million.
Non-participating (preferred) shares of the Corporation consist of five series of First Preferred Shares with an aggregate stated capital of $9 0 million at March 31, 2023 (same as at December 31, 2022), all of which are non-cumulative. All series are perpetual preferred shares and are redeemable in whole or in part solely at the Corporation’s option from specified dates.
The terms and conditions of the outstanding First Preferred Shares are described in Note 1 of the Corporation’s 2022 Consolidated Financial Statements.
Participating shareholders’ equity
Participating shareholders’ equity was $21,190 million at March 31, 2023, compared with $20,92 million at December 31, 2022:
Three months ended March
Participating shareholders’ equity, at the beginning of the year [ ] ,
of initial application of IFRS 17 and IFRS 9 overlay
of initial application of IFRS 9 on January 1, 2023
Participating shareholders’ equity, at the beginning of the year (restated) Changes in participating shares
for cancellation of subordinate voting shares under NCIB
of subordinate voting shares (113,902 shares in 2023 and 1, 1, 17 shares in 2022) under the Corporation’s Executive Stock Option Plans
Participating shareholders’ equity, at March ,
[ ] Opening balance at January 1, 2023 is as restated.
[ ] During the three months ended March 31, 2022, the Corporation reclassified 12, , 0 options as cash-settled share-based payments as the Corporation intended to attach tandem share appreciation rights to certain options. See Note 19 to the 2022 Consolidated Financial Statements for additional information.
The book value per participating share (refer to the section “Other Measures”) of the Corporation was $31. 1 at March 31, 2023, compared with $31.37 at the end of 2022.
The Corporation and its subsidiaries adopted IFRS 17 and IFRS 9 on their effective dates of January 1, 2023. The adoption of these standards had an impact on the Corporation’s opening equity balances. The January 1, 2022 participating shareholders' equity decreased by approximately $3. billion on the adoption of IFRS 17, primarily due to the establishment of the contractual service margin, partially offset by the removal of provisions no longer required under IFRS 17. The initial application of the IFRS 9 overlay was an increase to the January 1, 2022 participating shareholders’ equity of $1.1 billion.
Refer to the section “Changes in Accounting Policies” as well as Note 2 and Note 3 to the Corporation’s Interim Consolidated Financial Statements for addition information.
At the date of this MD&A, there were 54,860,866 participating preferred shares of the Corporation outstanding (same as at December 31, 2022), and 611,173,933 subordinate voting shares of the Corporation outstanding, compared with 612,219,731 at December 31, 2022.
At the date of this MD&A, options were outstanding to purchase up to an aggregate of 26,735,763 subordinate voting shares of the Corporation, which includes 10,900,781 subordinate voting shares issuable pursuant to Replacement Options, under the Corporation’s Executive Stock Option Plan and the Power Financial Employee Stock Option Plan.
The Corporation’s Normal Course Issuer Bid (NCIB) that commenced on February 28, 2022 expired on February 27, 2023. The Corporation did not make repurchases pursuant to this bid in the first quarter of 2023 (4,474,700 Subordinate Voting Shares for a total of $175 million during the first quarter of 2022).
On March 1, 2023, the Corporation commenced a NCIB which is effective until the earlier of February 29, 2024 and the date on which the Corporation has purchased the maximum permitted number of Subordinate Voting Shares. Pursuant to this bid, the Corporation may purchase up to 30 million of its Subordinate Voting Shares outstanding (representing approximately 5.4% of the public float of Subordinate Voting Shares outstanding at February 22, 2023) at market prices. At March 31, 2023, the Corporation had repurchased 1,159,700 Subordinate Voting Shares for a total of $42 million.
In connection with its NCIB, the Corporation has entered into an automatic share purchase plan and may provide parameters thereunder from time to time to allow a designated broker to purchase Subordinate Voting Shares under the NCIB at times when the Corporation would ordinarily not be permitted to purchase shares due to regulatory restrictions or self-imposed blackout periods. Outside of these predetermined blackout periods, purchases under the Corporation’s NCIB will be completed at management’s discretion.
Adjusted net asset value is presented for Power Corporation and represents management’s estimate of the fair value of the participating shareholders’ equity of the Corporation. Adjusted net asset value is calculated as the fair value of the assets of the combined Power Corporation and Power Financial holding company less their net debt and preferred shares. In determining the fair value of assets, investments in subsidiaries, jointly controlled corporations and associates are adjusted to fair value as follows:
Investments in publicly traded companies are valued at their market value, measured as the closing share price on the reporting date;
Investments in private entities are valued at fair value based on management’s estimate using consistently applied valuation models either based on a valuation multiple or discounted cash flows. Certain valuations are prepared by external valuators or subject to review by external valuators. Market-comparable transactions are generally used to corroborate the estimated fair value. The value of investments in private entities is presented net of any management incentives;
Investments in investment funds are valued at the fair value reported by the fund which is net of carried interest or other incentives.
The presentation of the participating shareholders’ equity at fair value is not in accordance with IFRS; adjusted net asset value is a non-IFRS financial measure. Refer to the section “Non-IFRS Financial Measures” for a description and a reconciliation of IFRS and non-IFRS financial measures.
The Corporation’s adjusted net asset value is presented on a look-through basis. The combined holding company balance sheets of Power Corporation and Power Financial include the investments held in public entities through Power Financial (Lifeco, IGM and GBL), and the net debt and preferred shares of Power Financial. The adjusted net asset value per share, a nonIFRS ratio, was $ 9 at March 31, 2023, compared with $ 1.91 at December 31, 2022, representing an increase of 11.9%. The Corporation’s book value per participating share (refer to the section “Other Measures”) was $31. 1 at March 31, 2023, compared with $31.37 at December 31, 2022, representing an increase of 1. %.
[ ] The Corporation’s share of GBL’s reported net asset value was $ .1 billion (€2. billion) at March 31, 2023 ($3. billion (€2. billion) at December 31, 2022).
[ ] The management companies of the investment funds are presented at their carrying value and are primarily composed of cash and net carried interest receivable.
[ ] Includes the Corporation’s investments in Portage Ventures I, Portage Ventures II and Wealthsimple, held by Power Financial.
[ ] Includes the Corporation’s interest of 3.9% held in Bellus. At March 31, 2023, the fair value of the investment in Bellus is based on the transaction price of US$1 .7 per share announced on April 1 , 2023, subsequent to quarter-end.
[5] An additional deferred tax liability of $9 million has been included in the adjusted net asset value at March 31, 2023 ($13 million at December 31, 2022) with respect to the investments in standalone businesses at fair value, without taking into account possible tax planning strategies. The Corporation has tax attributes (not otherwise recognized on the balance sheet) that could be available to minimize the tax if the Corporation were to dispose of its interests held in the standalone businesses.
[6] In accordance with IAS 12, Income Taxes, no deferred tax liability is recognized with respect to temporary differences associated with investments in subsidiaries and jointly controlled corporations as the Corporation is able to control the timing of the reversal of the temporary differences and it is probable that the temporary differences will not reverse in the foreseeable future. If the Corporation were to dispose of an investment in a subsidiary or a jointly controlled corporation, income taxes payable on such disposition would be minimized through careful and prudent tax planning and structuring, as well as with the use of available tax attributes not otherwise recognized on the balance sheet, including tax losses, tax basis, safe income and foreign tax surplus associated with the subsidiary or jointly controlled corporation.
[ ] At December 31, 2022, an additional deferred tax liability of $37 million was included in the adjusted net asset value related to the investment in ChinaAMC at fair value.
Investments measured at market value and cash represent 92.7% of the total assets at fair value at March 31, 2023 ( .7% at December 31, 2022). A 10% change in the market value of publicly traded investments would result in a change in the Corporation’s adjusted net asset value of $3,22 million or $ per share.
The condensed cash flows of Lifeco, IGM and the holding company cash flows of Power Corporation and Power Financial on a combined basis, as well as the Corporation’s alternative asset investment platforms, are presented below. These tables reconcile the holding company statement of cash flows to the condensed consolidated statement of cash flows of the Corporation for the three-month periods ended March 31, 2023 and 2022, which are included in Note 23 of the Interim Consolidated Financial Statements. This presentation assists the reader in assessing the cash flows of the holding company.
Consolidated cash and cash equivalents decreased by $920 million in the three-month period ended March 31, 2023, compared with an increase of $2,7 million in the corresponding period in 2022.
Operating activities produced a net outflow of $99 million in the three-month period ended March 31, 2023, compared with a net inflow of $1,32 million in the corresponding period in 2022.
Cash flows from financing activities, which include the issuance and repayment of capital instruments, the issuance and repurchase of participating and preferred shares, the issuance and redemption of common shares, limited-life fund and redeemable units by subsidiaries, dividends paid on the participating and non-participating shares of the Corporation, and dividends paid by subsidiaries to non-controlling interests and increases and repayments of obligations to securitization entities by IGM, represented a net outflow of $ 9 million in the three-month period ended March 31, 2023, compared with a net inflow of $3 7 million in the corresponding period in 2022.
Cash flows from investing activities resulted in a net inflow of $ 7 million in the three-month period ended March 31, 2023, compared with a net inflow of $1,2 million in the corresponding period in 2022.
Parts B and C of this MD&A include a discussion of the cash flows of Lifeco and IGM, respectively.
As Power Corporation is a holding company, corporate cash flows are primarily comprised of dividends received, income from investments and income (loss) from cash and cash equivalents, less operating expenses, financing charges, income taxes, and non-participating and participating share dividends.
The following combined statements of cash flows of Power Corporation and Power Financial present the cash flows of the holding company. This presentation has been prepared to assist the reader as it isolates the cash flows of the activities of the holding company.
Cash and cash equivalents of the Corporation and Power Financial increased by $3 million in the three-month period ended March 31, 2023, compared with a decrease of $173 million in the corresponding period in 2022.
Operating activities resulted in a net inflow of $2 9 million in the three-month period ended March 31, 2023, compared with a net inflow of $29 million in the corresponding period in 2022. Dividends received from the publicly traded operating companies include:
Three months ended March March
(in millions of Canadian dollars; except as otherwise noted)
The Corporation’s financing activities during the three-month period ended March 31, 2023 resulted in a net outflow of $ 1 million, compared with a net outflow of $ 1 million in the corresponding period in 2022, and included:
Dividends paid on non-participating and participating shares by the Corporation of $3 3 million, compared with $3 million in the corresponding period in 2022. In the three-month period ended March 31, 2023, dividends paid on the Corporation’s participating shares were $0. 9 0 per share, comparable with the corresponding period in 2022.
Dividends paid on preferred shares by Power Financial of $3 million, same as in the corresponding period in 2022.
Issuance of subordinate voting shares of the Corporation for $3 million pursuant to the Corporation’s Executive Stock Option Plan and the Power Financial Employee Stock Option Plan, compared with issuance for an amount of $ million in the corresponding period in 2022.
Repurchase of subordinate voting shares of $ 2 million, as part of the NCIB, in the three-month period ended March 31, 2023, compared with repurchase for an amount of $17 million in the corresponding period in 2022.
No repurchase of non-participating shares, compared with repurchase for an amount of $ million in the corresponding period in 2022.
The Corporation’s investing activities during the three-month period ended March 31, 2023 resulted in a net inflow of $ 13 million, compared with a net inflow of $ million in the corresponding period in 2022.
Proceeds from disposal of investments and purchase of investments are comprised of investment activities of the Corporation and in its investment platforms.
The Corporation increased its level of fixed income securities with maturities of more than three months, resulting in a net outflow of $1 9 million in the three-month period ended March 31, 2023, compared with a net outflow of $12 million in the corresponding period in 2022.
As a holding company, Power Corporation’s objectives in managing its capital are to: provide attractive long-term returns to shareholders of the Corporation; provide sufficient financial flexibility to pursue its growth strategy to invest on a timely basis in its operating companies and other investments as opportunities arise;
maintain a capital structure that matches the long-term nature of its investments by maximizing the use of permanent capital;
maintain an appropriate credit rating to ensure stable access to the capital markets; and maintain available cash and cash equivalents at a minimum of two times fixed charges.
The Corporation manages its capital taking into consideration the risk characteristics and liquidity of its holdings. In order to maintain or adjust its capital structure, the Corporation may adjust the amount of dividends paid to shareholders, return capital to shareholders or issue capital.
The Board of Directors of the Corporation is responsible for capital management. Management of the Corporation is responsible for establishing capital management procedures and for implementing and monitoring its capital plans. The Board of Directors of the Corporation reviews and approves capital transactions such as the issuance, redemption and repurchase of participating shares, non-participating shares and debentures. The boards of directors of the Corporation’s subsidiaries, as well as those of Parjointco and GBL, oversee and have the responsibility for their respective company’s capital management.
With the exception of debentures and other debt instruments, the Corporation’s capital is permanent, matching the longterm nature of its investments. The capital structure of the Corporation consists of: debentures, non-participating shares, participating shareholders’ equity, and non-controlling interests. The Corporation views non-participating shares as a costeffective source of permanent capital.
The Corporation’s consolidated capitalization includes the debentures, preferred shares and other equity instruments, and other debt instruments issued by its consolidated subsidiaries. Debentures and other debt instruments issued by Power Financial, Lifeco, IGM and controlled investments are non-recourse to the Corporation. The Corporation does not guarantee debt issued by its subsidiaries. Non-participating shares and total equity accounted for 72% of consolidated capitalization at March 31, 2023.
[ ] Includes other debt instruments of controlled and consolidated investments and standalone businesses; consists of $23 million ($113 million in 2022) of debt under revolving credit facilities held by the investment funds and other debt held by controlled investees, $1,9 1 million ($1,7 3 million in 2022) of projectrelated debt held within the Power Sustainable Energy Infrastructure platform, and $17 million ($ 0 million in 2022) of other debt held by standalone businesses. The other debt instruments are secured by the assets of the controlled investments which are non-recourse to the Corporation. See Note 11 B) to the Interim Consolidated Financial Statements for additional information.
[ ] Represents the non-controlling equity interests of the Corporation’s subsidiaries excluding Power Financial and Lifeco’s preferred shares and limited recourse capital notes, which are shown in this table as non-participating shares.
The Corporation filed a short-form base shelf prospectus dated November 1 , 2022, pursuant to which, for a period of 2 months thereafter, the Corporation may issue First Preferred Shares, subordinate voting shares, subscription receipts and unsecured debt securities, or any combination thereof. This filing provides the Corporation with the flexibility to access debt and equity markets on a timely basis.
The Corporation commenced a NCIB on March 1, 2023 which is effective until the earlier of February 29, 202 and the date on which the Corporation has purchased the maximum permitted number of subordinate voting shares. Refer to the section “Participating Shareholders’ Equity” for more information.
Power Financial filed a short-form base shelf prospectus dated December , 2022, pursuant to which, for a period of 2 months thereafter, Power Financial may issue up to an aggregate of $3 billion of First Preferred Shares and unsecured debt securities, or any combination thereof. This filing provides the Corporation with the flexibility to access debt and equity markets on a timely basis through Power Financial.
On April 1 , 2023, subsequent to quarter-end, Lifeco repaid the principal amount of its maturing € 00 million senior 2. % euro bond, together with accrued interest.
The Corporation itself is not subject to externally imposed regulatory capital requirements; however, Lifeco and certain of its main subsidiaries, IGM’s subsidiaries and certain of the Corporation’s other subsidiaries are subject to regulatory capital requirements. Parts B and C of this MD&A further describe the capital management activities of Lifeco and IGM, respectively. See Note 21 to the Corporation’s 2022 Consolidated Financial Statements for additional information.
The current rating by Standard & Poor’s (S&P) of the Corporation’s debentures is “A+” with a stable outlook. Dominion Bond Rating Service’s (DBRS) current rating on the Corporation’s debentures is “A” with a stable rating trend.
Credit ratings are intended to provide investors with an independent measure of the credit quality of the securities of a corporation and are indicators of the likelihood of payment and the capacity of a corporation to meet its obligations in accordance with the terms of each obligation. Descriptions of the rating categories for each of the agencies set forth below have been obtained from the respective rating agencies’ websites. These ratings are not a recommendation to buy, sell or hold the securities of a corporation and do not address market price or other factors that might determine suitability of a specific security for a particular investor. The ratings also may not reflect the potential impact of all risks on the value of securities and are subject to revision or withdrawal at any time by the rating organization.
The “A+” rating assigned to the Corporation’s debentures by S&P is the fifth highest of the 22 ratings used for long-term debt. A long-term debenture rated “A+” is somewhat more susceptible to the adverse effects of changes in circumstances and economic conditions than obligations in higher-rated categories; however, the obligor’s capacity to meet its financial commitment on the obligation is still strong.
The “A” rating assigned to the Corporation’s debentures by DBRS is the sixth highest of the 2 ratings used for long-term debt. A long-term debenture rated “A” implies that the capacity for repayment is substantial, but of lesser credit quality than AA, and may be vulnerable to future events, although qualifying negative factors are considered manageable.
The current rating by S&P of Power Financial’s debentures is “A+” with a stable outlook. DBRS’ current rating on Power Financial’s debentures is “A (High)” with a stable trend.
Parts B and C of this MD&A provide information on the ratings of the debentures of Lifeco and IGM, respectively.
Power Corporation is an international management and holding company that focuses on financial services in North America, Europe and Asia. Its core holdings are leading insurance, retirement, wealth management and investment businesses including a portfolio of alternative asset investment platforms. The Corporation, through Power Financial, holds a controlling interest in Lifeco and IGM and also holds a joint controlling interest in Parjointco, which itself holds a controlling interest in GBL. As a result, the Corporation bears the risks associated with being a significant shareholder of these operating companies. A complete description of these risks is presented in their public disclosures. The respective boards of directors of Lifeco, IGM and GBL are responsible for the risk oversight function at their respective companies. The risk committees of the boards of directors of Lifeco and IGM are responsible for their risk oversight. Certain officers of the Corporation are members of these boards and committees of these boards, including the risk committees, and, consequently, in their role as directors, they participate in the risk oversight function at the operating companies. Parts B and C of this MD&A further describe risks related to Lifeco and IGM, respectively.
The Corporation believes that a prudent approach to risk is achieved through a governance model that focuses on the active oversight of its investments. The Board of Directors and executive officers of the Corporation have overall oversight and responsibility for risk management associated with the investment activities and operations of the holding company and maintain a comprehensive and appropriate set of policies and controls.
The Board of Directors provides oversight and carries out its risk management mandate and addresses operational risks primarily through the following committees:
The Audit Committee addresses risks related to financial reporting and cybersecurity.
The Human Resources Committee considers risks associated with the Corporation’s compensation policies and practices.
The Governance and Nominating Committee oversees the Corporation’s approach to appropriately address potential risks related to governance matters.
The Related Party and Conduct Review Committee reviews and considers for approval transactions with related parties of the Corporation.
There are certain risks inherent in an investment in the securities of the Corporation and in the activities of the Corporation, which investors should carefully consider before investing in securities of the Corporation. The 2022 Annual MD&A reviews certain risks that could impact the financial condition and financial performance, and the value of the equity of the Corporation. This description of risks does not include all possible risks, and there may be other risks of which the Corporation is not currently aware.
During the first quarter of 2023, there were no changes to the Corporation’s risk oversight approach, and the identification and management of the specific risks, including the risks related to the COVID-19 pandemic and geopolitical tensions, as described in the 2022 Annual MD&A.
At March 31, 2023, there have been changes to the carrying amounts and fair value of the Corporation and its subsidiaries’ assets and liabilities recorded at fair value since December 31, 2022. These changes did not have a material impact on the financial condition of the Corporation and its subsidiaries. See Note 22 to the Corporation’s Interim Consolidated Financial Statements for additional disclosure of the Corporation’s fair value measurement.
In the course of their activities, the Corporation and its subsidiaries use derivative financial instruments. When using such derivatives, they only act as limited end-users and not as market makers in such derivatives.
The use of derivatives is monitored and reviewed on a regular basis by senior management of the Corporation and by senior management of its subsidiaries. The Corporation and its subsidiaries have each established operating policies, guidelines and procedures relating to the use of derivative financial instruments, which in particular focus on: prohibiting the use of derivative instruments for speculative purposes; documenting transactions and ensuring their consistency with risk management policies; demonstrating the effectiveness of the hedging relationships; and monitoring the hedging relationships.
There were no major changes to the Corporation and its subsidiaries’ policies and procedures with respect to the use of derivative instruments in the three-month period ended March 31, 2023. The following table provides a summary of the Corporation and its subsidiaries’ derivatives portfolio:
During the three-month period ended March 31, 2023, there was an increase of $3.9 billion in the notional amount of derivatives outstanding, primarily due to regular hedging activities by Lifeco. The Corporation and its subsidiaries’ exposure to derivative counterparty risk (which represents the market value of instruments in a gain position) decreased to $2,279 million at March 31, 2023 from $2, 0 million at December 31, 2022. The decrease was primarily driven by the impact of the British pound and euro strengthening against the U.S. dollar on cross-currency swaps that pay British pounds and euros and receive U.S. dollars.
Parts B and C of this MD&A provide information on the types of derivative financial instruments used by Lifeco and IGM, respectively.
See Note 2 to the Corporation’s 2022 Consolidated Financial Statements for additional information.
In the normal course of their operations, the Corporation and its subsidiaries may enter into certain agreements, the nature of which precludes the possibility of making a reasonable estimate of the maximum potential amount the Corporation or subsidiary could be required to pay third parties, as some of these agreements do not specify a maximum amount and the amounts are dependent on the outcome of future contingent events, the nature and likelihood of which cannot be determined. See also Note 32 to the Corporation’s 2022 Consolidated Financial Statements.
In the normal course of its reinsurance business, Lifeco provides letters of credit to other parties or beneficiaries. A beneficiary will typically hold a letter of credit as collateral to secure statutory credit for insurance and investment contract liabilities ceded to or amounts due from Lifeco. Lifeco may be required to seek collateral alternatives if it is unable to renew existing letters of credit on maturity. See also Part B of this MD&A and Note 32 to the Corporation’s 2022 Consolidated Financial Statements.
The Corporation and its subsidiaries are from time to time subject to legal actions, including arbitrations and class actions, arising in the normal course of business. It is inherently difficult to predict the outcome of any of these proceedings with certainty, and it is possible that an adverse resolution could have a material adverse effect on the consolidated financial position of the Corporation. However, based on information presently known, it is not expected that any of the existing legal actions, either individually or in the aggregate, will have a material adverse effect on the consolidated financial position of the Corporation. See also Parts B and C of this MD&A and Note 31 to the Corporation’s 2022 Consolidated Financial Statements.
At March 31, 2023, there have been no material changes in the contractual obligations of the Corporation and its subsidiaries from those reported in the 2022 Annual MD&A.
The non-capital losses of the holding company, at March 31, 2023, were $1,27 million ($1,23 million for which the benefits have not been recognized) and are available to reduce future taxable income (including capital gains). These losses expire from 202 to 20 3.
The capital losses of the holding company, at March 31, 2023, were $1 million ($ 0 million for which the benefits have not been recognized) and can be used indefinitely to offset capital gains.
Power Corporation has a Related Party and Conduct Review Committee composed entirely of Directors who are independent of management and independent of the Corporation’s controlling shareholder. The mandate of this Committee is to review proposed transactions with related parties of the Corporation, including its controlling shareholder, and to approve only those transactions that it deems appropriate and that are done at market terms and conditions.
In the normal course of business, Power Corporation and its subsidiaries enter into various transactions which include capital commitments to investment funds, including commitments from management, performance and base management fees paid to subsidiaries of the group, employee ownership participations and loans to employees. Such transactions are at market terms and conditions and are reviewed by the appropriate related party and conduct review committee.
In the normal course of business, Canada Life and Putnam enter into various transactions with related companies which include providing group insurance benefits and sub-advisory services, respectively, to other companies within the Power Corporation group of companies. Such transactions are at market terms and conditions. These transactions are reviewed by the appropriate related party and conduct review committee.
Lifeco provides asset management, employee benefits and administrative services for employee benefit plans relating to pension and other post-employment benefits for employees of Power Corporation, Power Financial, and Lifeco and its subsidiaries. These transactions are at market terms and conditions and are reviewed by the appropriate related party and conduct review committee.
IGM enters into transactions with subsidiaries of Lifeco. These transactions are in the normal course of operations and include i) providing certain administrative and technology services; ii) distributing insurance products; and iii) the sale of residential mortgages to Canada Life. These transactions are at market terms and conditions and are reviewed by the appropriate related party and conduct review committee.
On January 12, 2023, the Corporation and IGM completed a previously announced agreement in which IGM acquired the Corporation’s 13.9% interest held in ChinaAMC. In a separate transaction, IGM sold a 1. % interest held in Lifeco to Power Financial. Refer to the section “ChinaAMC” in the section “Overview”.
On April 3, 2023, subsequent to quarter-end, Lifeco and IGM announced that they have entered into an agreement whereby Lifeco will acquire 100% of IPC from IGM for cash consideration of $ 7 million. Refer to the section “Rockefeller Capital Management and Investment Planning Counsel” in the section “Overview”.
See Note 30 to the Corporation’s 2022 Consolidated Financial Statements for additional information.
In the preparation of the financial statements, management of the Corporation and the managements of its subsidiaries are required to make significant judgments, estimates and assumptions that affect the reported amounts of assets, liabilities, net earnings, comprehensive income and related disclosures. The results of the Corporation reflect the judgments of the managements of the Corporation and its subsidiaries regarding the impact of prevailing market conditions related to global credit, equities, investment properties and foreign exchange, as well as, with respect to Lifeco, prevailing health and mortality experience. Key sources of estimation uncertainty and areas where significant judgments are made by the management of the Corporation and the managements of its subsidiaries include: the entities to be consolidated or accounted for using the equity method, valuation of insurance and certain investment contract liabilities, fair value measurements, impairment of investments, goodwill and intangible assets, income taxes and employee future benefits.
The significant accounting estimates and judgments below reflect the implementation of IFRS 17 and IFRS 9 by the Corporation and its subsidiaries. Additional details regarding these significant estimates and judgments can be found in Note 2 to the Interim Financial Statements, as well as in the Corporation’s 2022 Annual MD&A and the notes to the Corporation’s 2022 Consolidated Financial Statements.
Under IFRS 9, a financial asset is measured at fair value on initial recognition and is classified and subsequently measured as fair value through profit or loss (FVPL), fair value through other comprehensive income (FVOCI), or amortized cost based upon the Corporation’s or its subsidiaries’ business models for managing these assets and the contractual cash flow characteristics of these assets.
The Corporation and its subsidiaries maximize the use of observable inputs when measuring fair value. The following is a description of the methodologies used to value instruments carried at fair value.
Fair values for bonds measured as FVPL or FVOCI are determined with reference to quoted market bid prices primarily provided by third-party independent pricing sources. Where prices are not quoted in an active market, fair values are determined by valuation models. The Corporation and its subsidiaries obtain quoted prices in active markets, when available, for identical assets at the balance sheet date to measure bonds at fair value in its FVPL and FVOCI portfolios.
The Corporation and its subsidiaries estimate the fair value of bonds not traded in active markets by referring to actively traded securities with similar attributes, dealer quotations, matrix pricing methodology, discounted cash flow analyses and/or internal valuation models. This methodology considers such factors as the issuer's industry, the security's rating, term, coupon rate and position in the capital structure of the issuer, as well as yield curves, credit curves, prepayment rates and other relevant factors. For bonds that are not traded in active markets, valuations are adjusted to reflect illiquidity, and such adjustments generally are based on available market evidence. In the absence of such evidence, management's best estimate is used.
There are no market-observable prices for mortgage and other loans; therefore, fair values for mortgage and other loans are determined by discounting expected future cash flows using current market rates for similar instruments. Valuation inputs typically include benchmark yields and risk-adjusted spreads based on current lending activities and market activity.
There are no market-observable prices for equity-release mortgages; Lifeco uses an internal valuation model which is based on discounting expected future cash flows and considering the embedded no-negative-equity guarantee. Inputs to the model include market-observable inputs such as benchmark yields and risk-adjusted spreads. Non-market-observable inputs include property growth and volatility rates, expected rates of voluntary redemptions, death, moving to long-term care and interest cessation assumptions and the value of the no-negative-equity guarantee.
Fair values of publicly traded shares are generally determined by the last bid price for the security from the exchange where it is principally traded. Fair values of shares for which there is no active market are typically based upon alternative valuation techniques such as discounted cash flow analysis, review of price movement relative to the market and utilization of information provided by the underlying investment manager. The Corporation and its subsidiaries obtain quoted prices in active markets, when available, for identical assets at the balance sheet date to measure shares at fair value in its fair value through profit or loss portfolio.
Under IFRS 9, expected credit loss (ECL) allowances are recognized on all financial assets, except for financial assets classified or designated as FVPL and equity instruments designated as FVOCI. The ECL model under IFRS 9 replaces the incurred loss model under IAS 39.
The Corporation and its subsidiaries measure loss allowances at either a 12-month ECL or lifetime ECL. A 12-month ECL results from any default events that could potentially occur within the 12 months following the reporting date. A 12-month ECL is calculated for financial assets that are determined to have low credit risk or a credit risk that has not increased significantly since initial recognition. A lifetime ECL results from all possible default events over the expected life of the financial asset, which is the maximum contractual period over which the Corporation or its subsidiaries are exposed to the credit risk. A lifetime ECL is recognized for financial assets that have experienced a significant increase in credit risk since initial recognition or when there is objective evidence of impairment.
The ECL allowance is based on a probability-weighted estimate of credit losses expected as a result of defaults over the relevant time period as prescribed under the ECL model. The measurement of ECL for a financial asset is based primarily on the exposure at default, the probability of default, and the loss given default. The measurement of ECL allowances requires the use of judgment and assumptions.
In the computation of insurance contract liabilities, Lifeco has made valuation assumptions regarding rates of mortality/morbidity, investment returns, levels of operating expenses, rates of policy termination and rates of utilization of elective policy options or provisions. The valuation assumptions use best estimates of future experience together with a risk adjustment for non-financial risk. This risk adjustment for non-financial risk is necessary to provide for possibilities of misestimation and/or future deterioration in the best-estimate assumptions and provide reasonable assurance that insurance contract liabilities cover a range of possible outcomes. Risk adjustments for non-financial risk are reviewed periodically for continued appropriateness.
The estimates of the present value of future cash flows are measured by Lifeco for reinsurance contract held using assumptions that are consistent with those used to measure the estimates of the present value of future cash flows for the underlying insurance contracts, with an adjustment for any risk of non-performance by the reinsurer.
Investment contract liabilities are measured at fair value determined using discount rates derived from a reference portfolio or stochastic modelling at the end of the reporting period. Lifeco’s main valuation techniques incorporate all factors that market participants would consider and make maximum use of observable market data.
The methods for arriving at these valuation assumptions are outlined in Part B of this MD&A, including updates to Lifeco’s annual assumptions and sensitivity disclosures.
The Corporation actively monitors changes in IFRS, both proposed and released, by the International Accounting Standards Board (IASB) for potential impact on the Corporation.
The Corporation and its subsidiaries adopted IFRS 17, Insurance Contracts (IFRS 17) and IFRS 9, Financial Instruments (IFRS 9), which replaced IFRS , Insurance Contracts (IFRS ) and IAS 39, Financial Instruments: Recognition and Measurement (IAS 39), respectively, on their effective date of January 1, 2023. The Corporation has also applied IFRS 9 as at January 1, 2023 when applying the equity method of accounting to GBL’s results.
IFRS 17, which impacted only Lifeco due to its insurance activities, establishes principles for the recognition, measurement, presentation and disclosure of insurance contracts. Under IFRS 17, groups of contracts are measured by Lifeco at the estimate of the present value of fulfillment cash flows, adjusted for an explicit risk adjustment for non-financial risk and the contractual service margin (CSM).
IFRS 9 includes changes to the accounting of financial instruments for the following:
i) classification and measurement of financial instruments based on a business model approach for managing financial assets and the contractual cash flow characteristics of the financial asset;
ii) impairment based on an expected loss model; and
iii) hedge accounting that incorporates the risk management practices of an entity. The accounting policies materially impacted by the adoption of IFRS 17 and IFRS 9 are described in Note 2 to the Interim Financial Statements.
The Corporation also adopted the amendments to IFRS for IAS 1, Presentation of Financial Statements, IAS , Accounting Policies, Changes in Accounting Estimates and Errors and IAS 12, Income Taxes effective January 1, 2023. The adoption of these amendments did not have a material impact on the Corporation’s financial statements.
IFRS 17 introduces significant changes to the presentation of the Corporation’s financial statements. Portfolios of insurance contracts issued by Lifeco, and reinsurance contracts held that are assets and liabilities, are respectively presented separately.
IFRS 17 also introduces significant measurement differences, including the following:
Reclassification of contracts from insurance to investment contracts;
Establishment of the CSM for in-force policies;
Net impact of removing margin for adverse deviations (MfADs) and establishing an adjustment for non-financial risk;
Adjustment for difference in discount rates;
Adjustment for non-attributable expenses; and
Other measurement impacts.
Upon transition, IFRS 17 requires an entity to apply the standard retrospectively unless impracticable, in which case the entity shall use either the modified retrospective approach or the fair value approach.
The full retrospective approach requires the Corporation, through Lifeco, to apply the guidance of IFRS 17 as if IFRS 17 had always been applied.
Lifeco has performed a cut-off date assessment (by region and product) to determine the contracts to which the full retrospective approach can be applied. The Corporation, through Lifeco, applied the full retrospective approach to all identified insurance contracts unless it was impracticable, in the cases where reasonable and supportable information necessary to complete the full retrospective approach was not available.
The fair value approach calculates the CSM or loss component of the liability for remaining coverage as the difference between the fair value of a group of insurance contracts at the date of transition and the fulfillment cash flows measured at that date. The Corporation, through Lifeco, has applied the fair value approach to contracts where it was impracticable to apply the full retrospective approach.
IFRS 9 introduces changes to the classification and measurement of financial instruments as well as the transition from an incurred loss model under IAS 39 to an ECL model for the determination of allowances for credit losses.
Upon adoption of IFRS 9, the Corporation elected to present comparative information for certain of its financial assets, primarily those held by Lifeco, as if the classification and measurement requirements of IFRS 9 had been applied in the comparative period, on an instrument-by-instrument basis, as permitted by the amendment to IFRS 17 published by the IASB in December 2021.
As permitted under IFRS 9, the Corporation and its subsidiaries elected to continue to apply the hedge accounting principles under IAS 39 instead of those under IFRS 9. The accounting policy for hedge accounting is disclosed in the notes to the consolidated financial statements of the Corporation for the year ended December 31, 2022.
The changes in accounting policies resulting from the adoption of these standards had an impact on the Corporation’s opening equity balances.
The adoption of IFRS 17 and the IFRS 9 overlay resulted in an overall reduction of total assets of $13. billion, total liabilities of $10.2 billion, and total equity of $3. billion on the transition balance sheet as at January 1, 2022.
Asset and liability reclassifications were driven by changes to the groupings of certain assets and liabilities. Significant reclassifications included $ .3 billion of loans to policyholders, $7.9 billion of funds held by ceding insurers, and $1.9 billion of premiums in the course of collection reclassified to insurance contract liabilities. In addition, $ 0. billion of insurance contract liabilities were reclassified to investment contract liabilities, and insurance contract assets of $1. billion and reinsurance contract held liabilities of $1.3 billion were established.
The presentation of liabilities on account of segregated fund policyholders was separated between insurance and investment contract liabilities.
IFRS 9 adjustments primarily resulted in an increase to assets of $2. billion due to a change in designation of certain bonds and mortgage and other loans held at amortized cost under IAS 39 to FVPL under IFRS 9.
IFRS 17 adjustments mainly resulted in an increase to insurance contract liabilities of $ billion, which is primarily the result of the establishment of CSM for in-force contracts of $ .1 billion associated with shareholders' equity and $ billion associated with non-controlling interests, partially offset by risk adjustments related to the transition from IFRS to IFRS 17 of $1. billion associated with shareholders’ equity and $0. billion associated with non-controlling interests. This does not include the CSM on in-force segregated fund business which does not have a material impact on capital.
Total equity decreased by $3. billion, consisting of a $2.3 billion reduction to shareholders’ equity and a $1.1 billion reduction to non-controlling interests.
Shareholders’ equity decreased by $2.3 billion, primarily due to the establishment of the CSM of $ billion and the adjustment for differences in the discount rate of $1.3 billion, offset by increases due to the transition of risk adjustments from IFRS to IFRS 17 of $1. billion and the impact of the initial application of the IFRS 9 overlay of $1. billion. All other impacts, including taxes, adjustments for non-attributable expenses and from reclassifications, totalled an increase of $0. billion.
The non-controlling interests decrease of $1.1 billion was due to the impact of the initial application of IFRS 17 of $2.0 billion, offset by the impact of the application of the IFRS 9 overlay of $0.9 billion.
The adoption of IFRS 9 on January 1, 2023 impacted the classification of the Corporation’s investments and those held by GBL, which resulted in a reclassification of available-for-sale investments to fair value through profit or loss investments and has led to a reclassification of the investment revaluation reserves to retained earnings of $30 million.
The Corporation and its subsidiaries monitor changes in IFRS, both proposed and released, by the IASB and analyze the effect that changes in the standards may have on the consolidated financial statements when they become effective. There were no changes to the future accounting policies that could impact the Corporation and its subsidiaries in addition to the disclosure in the 2022 Annual MD&A and the Corporation’s 2022 Consolidated Financial Statements.
The Corporation’s internal control over financial reporting is designed to provide reasonable assurance regarding the reliability of financial reporting and that the preparation of financial statements for external purposes is in accordance with IFRS. The Corporation’s management, under the supervision of the Chief Executive Officer and the Chief Financial Officer, is responsible for establishing and maintaining effective internal control over financial reporting. All internal control systems have inherent limitations and may become ineffective because of changes in conditions. Therefore, even those systems determined to be effective can provide only reasonable assurance with respect to financial statement preparation and presentation.
As a management and holding company, the Corporation’s business activities are carried out through its investments in businesses, each of which has its own management team. Accordingly, the Corporation’s management relies on the certifications filed by management of Lifeco and IGM pursuant to National Instrument 2-109 – Certification of Disclosure in Issuers’ Annual and Interim Filings, as well as a sub-certification process by management at its other significant subsidiaries and investees in order to make determinations regarding the Corporation’s disclosure controls and procedures and internal control over financial reporting.
There have been no changes in the Corporation’s internal control over financial reporting during the three-month period ended March 31, 2023 which have materially affected, or are reasonably likely to materially affect, the Corporation’s internal control over financial reporting.
As permitted by securities legislation, for the period ended March 31, 2023, Lifeco’s management has limited the scope of its design of Lifeco’s disclosure controls and procedures and Lifeco’s internal control over financial reporting to exclude controls, policies and procedures of the Prudential full-service retirement services business, which Lifeco acquired on April 1, 2022.
For the three months ended March 31, 2023, the acquired Prudential retirement services business had revenue of $ 39 million, net earnings of $ 3 million post-tax including negative impact of market experience gains and losses of $ million, integration costs of $1 million post-tax and amortization of acquisition intangibles of $ million post-tax. The initial amounts assigned to the assets acquired, goodwill and intangible assets on April 1, 2022 and reported as at March 31, 2023 were $12 ,9 million. The initial amounts assigned to the liabilities assumed on April 1, 2022 and reported as at March 31, 2023 were $122,329 million.
Power Financial relies on certain of the continuous disclosure documents filed by Power Corporation of Canada pursuant to an exemption from the requirements of National Instrument 1-102 – Continuous Disclosure Obligations (NI 1-102) and as provided in the decision of the Autorité des marchés financiers and the Ontario Securities Commission, dated January 19, 2021, regarding Power Financial and Power Corporation. The following disclosure is provided further to the requirements of such decision:
For the three months ending March ,
[ ] Includes Power Financial’s investment activities including its investment in Portage Ventures I, Portage Ventures II and Wealthsimple.
This MD&A presents and discusses financial measures which are not in accordance with IFRS. Management uses these financial measures in its presentation and analysis of the financial performance of Power Corporation, and believes that they provide additional meaningful information to readers in their analysis of the results of the Corporation. The non-IFRS financial measures and non-IFRS ratios used in this MD&A are defined as follows:
Assists in the comparison of the current period’s underlying operating performance to that of previous periods as it reflects management’s view of the operating performance of the Corporation and its subsidiaries, excluding items that are not considered to be part of the underlying business results.
As a holding company, management reviews and assesses the performance of each operating company’s contribution to net earnings and adjusted net earnings.
Adjustments
After-tax impact of any item that in management’s judgment, including those identified by management of its publicly traded operating companies, would make the periodover-period comparison of results from operations less meaningful. In the first quarter of 2023, management of Lifeco refined its definition of Adjustments. See the section “Change in the definition of Adjusted net earnings, a non-IFRS financial measure” in the section “Overview”.
Includes the Corporation’s share of Lifeco’s impact of market-related impacts, where actual market returns in the current period are different than longer-term expected returns on assets and liabilities, assumption changes and management actions that impact the measurement of assets and liabilities, realized gains (losses) on the sale of assets measured at FVOCI, direct equity and interest rate impacts on the measurement of surplus assets and liabilities and amortization of acquisition-related finite life intangible assets, as well as items that management believes are not indicative of the underlying business results which include those identified by a subsidiary or a jointly controlled corporation. Items that management and management of its subsidiaries believe are not indicative of the underlying business results include restructuring or reorganization costs, transaction and integration costs related to business acquisitions, material legal settlements, material impairment charges, impact of substantially enacted income tax rate changes and other tax impairments, certain non-recurring material items, and net gains, losses or costs related to the disposition or acquisition of a business.
Identifies items that are not considered part of operating performance by management, including items identified by management of its publicly traded operating companies.
Adjusted net asset value
Adjusted net asset value represents the fair value of the participating shareholders’ equity of Power Corporation. Adjusted net asset value is calculated as the fair value of the assets of the combined Power Corporation and Power Financial holding company less their net debt and preferred shares.
The investments held in publicly traded entities (including Lifeco, IGM and GBL) are measured at their market value and investments in private entities and investment funds are measured at management’s estimate of fair value.
Presents the fair value of the participating shareholders’ equity of the holding company and is used to assist in assessing value.
This measure may be used by investors and analysts in determining or comparing the fair value of investments held by the holding company or its overall fair value.
Consolidated assets and assets under management includes total assets per the financial statements as well as assets managed on behalf of clients which are beneficially owned by clients and are not recognized in the consolidated financial statements including:
Internally and externally managed funds, including proprietary mutual funds, exchangetraded funds and institutional assets, where the Corporation’s publicly traded operating companies and alternative asset investment platforms have oversight of the investment policies; and
The fair value of assets managed on behalf of the clients by asset managers controlled within the investment platforms, including assets managed through a separately managed account.
Services provided in respect of assets under management include the selection of investments, the provision of investment advice and discretionary portfolio management on behalf of clients.
Consolidated assets and assets under administration includes consolidated assets under management and other assets under administration. Other assets under administration includes assets where the Corporation’s consolidated publicly traded operating companies and investment management services businesses only provide administration services for which they earn fees and other income. These assets are beneficially owned by the clients and the Corporation’s operating subsidiaries do not direct the investing activities. Services provided relating to assets under administration include record keeping, safekeeping, collecting investment income, settling of transactions or other administrative services.
Consolidated assets and assets under management and Consolidated assets and assets under administration provide an indicator of the size and volume of the Corporation’s consolidated businesses, including the publicly traded operating companies and alternative asset investment platforms.
Consolidated assets and assets under administration includes assets in which the Corporation’s consolidated publicly traded operating companies and investment management services businesses only provide administration services, which are an important aspect of the overall business and should be considered when comparing volumes, size and trends.
(of alternative asset investment platforms)
Fee-related earnings is presented for Sagard and Power Sustainable and includes revenues from management fees earned across all asset classes, less i) fee-related compensation including salary, bonus, and benefits, and ii) operating expenses. Fee-related earnings is presented on a gross pretax basis, including non-controlling interests. Fee-related earnings excludes i) share-based compensation expenses, ii) amortization of acquisition-related intangibles, iii) foreign exchange-related gains and losses, iv) net interest, and v) other items that in management’s judgment are not indicative of underlying operating performance of the alternative asset investment platforms, which include restructuring costs, transaction and integration costs related to business acquisitions and certain non-recurring material items.
This measure is presented for the alternative asset investment platforms, Sagard and Power Sustainable, and is used to assess the profitability from their asset management activities. This financial measure provides insight as to whether recurring revenues from management fees, which are not based on future realization events, are sufficient to cover associated operating expenses.
Assists in comparing adjusted net earnings on a per share basis; refer to “Adjusted net earnings” definition above.
Adjusted
earnings divided by the weighted average number of participating shares outstanding.
Assists the reader in comparing the adjusted net asset value on a per share basis; refer to “Adjusted net asset value” definition above.
These non-IFRS financial measures do not have a standard meaning and may not be comparable to similar measures used by other entities.
Adjusted Net Earnings
The following table presents a reconciliation of adjusted net earnings, a non-IFRS financial measure, to net earnings reported in accordance with IFRS. Adjusted net earnings is presented in the section “Contribution to Net
The following table presents the Corporation’s share of Adjustments on a pre- and post-tax basis:
[ ] As reported by Lifeco and IGM.
[ ] The Effect of consolidation reflects i) the elimination of intercompany transactions, including the gain recognized by IGM on the sale of a portion of its interest in Lifeco to the Corporation in the first quarter of 2023; ii) the application of the Corporation’s accounting method for investments under common control to the Adjustments reported by Lifeco and IGM; iii) IGM’s share of Lifeco’s Adjustments, in accordance with the Corporation’s definition of Adjusted net earnings; and iv) adjustments in accordance with IAS 39 for IGM for comparative periods presented prior to the Corporation’s adoption of IFRS 9 on January 1, 2023.
The following table presents a reconciliation of the participating shareholders’ equity reported in accordance with IFRS to the adjusted net asset value, a non-IFRS financial measure. Adjusted net asset value is presented in the section “Adjusted Net Asset
[ ] Refer to the section “Adjusted Net Asset Value” for more details on the fair value and other adjustments.
[ ] Attributable to participating shareholders.
The following table presents the reconciliation of the net earnings attributable to participating shareholders of Power Corporation in accordance with IFRS to the fee-related earnings of the alternative asset investment platforms, a non-IFRS financial measure. Fee-related earnings is presented in the section “Asset Management Activities” of the section “Sagard and Power Sustainable”.
[ ] In the second quarter of 2022, an allocation of certain expenses is included in the Corporation’s other investing activities, which was previously presented in Power Sustainable. The comparative information has been restated to reflect these changes.
This MD&A also includes other measures, which include:
Term
Assets under management and administration
Assets under management and advisement of IGM
Definition
Operating asset management and investment management services businesses within the Power Group, including IGM, alternative asset managers and Wealthsimple, present the total value of assets managed or administered which are beneficially owned by clients and are not recognized in the consolidated financial statements. The composition of the assets under management and administration is relative to the activities of the asset managers and are further defined as follows:
Assets under management are client assets where IGM provides investment management services, and include investment funds where IGM is the fund manager, investment advisory mandates to institutions, and other client accounts where IGM has discretionary portfolio management responsibilities.
Assets under advisement represents savings and investment products, including assets under management where IGM provides investment management services, held within client accounts of IGM’s Wealth Management segment’s operating companies.
Assets under management of alternative asset investment platforms
Assets under management of investment platforms include:
Net asset value of the investment funds and co-investment vehicles managed, including unfunded commitments and unused permanent leverage;
Gross asset value of investment funds managed within the real estate platform; and
Fair value of assets managed on behalf of the Corporation and clients by asset managers controlled within the investment platforms, including assets managed through a separately managed account.
Assets under administration of Wealthsimple
Book value per participating share
Carried interest
Fee-bearing capital
Assets under administration includes the total value of assets held on behalf of clients and includes client assets in which investment management services are provided.
Represents Power Corporation’s participating shareholders’ equity divided by the number of participating shares outstanding at the end of the reporting period.
Carried interest is earned through a contractual arrangement between alternative asset managers and the funds managed in which the asset manager earns a fixed percentage of investment returns over a predetermined hurdle return.
Fee-bearing capital includes:
Total capital commitments of venture capital & growth, private equity, and royalties funds during the investment period;
Net invested capital of private credit funds and funds which have completed their investment period;
Net asset value of Power Sustainable China, Power Sustainable Energy Infrastructure including direct investments in energy assets, and funds within the real estate platform;
Invested capital or gross asset value of assets managed through separately managed accounts within the real estate platform; and Fair value of assets managed on behalf of clients by the wealth management platform.
Market capitalization
Net asset value reported by GBL
Represents the aggregate market value of a company. Market capitalization is determined at a point in time and represents the number of outstanding shares multiplied by the closing share price.
On a quarterly basis, GBL reports its net asset value as it represents an important criterion used in assessing its performance. GBL's net asset value represents the fair value of its investment portfolio, its gross cash and treasury shares, less its gross debt.
GBL’s investments held in listed entities are measured at their market value and its investments in private entities are measured using the recommendations of the International Private Equity and Venture Capital Valuation Guidelines, which represents GBL management’s best estimate. Sienna Investment Managers’ portfolio of investments is measured by adding all investments at fair value provided by the fund managers with Sienna Investment Managers’ net cash, less its net debt. For more information on GBL's net asset value and valuation principles, refer to its website (www.gbl.be).
Net asset value of investment funds
Net carried interest
Unfunded commitments
Net asset value of investment funds represents the fair value of the investments held within the fund, net of any liabilities.
Represents carried interest earned, net of direct employee costs which are usually recognized over the vesting period.
Represents the capital that has been committed by limited partners, but not called by the fund. In some cases, unfunded commitments include distributions, which are recallable by the fund.
[ ] The 2021 quarterly results have not been restated to reflect the adoption of IFRS 17 and IFRS 9 and are therefore not comparable to the results in subsequent periods. Refer to the Corporation’s 2022 Annual MD&A for the presentation of 2022 and 2021 quarterly results pre-adoption.
[ ] Total revenues includes net investment income and change in fair value through profit or loss included in the net investment result on the consolidated statements of earnings.
[ ] Adjusted net earnings attributable to participating shareholders and adjusted net earnings per share, and adjustments and adjustments per share are nonIFRS financial measures. For a definition of these non-IFRS financial measures, please refer to the section “Non-IFRS Financial Measures” in this MD&A.
[4] The Corporation’s share of Lifeco, IGM and Sagard and Power Sustainable’s Adjustments, including the effect of consolidation, and Adjustments of the Corporation including in relation to its investment in ChinaAMC are as follows:
[ ] The 2021 quarterly results have not been restated to reflect the adoption of IFRS 17 and IFRS 9 and are therefore not comparable to the results in subsequent periods. Refer to the Corporation’s 2022 Annual MD&A for the presentation of 2022 and 2021 quarterly results pre-adoption.
on available-for-sale investments
gains (losses) on cash flow hedges
foreign exchange gains (losses) on translation of foreign operations
(ALL TABULAR AMOUNTS ARE IN MILLIONS OF CANADIAN DOLLARS, UNLESS OTHERWISE NOTED.)
Note Corporate Information
Note Basis of Presentation and Summary of Material Accounting Policies
Note Adoption of IFRS Insurance Contracts and IFRS 9, Financial Instruments
Note Business Acquisitions
Note Investments
Note Investments in Jointly Controlled Corporations and Associates
Note Segregated Funds and Other Structured Entities
Note Insurance Contracts
Note 9 Reinsurance Contracts Held
Note Power Corporation’s Debentures and Other Debt Instruments
Note Non-Recourse Debentures and Other Debt Instruments 9
Note Stated Capital
Note Share-Based Compensation
Note Capital Management
Note Risk Management
Note Insurance Revenue
Note Insurance Service and Operating and Administrative Expenses
Note Pension Plans and Other Post-Employment Benefits
Note 9 Income Taxes
Note Other Comprehensive Income
Note Earnings Per Share
Note Fair Value Measurement
Note Segmented Information
The following abbreviations are used in these Consolidated Financial Statements:
Canada Life The Canada Life Assurance Company
ChinaAMC China Asset Management Co., Ltd.
Empower Empower Annuity Insurance Company of America
GBL Groupe Bruxelles Lambert
IFRS International Financial Reporting Standards
IGM or IGM Financial IGM Financial Inc.
IG Wealth Management Investors Group Inc.
Lifeco Great-West Lifeco Inc.
Lion The Lion Electric Co.
Mackenzie or Mackenzie Financial Corporation Mackenzie Investments
MassMutual Massachusetts Mutual Life Insurance Company
Northleaf Northleaf Capital Group Ltd.
OSFI Office of the Superintendent of Financial Institutions
Parjointco Parjointco SA
Portage Ventures I Portag Ventures Limited Partnership
Portage Ventures II
Portage Ventures III
Portag Ventures II Limited Partnership
Portage Ventures III Limited Partnership
Power Corporation or Power Corporation of Canada the Corporation
Power Financial Power Financial Corporation
Power Sustainable Power Sustainable Capital Inc.
Prudential Prudential Financial, Inc.
Sagard Sagard Holdings Inc.
TSX Toronto Stock Exchange
Wealthsimple Wealthsimple Financial Corp.
Power Corporation of Canada is a publicly listed company (TSX: POW; POW.PR.E) incorporated and domiciled in Canada and located at 751 Victoria Square, Montréal, Quebec, Canada, H2Y 2J3.
Power Corporation is an international management and holding company that focuses on financial services in North America, Europe and Asia. Its core holdings are leading insurance, retirement, wealth management and investment businesses, including a portfolio of alternative asset investment platforms.
The unaudited Interim Condensed Consolidated Financial Statements (financial statements) of Power Corporation as at and for the three months ended March 31, 2023 were approved by its Board of Directors on May 15, 2023.
B
The financial statements of Power Corporation as at March 31, 2023 have been prepared in accordance with International Accounting Standard 34 – Interim Financial Reporting (IAS 34) using the same accounting policies as set out in Note 2 to the consolidated financial statements of the Corporation for the year ended December 31, 2022 except as described in the section Changes in Accounting Policies below.
The financial statements include the accounts of Power Corporation and its subsidiaries on a consolidated basis after elimination of intercompany transactions and balances and consolidation adjustments.
The financial statements of Power Corporation include, on a consolidated basis, the results of Power Financial, a reporting issuer in all of the provinces and territories of Canada, and Lifeco and IGM Financial, which are both public companies. The amounts shown on the consolidated balance sheets (balance sheets), consolidated statements of earnings (statements of earnings), consolidated statements of comprehensive income (statements of comprehensive income), consolidated statements of changes in equity (statements of changes in equity) and consolidated statements of cash flows (statements of cash flows) are mainly derived from the publicly disclosed consolidated financial statements of Lifeco and IGM Financial, all as at and for the three months ended March 31, 2023. Certain notes to Power Corporation’s financial statements are derived from the notes to the financial statements of Lifeco and IGM Financial.
Subsidiaries, including controlled investment funds, are entities the Corporation controls when: (i) the Corporation has power over the entity; (ii) it is exposed or has rights to variable returns from its involvement; and (iii) it has the ability to affect those returns through its use of power over the entity. Subsidiaries of the Corporation are consolidated from the date of acquisition, being the date on which the Corporation obtains control, and continue to be consolidated until the date such control ceases. The Corporation reassesses whether or not it controls an entity if facts and circumstances indicate there are changes to one or more of the elements of control listed above.
Jointly controlled corporations are entities in which unanimous consent is required for decisions relating to relevant activities. Associates are entities in which the Corporation exercises significant influence over the entity’s operating and financial policies, without having control or joint control. Investments in jointly controlled corporations and associates are accounted for using the equity method. Under the equity method, the Corporation recognizes its share of net earnings (losses) and other comprehensive income (loss) of the jointly controlled corporations and associates, and dividends received.
In the case of investments in jointly controlled corporations and associates held by entities that meet the definition of a venture capital organization, the Corporation has elected to measure certain of its investments in jointly controlled corporations and associates at fair value through profit or loss.
The
[ ] Power Financial holds a 68.2% equity interest and IGM Financial holds a 2.4% equity interest in Lifeco (66.6% and 4.0%, respectively, at December 31, 2022).
[ ] On January 12, 2023, the Corporation and IGM completed a transaction under which the interest in ChinaAMC was combined under IGM Financial (13. % held respectively by Power Corporation and Mackenzie Investments at December 31, 2022). In a separate agreement, IGM sold approximately 15.2 million common shares of Lifeco, representing a 1.6% equity interest in Lifeco, to Power Financial.
[ ] Lifeco holds 100% of the voting shares and 6.4% of the total outstanding shares ( 6.4% at December 31, 2022).
[ ] Power Financial holds a 62.1% equity interest and Canada Life holds a 3. % equity interest in IGM Financial (62.2% and 3. %, respectively, at December 31, 2022).
[ ] Represents a 4 % non-controlling voting interest. Held through an acquisition vehicle 80% owned by Mackenzie Investments and 20% by Lifeco.
[ ] Parjointco has a controlling interest in GBL and holds 44.0% of the voting interest.
[ ] Power Corporation holds a 3 .2% equity interest and Lifeco holds a 14. % equity interest in Power Sustainable Energy Infrastructure Partnership (3 .4% and 14. %, respectively, at December 31, 2022).
[ ] Power Corporation and Lifeco hold an equity interest of 7 .0% and 7.0%, respectively, in Sagard Holdings Management Inc. (80. % and 6. %, respectively, at December 31, 2022).
[9] Power Financial, Portage Ventures I and IGM Financial hold an equity interest of 13.5%, 10.8% and 2 %, respectively, in Wealthsimple (13.5%, 10.8% and 30.0%, respectively, at December 31, 2022).
[ ] Power Financial holds a 63.0% equity interest and Lifeco and IGM Financial each hold an equity interest of 18.5% in Portage Ventures I.
[ ] Power Financial, Lifeco and IGM Financial each hold an equal equity interest of 7.7% and Sagard holds a 4.7% equity interest in Portage Ventures II.
[ ] Sagard, Lifeco and IGM Financial hold an equity interest of 2.4%, .0% and 4.0%, respectively, in Portage Ventures III.
The Corporation and its subsidiaries adopted IFRS 17, Insurance Contracts (IFRS 17) and IFRS , Financial Instruments (IFRS ), which replaced IFRS 4, Insurance Contracts (IFRS 4) and IAS 3 , Financial Instruments: Recognition and Measurement (IAS 3 ), respectively, on their effective date of January 1, 2023. The Corporation has also applied IFRS as at January 1, 2023 when applying the equity method of accounting to GBL’s results.
IFRS 17, which impacted only Lifeco due to its insurance activities, establishes principles for the recognition, measurement, presentation and disclosure of insurance contracts. Under IFRS 17, groups of contracts are measured by Lifeco at the estimate of the present value of fulfillment cash flows, adjusted for an explicit risk adjustment for non-financial risk and the contractual service margin (CSM).
IFRS includes changes to the accounting of financial instruments for the following:
i) classification and measurement of financial instruments based on a business model approach for managing financial assets and the contractual cash flow characteristics of the financial asset;
ii) impairment based on an expected loss model; and
iii) hedge accounting that incorporates the risk management practices of an entity.
The accounting policies materially impacted by the adoption of IFRS 17 and IFRS are described below.
The Corporation also adopted the amendments to IFRS for IAS 1, Presentation of Financial Statements, IAS 8, Accounting Policies, Changes in Accounting Estimates and Errors and IAS 12, Income Taxes effective January 1, 2023. The adoption of these amendments did not have a material impact on the Corporation’s financial statements.
The following describes the accounting policies materially impacted by the adoption of IFRS 17 and IFRS
Under IFRS , a financial asset is measured at fair value on initial recognition and is classified and subsequently measured as fair value through profit or loss (FVPL), fair value through other comprehensive income (FVOCI), or amortized cost based upon the Corporation’s or its subsidiaries’ business models for managing these assets and the contractual cash flow characteristics of these assets.
Investments in shares are classified on initial recognition as FVPL unless an irrevocable designation is made to classify an individual instrument as FVOCI. The cumulative gains or losses related to FVOCI equity instruments are not reclassified to the statements of earnings on disposal but rather reclassified to retained earnings when the investment is sold.
Business models are determined at the level that reflects how groups of financial assets are managed together to achieve business objectives.
A financial asset is classified as FVOCI if it meets the following criteria and is not designated as FVPL:
i) it is held in a business model whose objective is to hold to collect contractual cash flows and sell financial assets; and
ii) its contractual terms give rise on specified dates to cash flows that are solely payments of principal and interest (SPPI) on the principal amount outstanding.
A financial asset is classified as amortized cost if it meets the following criteria and is not designated as FVPL:
i) it is held in a business model whose objective is to hold to collect contractual cash flows; and
ii) its contractual terms give rise on specified dates to cash flows that are SPPI on the principal amount outstanding.
FVOCI investments are recognized at fair value on the balance sheets with unrealized gains and losses recorded in the statements of comprehensive income. Realized gains and losses on FVOCI debt investments are reclassified from other comprehensive income and recorded in the statements of earnings when the investment is sold.
Any financial asset that does not qualify for measurement at amortized cost or FVOCI is classified as FVPL. For financial instruments that meet the amortized cost or FVOCI criteria, the Corporation and its subsidiaries may designate, at initial recognition, such financial instruments as FVPL if doing so eliminates or significantly reduces an accounting mismatch that would otherwise arise. Investments measured as FVPL are recognized at fair value on the balance sheets with realized and unrealized gains and losses recorded in the statements of earnings.
Interest income earned on bonds and mortgage and other loans is calculated using the effective interest method and is recorded as net investment income in the statements of earnings.
The Corporation and its subsidiaries maximize the use of observable inputs when measuring fair value. The following is a description of the methodologies used to value instruments carried at fair value.
Fair values for bonds measured as FVPL or FVOCI are determined with reference to quoted market bid prices primarily provided by third-party independent pricing sources. Where prices are not quoted in an active market, fair values are determined by valuation models. The Corporation and its subsidiaries obtain quoted prices in active markets, when available, for identical assets at the balance sheet date to measure bonds at fair value in its FVPL and FVOCI portfolios.
The Corporation and its subsidiaries estimate the fair value of bonds not traded in active markets by referring to actively traded securities with similar attributes, dealer quotations, matrix pricing methodology, discounted cash flow analyses and/or internal valuation models. This methodology considers such factors as the issuer's industry, the security's rating, term, coupon rate and position in the capital structure of the issuer, as well as yield curves, credit curves, prepayment rates and other relevant factors. For bonds that are not traded in active markets, valuations are adjusted to reflect illiquidity, and such adjustments generally are based on available market evidence. In the absence of such evidence, management's best estimate is used.
There are no market-observable prices for mortgage and other loans; therefore, fair values for mortgage and other loans are determined by discounting expected future cash flows using current market rates for similar instruments. Valuation inputs typically include benchmark yields and risk-adjusted spreads based on current lending activities and market activity.
There are no market-observable prices for equity-release mortgages; Lifeco uses an internal valuation model which is based on discounting expected future cash flows and considering the embedded no-negative-equity guarantee. Inputs to the model include market-observable inputs such as benchmark yields and risk-adjusted spreads. Non-market-observable inputs include property growth and volatility rates, expected rates of voluntary redemptions, death, moving to long-term care and interest cessation assumptions and the value of the no-negative-equity guarantee.
Fair values of publicly traded shares are generally determined by the last bid price for the security from the exchange where it is principally traded. Fair values of shares for which there is no active market are typically based upon alternative valuation techniques such as discounted cash flow analysis, review of price movement relative to the market and utilization of information provided by the underlying investment manager. The Corporation and its subsidiaries obtain quoted prices in active markets, when available, for identical assets at the balance sheet date to measure shares at fair value in its fair value through profit or loss portfolio.
As permitted under IFRS , the Corporation and its subsidiaries elected to continue to apply the hedge accounting principles under IAS 3 instead of those under IFRS . The accounting policy for hedge accounting is disclosed in the notes to the consolidated financial statements of the Corporation for the year ended December 31, 2022.
Under IFRS , expected credit loss (ECL) allowances are recognized on all financial assets, except for financial assets classified or designated as FVPL and equity instruments designated as FVOCI. The ECL model under IFRS replaces the incurred loss model under IAS 3
The Corporation and its subsidiaries measure loss allowances at either a 12-month ECL or lifetime ECL. A 12-month ECL results from any default events that could potentially occur within the 12 months following the reporting date. A 12-month ECL is calculated for financial assets that are determined to have low credit risk or a credit risk that has not increased significantly since initial recognition. A lifetime ECL results from all possible default events over the expected life of the financial asset, which is the maximum contractual period over which the Corporation or its subsidiaries are exposed to the credit risk. A lifetime ECL is recognized for financial assets that have experienced a significant increase in credit risk since initial recognition or when there is objective evidence of impairment.
The ECL allowance is based on a probability-weighted estimate of credit losses expected as a result of defaults over the relevant time period as prescribed under the ECL model. The measurement of ECL for a financial asset is based primarily on the exposure at default, the probability of default, and the loss given default. The measurement of ECL allowances requires the use of judgment and assumptions.
For performing financial assets, the ECL is calculated as the present value of all cash shortfalls, which are the difference between cash flows due to the Corporation and its subsidiaries and the cash flows expected to be received. For financial assets that are impaired, the ECL is calculated as the difference between the carrying value of the asset and the present value of estimated future cash flows. Financial assets that are subject to ECL allowances are categorized into three stages:
Category Description
Stage 1
Performing financial assets that have not experienced a significant increase in credit risk since initial recognition or have low credit risk are categorized into stage 1.
A 12-month ECL allowance is calculated for stage 1 financial assets. To assess if credit risk has increased significantly, the Corporation and its subsidiaries compare the risk of default at initial recognition to the risk as at the current reporting date.
Stage 2
Performing financial assets that have experienced a significant increase in credit risk since initial recognition are categorized into stage 2.
A lifetime ECL allowance is calculated for stage 2 financial assets. Financial assets are assessed for a significant increase in credit risk on an individual basis, utilizing the Corporation and its subsidiaries’ internal credit risk rating system and the monitoring of timely payments on the assets. Financial assets that have contractual payments more than 30 days past due are generally presumed to have experienced a significant increase in credit risk and are included in stage 2. A financial asset in stage 2 can revert to stage 1 if the credit risk subsequently improves.
Stage 3
Impaired financial assets are categorized into stage 3 and require a lifetime ECL allowance.
Financial assets are reviewed on an individual basis at the end of each reporting period to determine whether there is any objective evidence of impairment. The Corporation and its subsidiaries consider various factors in the impairment evaluation process, including, but not limited to, the financial condition of the issuer, specific adverse conditions affecting an industry or region, decline in fair value not related to interest rates, bankruptcy or defaults, and delinquency in payments of interest or principal.
Financial assets are deemed to be impaired when there is no longer reasonable assurance of collection. The fair value of a financial asset is not a definitive indicator of impairment, as it may be significantly influenced by other factors, including the remaining term to maturity and liquidity of the asset; however, market price is taken into consideration when evaluating impairment.
The ECL allowance for financial assets classified as FVOCI is recognized in the statements of comprehensive income and does not reduce the carrying value of the asset. Financial assets classified as amortized cost are presented net of the ECL allowance in the balance sheets.
When there is no expectation of recovery, the Corporation and its subsidiaries will partially or fully write off a financial asset against the related allowance for credit loss. Losses arising from impairment are reclassified from other comprehensive income to net earnings. Financial assets that are written off could still be subject to enforcement activities. In subsequent periods, any recoveries of amounts previously written off are credited to the provision for credit losses and are recognized as net investment income in the statements of earnings.
Insurance contracts are identified as arrangements where Lifeco accepts significant insurance risk from another party (the policyholder) by agreeing to compensate the policyholder or beneficiary of the contract for specified uncertain future events that adversely affect the policyholder and whose amount and timing is unknown.
Lifeco determines whether a contract contains significant insurance risk by assessing if an insured event could cause Lifeco to pay to the policyholder additional amounts that are significant in any single scenario with commercial substance, even if the insured event is extremely unlikely or the expected present value of the contingent cash flows is a small proportion of the expected present value of the remaining cash flows from the insurance contract. In making this assessment, Lifeco considers all its substantive rights and obligations, whether they arise from contract, law or regulation.
When Lifeco issues insurance contracts to compensate another entity for claims arising from one or more insurance contracts issued by that other entity, the associated contracts are reinsurance contracts issued, which is part of insurance contracts issued.
Lifeco enters into arrangements to transfer insurance risk, along with the respective premiums, to one or more reinsurers that will share the risks. To the extent that assuming reinsurers are unable to meet their obligations, Lifeco remains liable to its policyholders for the portion reinsured. Contracts of this nature are defined as reinsurance contracts held.
At inception, the following components from an insurance or reinsurance contract held are separated and accounted for as if they were standalone financial instruments:
Embedded derivatives: derivatives embedded in the contract which have economic characteristics and risks that are not closely related to those of the host contract, and which have terms that would not meet the definition of an insurance or reinsurance contract held as a standalone instrument; and
Distinct investment components: investment components that are not highly interrelated with the insurance components and for which contracts with equivalent terms are sold, or could be sold, separately in the same market or the same jurisdiction.
After separating any financial instrument components, Lifeco also separates any promises to transfer distinct goods or noninsurance services to policyholders and accounts for them as separate contracts with customers in accordance with IFRS 15, Revenue from Contracts with Customers. A good or service is distinct if the policyholder can benefit from it either on its own or with other resources that are readily available to the policyholder. A good or service is not distinct and is accounted for together with the insurance component if the cash flows and risks associated with the good or service are highly interrelated with the cash flows and risks associated with the insurance component, and Lifeco provides a significant service of integrating the good or service with the insurance component.
The level of aggregation for insurance contracts issued is determined by dividing the business written into portfolios. Portfolios comprise groups of contracts with similar risks which are managed together. Lifeco has defined portfolios of insurance contracts issued based on its product lines. Portfolios are further disaggregated into groups of contracts that are issued within an annual period (typically a financial year) and are further divided into: onerous contracts and all other contracts. An insurance contract is onerous if, at the date of initial recognition, the estimated fulfillment cash flow expectations determined on a probability-weighted basis is a net outflow. Lifeco’s evaluation of whether contracts are onerous is based on reasonable and supportable information.
In determining groups of contracts, Lifeco has elected to include in the same group contracts where its ability to set prices or levels of benefits for policyholders with different characteristics is constrained by regulation. Contracts are aggregated into groups once they have been initially recognized.
Lifeco has defined portfolios of reinsurance contracts held based on the portfolios of the underlying insurance contracts issued. Groups of reinsurance contracts held that are entered into within an annual period (typically a financial year) are divided based on whether they are in a net gain or net loss position at initial recognition.
Some reinsurance contracts held provide cover for underlying contracts that are included in different groups. However, these contracts’ legal form of a single contract reflects the substance of Lifeco’s contractual rights and obligations, considering that the different remaining coverages lapse together and are not sold separately. As a result, the reinsurance contract held is not separated into multiple insurance components that relate to different underlying groups.
A group of insurance contracts that it had issued is recognized from the earliest of:
The beginning of the coverage period of the group of contracts;
The date when the first payment from a policyholder in the group becomes due or when the first payment is received if there is no due date; and
For a group of onerous contracts, when the group becomes onerous if facts and circumstances indicate there is such a group.
A group of reinsurance contracts held is recognized on the following date:
Reinsurance contracts held initiated by Lifeco that provide proportionate coverage: the date on which any underlying insurance contract is initially recognized;
Other reinsurance contracts held initiated by Lifeco: the beginning of the coverage period of the group of reinsurance contracts. However, if Lifeco recognizes an onerous group of underlying insurance contracts on an earlier date and the related reinsurance contract held was entered into before that earlier date, then the group of reinsurance contracts held is recognized on that earlier date; and
Reinsurance contracts held that are acquired by Lifeco: the date of acquisition.
The measurement of a group of insurance and reinsurance contracts held includes all the future cash flows within the boundary of each contract in the group. Cash flows are within the boundary of a contract if they arise from substantive rights and obligations that exist during the reporting period in which Lifeco can compel the policyholder to pay the premiums (or is compelled to pay amounts to a reinsurer), or in which Lifeco has a substantive obligation to provide the policyholder with services (or receive services from a reinsurer). A substantive obligation to provide services ends when:
Lifeco has the practical ability to reassess the risks of the particular policyholder and, as a result, can set a price or level of benefits that fully reflects those risks, or Both the following criteria are satisfied:
Lifeco has the practical ability to reassess the risks of the portfolio of insurance contracts that contain the contract and, as a result, can set a price or level of benefits that fully reflects the risk of that portfolio; and
The pricing of the premiums for coverage up to the date when the risks are reassessed does not take into account the risks that relate to periods after the reassessment date.
For reinsurance contracts held, a substantive obligation to receive services ends when the reinsurer has the practical ability to reassess the risk transferred to it and, as a result, can set a price or level of benefits that fully reflects those risks, or the reinsurer has the substantive right to terminate the coverage.
For insurance contracts with renewal periods, Lifeco assesses whether premiums and related cash flows that arise from the renewed contract are within the contract boundary. The pricing of renewals is established by Lifeco after considering the risks and terms of coverage for the policyholder, with reference to the pricing of contracts with equivalent risks and terms on the renewal dates. Lifeco reassesses the contract boundary of each group at the end of each reporting period.
Liabilities or assets relating to expected premiums or claims outside the boundary of the insurance contract are not recognized. Such amounts relate to future insurance contracts.
There are three measurement models provided by IFRS 17 to measure insurance contracts: The General Measurement Model; The Variable Fee Approach; and The Premium Allocation Approach.
The model is applied to Lifeco’s medium- to long-term insurance products, such as individual protection, payout annuities, and longevity swaps.
On initial recognition, a group of insurance contracts is measured as the total of the fulfillment cash flows and the CSM.
Fulfillment cash flows comprise probability-weighted estimates of future cash flows, discounted to reflect the time value of money and the associated financial risks, plus a risk adjustment for non-financial risk.
Lifeco estimates future contractual cash flows within the contracts’ boundaries by considering evidence from current and past conditions, as well as possible future conditions, to reflect market and non-market variables impacting the valuation of cash flows. The estimates of these cash flows are based on probability-weighted expected values that reflect the average of a full range of possible outcomes and include an explicit risk adjustment for non-financial risk. The risk adjustment is the compensation Lifeco receives in fulfilling an insurance contract that arises from uncertainties surrounding the amount and timing of cash flows for non-financial risks. The non-financial risk assumptions are mortality, longevity, morbidity, lapse, an d expense. Estimates and assumptions are reviewed periodically for appropriateness in reflecting current, past, and future conditions.
When estimating fulfillment cash flows, Lifeco includes all cash flows that are within the contract boundary including:
Premiums and related cash flows;
Claims and benefits, including reported claims not yet paid, incurred claims not yet reported and expected future claims;
Premium and other transaction-based taxes and cash flows from loans to policyholders; Insurance acquisition cash flows which are allocated to groups of contracts on a systematic and rational basis; Other fixed and variable expenses directly attributable to the fulfillment of insurance contracts; Investment expenses incurred in investment activities related to underlying items such as universal life funds and segregated fund account balances that are also included in the fulfillment cash flows; and The impact of funds withheld for reinsurance contracts issued to manage credit risk.
The CSM of a group of insurance contracts represents the unearned profit that Lifeco expects to recognize in the future as it provides services under those contracts.
On initial recognition of a group of insurance contracts, if the total of the fulfillment cash flows, any derecognized assets for insurance acquisition cash flows and any cash flows arising at that date is a net inflow, the group of contracts is non-onerous In this case, the CSM is measured as the equal and opposite amount of the net inflow, which results in no net income or expenses arising on initial recognition.
Lifeco measures time value of money using discount rates that are consistent with observable market prices and reflect the liquidity characteristics of the insurance contracts. They exclude the effect of factors that influence such observable market prices but do not affect the future cash flows of the insurance contracts (e.g., credit risk).
Lifeco applies the top-down approach for insurance contract liabilities with backing assets. Under this approach, discount rates are estimated by starting from the yield curve implied in a reference portfolio of assets that closely reflects the duration, currency, and liquidity characteristics of the insurance cash flows, and then excluding the effects of risks (e.g., credit risk) present in the cash flows from the financial instruments that are part of the reference portfolio, but not in the insurance contract cash flows. Lifeco uses the fixed income assets supporting the insurance contract liabilities as the reference portfolio to determine the discount rates in the observable period, while the discount rates in the unobservable period are based on an ultimate investment rate. In situations where the fixed income assets supporting the insurance contract liabilities do not appropriately reflect the illiquidity characteristics of the liability, an additional adjustment is made to the discount rate.
In cases where there are no backing assets, Lifeco applies the bottom-up approach to set the discount rate. This approach uses a risk-free rate, plus a spread to reflect the liquidity characteristics of the liability. Risk-free rates are determined by reference to highly liquid government securities in the currency of the insurance contract liability, and the spread is derived from an external benchmark.
The risk adjustment for non-financial risk represents the compensation that Lifeco requires for bearing uncertainty in the amount and timing of insurance contract cash flows due to non-financial risk.
Lifeco estimates the probability distribution of each non-financial risk and applies a diversification matrix to derive the confidence level of the risk adjustment. Lifeco has a target confidence level between the 85th to 0th percentile. Risk adjustment is calculated by applying a margin to the non-financial assumptions.
Insurance acquisition cash flows arise from selling and underwriting activities required to initiate a group of contracts.
Any assets or liabilities for insurance acquisition cash flows recognized before the corresponding insurance contracts are recognized and included in the carrying amount of the related groups of insurance contracts issued. Judgments are applied by management of Lifeco to determine which costs are directly attributable to the issuance of a group of contracts and the portion of those costs that are allocated to groups of contracts arising from expected renewals.
The asset for insurance acquisition cash flows is tested for impairment annually or more frequently if facts and circumstances indicate that impairment may have occurred. In testing for impairment, the carrying value of the asset is compared to the expected net cash inflow for the related group of insurance contracts.
Additionally, if a portion of the asset for insurance acquisition cash flows has been allocated to future renewals of the related group of contracts, the carrying value of the asset is compared to the expected net cash inflow for those expected renewals. If the carrying value exceeds the expected net cash inflows described above, a loss is recognized in the insurance service result. In the event that facts and circumstances indicate the asset for insurance acquisition cash flows is no longer impaired, the impairment loss, or a portion thereof, is reversed.
The carrying amount of a group of insurance contracts at each reporting date is the sum of the liability for remaining coverage and the liability for incurred claims. The liability for remaining coverage comprises the fulfillment cash flows that relate to services that will be provided under the contracts in future periods and any remaining CSM at that date. The liability for incurred claims comprises the fulfillment cash flows for incurred claims and expenses that have not yet been paid, including claims that have been incurred but not yet reported.
The fulfillment cash flows for groups of insurance contracts are measured at the reporting date using current estimates of future cash flows, current discount rates and current estimates of risk adjustment for non-financial risk.
For a group of insurance contracts, the carrying amount of the CSM of the group at the end of the reporting period equals the carrying amount at the start of the reporting period, adjusted for:
The CSM of any new contracts that are added to the group in the period;
Interest accreted on the carrying amount of the CSM during the period, measured at the discount rates on nominal cash flows that do not vary based on the returns on any underlying items determined on initial recognition;
The changes in fulfillment cash flows that relate to future services (measured using initial recognition discount rates), except to the extent that:
Any increases in the fulfillment cash flows that exceed the carrying amount of the CSM, in which case the excess is recognized as a loss in the statements of earnings and creates a loss component; or
Any decreases in the fulfillment cash flows are allocated to the loss component, reversing losses previously recognized in the statements of earnings;
The effect of any currency exchange differences on the CSM; and
The amount recognized as insurance revenue because of the services provided in the period.
The changes in fulfillment cash flows relating to future services that adjust the CSM comprise:
Experience adjustments arising from premium and premium-related cash flows received in the period that relate to future services;
Changes in both estimates of the present value of future cash flows and risk adjustment in the liability for remaining coverage, measured at the discount rates determined on initial recognition, except for those that relate to the effects of the time value of money and financial risk changes; and
Differences between any investment components not separated from the contract expected to become payable in the period (after allowing for financial experience variance) and the actual investment component that becomes payable in the period, measured at the discount rates determined on initial recognition.
Changes in expected future discretionary cash flows are regarded as an assumption relating to future services and accordingly adjust the CSM.
Changes in fulfillment cash flows that relate to current or past service are recognized in the statements of earnings as part of the insurance service result. Changes that relate to the effects of the time value of money and financial risk are recognized in insurance finance income or expenses.
This model is applied to Lifeco’s contracts with direct participating features such as participating insurance and segregated fund business with insurance guarantees, where an investment return is provided to the policyholder based on a defined pool of items (e.g., a portfolio of assets).
An insurance contract is recognized under the variable fee approach if it meets all of the following conditions at initial recognition:
The policyholder participates in a share of a clearly identified pool of underlying items;
Lifeco expects to pay the policyholder an amount equal to a substantial share of the returns from the underlying items; and
The substantial proportion of the cash flows Lifeco expects to pay to the policyholder is expected to vary with cash flows from the underlying items.
Lifeco performs the test for variable fee approach qualification at initial recognition.
Similar to the general measurement model, the variable fee approach initially measures the insurance contract liabilities as the fulfillment cash flows plus CSM.
For a group of insurance contracts applying the VFA, the carrying amount of the CSM of the group at the end of the reporting period equals the carrying amount at the beginning of the reporting period adjusted for the following:
The effect of any new contracts added to the group;
Lifeco’s share of the change in the fair value of the underlying items, except to the extent that:
Lifeco has a previously documented risk management objective and strategy for using derivatives to mitigate financial risk arising from the insurance contracts, as it does for the insured assets contracts;
Lifeco’s share of a decrease in the fair value of the underlying items exceeds the carrying amount of the contractual service margin, giving rise to a loss; or
Lifeco’s share of an increase in the fair value of the underlying items reverses the amount previously recognized as a loss;
The changes in fulfillment cash flows, relating to future service, except to the extent that:
Lifeco has a previously documented risk management objective and strategy for using derivatives to mitigate financial risk arising from the insurance contracts, as it does for insured assets contracts;
Such increases in the fulfillment cash flows exceed the carrying amount of the contractual service margin, giving rise to a loss; or
Such decreases in the fulfillment cash flows are allocated to the loss component of the liability for remaining coverage; The effect of any currency exchange differences on the CSM; and
The amount recognized as insurance revenue because of the services provided in the period.
Lifeco mitigates the financial risks created by guarantees embedded in some of its insurance contracts with direct participation features through the use of derivatives. The derivatives are in the scope of IFRS with changes in their fair value reflected in the statements of earnings. In applying risk mitigation, the financial impact on the guarantees embedded in these direct participating contracts does not adjust the CSM and is also reflected in the statements of earnings.
PREMIUM ALLOCATION APPROACH (PAA)
This model is applied to Lifeco’s short-term insurance products, such as group life and health.
Recognition
Contracts with coverage periods of one year or less
The premium allocation approach is applied to measure the liability for remaining coverage of insurance contracts with coverage periods of one year or less.
Contracts with coverage periods of more than one year
The premium allocation approach is applied to contracts with coverage periods longer than one year that are relatively stable and have low variability in fulfillment cash flows. The low variability in fulfillment cash flows indicates there is no material difference in the liability for remaining coverage measured under the premium allocation approach as compared to the general measurement model. Generally, this applies to products with rate guarantees between 2 and 5 years.
New groups of insurance contracts are assessed to determine whether they can be measured using the premium allocation approach at initial recognition.
The eligibility test for the premium allocation approach model will not be subsequently performed after initial recognition unless there are substantial changes to the terms of the groups of insurance contracts.
Measurement
Initial measurement of the liability for remaining coverage
On initial recognition, the liability for remaining coverage is initially measured as the premiums received in the period minus any insurance acquisition cash flows not expensed, plus or minus any amount caused by the derecognition of an acquisition cash flow asset or liability which represents any acquisition costs that were paid before the contracts were recognized.
Insurance acquisition costs are included as fulfillment cash flows of the liability and are allocated over the contract boundary on a straight-line basis. For contracts with expected future renewals, a portion of the acquisition costs is capitalized as an asset and deferred until the future contract renewals are recognized.
The fulfillment cash flows of contracts with coverage periods of more than one year are discounted to reflect the impact of financial risk on the contract. The discount rates used reflect the characteristics of the contract cash flows. For contracts where premiums are received within one year of the coverage period, Lifeco has elected not to adjust the liability for the time value of money.
At the end of each reporting period, the liability for remaining coverage for contracts under the premium allocation approach is measured as the carrying amount of the liability for remaining coverage at the beginning of the period, adjusted for the following to:
Add the premiums received in the period;
Deduct any insurance acquisition cash flows during the period not directly expensed;
Add the amortization of acquisition cash flows, plus any adjustments to a financing component;
Deduct the amount recognized as insurance revenue for the coverage provided in the period; and
Deduct any investment components paid or transferred to the liability for incurred claims.
If circumstances indicate that a contract under the premium allocation approach model has become onerous, a loss is immediately recognized in the statements of earnings, and a separate component of the liability for remaining coverage is created to record this loss component. The loss is measured as the difference between the fulfillment cash flows that relate to the remaining coverage of the group and the current carrying amount of the liability for remaining coverage using the measurement described above.
The liability for incurred claims is measured under the same approach as the general measurement model, which is the fulfillment cash flows related to incurred claims. When claims are expected to be settled less than one year after being incurred, Lifeco has elected not to discount the liability for incurred claims.
The accounting policies used to measure a group of insurance contracts under the general measurement model apply to the measurement of a group of reinsurance contracts held, with the following modifications:
The carrying amount of a group of reinsurance contracts held at each reporting date is the sum of the remaining coverage component and the incurred claims component. The remaining coverage component comprises: The fulfillment cash flows that relate to services that will be received under the contracts in future periods; and Any remaining CSM at that date.
Lifeco measures the estimates of the present value of future cash flows using assumptions that are consistent with those used to measure the estimates of the present value of future cash flows for the underlying insurance contracts, with an adjustment for any risk of non-performance by the reinsurer. The effect of the non-performance risk of the reinsurer is assessed at each reporting date and the effect of changes in the non-performance risk is recognized in the statements of earnings.
The risk adjustment for non-financial risk is the amount of the risk transferred by Lifeco to the reinsurer.
On initial recognition, the CSM of a group of reinsurance contracts held represents a net cost or net gain on purchasing reinsurance. It is measured as the equal and opposite amount of the total of the fulfillment cash flows, any derecognized assets for cash flows occurring before the recognition of the group, any cash flows arising at that date and any income recognized in the statements of earnings because of onerous underlying contracts recognized at that date. However, if any net cost on purchasing reinsurance coverage relates to insured events that occurred before the purchase of the group, then the cost is immediately recognized in the statements of earnings as an expense.
Lifeco adjusts the carrying amount of the CSM of a group of reinsurance contracts held at the end of a reporting period to reflect changes in the fulfillment cash flows applying the same approach as for insurance contracts issued, except when the underlying contract is onerous and the change in the fulfillment cash flows for underlying insurance contracts is recognized in profit or loss by adjusting the loss component. The respective changes in reinsurance contracts held are also recognized in profit and loss (adjusting the loss recovery component).
Funds withheld under reinsurance contracts held to manage credit risk are included in the carrying amount of the reinsurance contracts held asset.
Lifeco holds reinsurance contracts with the direct insurance contracts it issues. The reinsurance contracts held that are eligible for the premium allocation approach and have underlying direct contracts measured under the premium allocation approach are also classified and measured under the premium allocation approach.
Lifeco adjusts the CSM of the group to which a reinsurance contract held belongs and as a result recognizes income when it recognizes a loss on initial recognition of onerous underlying contracts, if the reinsurance contract held is entered into before or at the same time as the onerous underlying contracts are recognized. The adjustment to the CSM is determined by multiplying:
The amount of the loss that relates to the underlying contracts; and
The percentage of claims on the underlying contracts that Lifeco expects to recover from the reinsurance contracts held. For reinsurance contracts held that are acquired by Lifeco in a transfer of contracts or a business combination covering onerous underlying contracts, the adjustment to the CSM is determined by multiplying:
The amount of the loss component that relates to the underlying contracts at the date of acquisition; and
The percentage of claims on the underlying contracts that Lifeco expects at the date of acquisition to recover from the reinsurance contracts held.
A loss-recovery component is created or adjusted for the group of reinsurance contracts held to depict the adjustment to the CSM, which determines the amounts that are subsequently presented in the statements of earnings as reversals of recoveries of losses from the reinsurance contracts held and are excluded from the allocation of reinsurance premiums paid in the net expense from reinsurance contracts held.
Amortization of the Contractual Service Margin
The CSM is a component of the group of insurance contracts that represents the unearned profit Lifeco will recognize as it provides services in the future. An amount of the CSM for a group of insurance contracts is recognized in the statements of earnings as insurance revenue in each period to reflect the services provided under the group of insurance contracts in that period. The amount that is recognized in the statements of earnings for the current period is determined by identifying the coverage units in the group, allocating the CSM at the end of the period to each coverage unit provided in the current period and expected to be provided in the future periods.
The number of coverage units in a group is the quantity of coverage provided by the contracts in the group, which is determined by considering the quantity of the benefits provided and the expected coverage duration.
For reinsurance contracts issued, the number of coverage units in a group reflects the expected pattern of underwriting of the underlying contracts because the level of service provided depends on the number of underlying contracts in force. For reinsurance contracts held, the CSM amortization is similar to the reinsurance contracts issued and reflects the expected pattern of underwriting of the underlying contracts because the level of service provided depends on the number of underlying contracts in force.
Insurance revenue depicts the provision of services arising from a group of insurance contracts at an amount that reflects the consideration to which Lifeco expects to be entitled in exchange for those services. Insurance revenue from a group of insurance contracts is therefore the relevant portion for the period of the total consideration for the contracts, (i.e., the amount of premiums paid to Lifeco adjusted for the financing effect (the time value of money) and excluding any investment components).
Insurance finance income or expenses comprise the change in the carrying amount of the group of insurance contracts arising from:
The effect of the time value of money and changes in the time value of money; and The effect of financial risk and changes in financial risk.
The Corporation has elected to recognize insurance finance income or expenses in the statements of earnings.
The Corporation presents separately in the statements of earnings the amounts expected to be recovered from reinsurers, and an allocation of the reinsurance premiums paid. Lifeco considers reinsurance cash flows that are contingent on claims on the underlying contracts as part of the claims that are expected to be reimbursed under the reinsurance contract held, and excludes investment components and commissions from an allocation of reinsurance premiums presented in the statements of earnings. Amounts relating to the recovery of losses relating to reinsurance of onerous direct contracts are included as amounts recoverable from the reinsurer.
When the terms of insurance contracts are modified, Lifeco assesses whether the modification is substantial enough to lead to the derecognition of the original contract and recognition of a new modified contract as if it was entered for the first time. If the contract modification does not lead to a re-recognition of the contract, then the effect of the modification is treated as a change in the estimates of fulfillment cash flows which is recorded as an experience adjustment to the existing contract.
A contract is derecognized when it is extinguished, which is when the specified obligations in the contract expire or are discharged or cancelled.
When an insurance contract not accounted for under the premium allocation approach is derecognized from within a group of insurance contracts:
The fulfillment cash flows allocated to the group are adjusted to eliminate those that relate to the rights and obligations derecognized;
The CSM of the group is adjusted for the change in the fulfillment cash flows, except where such changes are allocated to a loss component; and
The number of coverage units for the expected remaining coverage is adjusted to reflect the coverage units derecognized from the group.
If a contract is derecognized because it is transferred to a third party, then the CSM is also adjusted for the premium charged by the third party, unless the group is onerous.
When an insurance contract accounted for under the premium allocation approach is derecognized, adjustments to the fulfillment cash flows to remove related rights and obligations and account for the effect of the derecognition result in the following amounts being charged immediately to the statements of earnings:
If the contract is extinguished: Any net difference between the derecognized part of the liability for remaining coverage of the original contract and any other cash flows arising from extinguishment; and
If the contract is transferred to the third party: Any difference between the derecognized part of the liability for remaining coverage of the original contract and the premium charged by the third party.
In the preparation of the financial statements, management of the Corporation and management of its subsidiaries are required to make significant judgments, estimates and assumptions that affect the reported amounts of assets, liabilities, net earnings, comprehensive income and related disclosures. Key sources of estimation uncertainty and areas where significant judgments have been made by the management of the Corporation and management of its subsidiaries are further described in the relevant accounting policies in the Corporation’s consolidated financial statements and notes thereto for the year ended December 31, 2022.
Significant judgments, estimates and assumptions that have changed or are new under IFRS 17 and IFRS include:
Classification of insurance and reinsurance contracts
Valuation of insurance and certain investment contract liabilities
Coverage units
Discount rates to apply to insurance contract liability cash flows
Management of Lifeco Determining whether arrangements should be accounted for as insurance, investment or service contracts.
Management of Lifeco Determining the actuarial assumptions, including mortality, longevity, morbidity, expense and policyholder behaviour (Note ).
Management of Lifeco Determining the coverage units, which are based on an estimate of the quantity of coverage provided by the contracts in a group, considering the quantity of benefits provided and the expected coverage duration.
Management of Lifeco Determining the discount rates to apply to most insurance contract liability cash flows.
Lifeco generally uses the top-down approach for cash flows of nonparticipating contracts that do not depend on underlying items. Applying this approach, Lifeco uses the yield curve implied in a reference portfolio of assets and adjusts it to exclude the effects of risks (e.g., credit risk) present in the cash flows from the financial instruments that are part of the reference portfolio, but not in the insurance cash flows. One of the key sources of estimation uncertainty is estimating the market risk premiums for credit risk of the underlying items that are only relevant to assets included in the reference portfolio, but not to the non-participating contracts. For some products, discount rates are set using a bottom-up approach, based on risk-free rates, plus an illiquidity premium, which also requires judgment.
Risk adjustment
Management of Lifeco Judgment is required in estimating the probability distribution of each nonfinancial risk and diversification matrix to derive confidence level when determining risk adjustment.
Onerous contracts
Management of Lifeco Determining at what level of granularity sufficient information is available to conclude that all contracts within a set will be in the same group.
The determination of whether a contract or a group of contracts is onerous is based on the expectations as at the date of initial recognition, with fulfillment cash flow expectations determined on a probability-weighted basis. Lifeco determines the appropriate level at which reasonable and supportable information is available to make this assessment.
Application
Management of Lifeco Determining that obtaining reasonable and supportable information to apply the full retrospective approach was impracticable without undue cost or effort for contracts issued more than several years prior to the IFRS effective date.
Measurement of impairment losses
Management of the Corporation and of its subsidiaries
Judgment is required on measurement of impairment losses under IFRS 9 across relevant financial assets, in particular for the estimation of the amount and timing of future cash flows when determining impairment losses and the assessment of a significant increase in credit risk.
The Corporation and its subsidiaries monitor changes in IFRS, both proposed and released, by the International Accounting Standards Board (IASB) and analyze the effect that changes in the standards may have on the consolidated financial statements when they become effective. There have been no new standards released or significant changes to the future accounting policies disclosed in the December 31, 2022 financial statements.
IFRS 17
IFRS 17 introduces significant changes to the presentation of the Corporation’s financial statements. Portfolios of insurance contracts issued by Lifeco, and reinsurance contracts held that are assets and liabilities, are respectively presented separately.
IFRS 17 also introduces significant measurement differences, including the following:
Reclassification of contracts from insurance to investment contracts; Establishment of the CSM for in-force policies; Net impact of removing margin for adverse deviations (MfADs) and establishing an adjustment for non-financial risk; Adjustment for difference in discount rates; Adjustment for non-attributable expenses; and Other measurement impacts.
Upon transition, IFRS 17 requires an entity to apply the standard retrospectively unless impracticable, in which case the entity shall use either the modified retrospective approach or the fair value approach.
The full retrospective approach requires the Corporation, through Lifeco, to apply the guidance of IFRS 17 as if IFRS 17 had always been applied. It would be considered impracticable in the following situations:
The necessary level of detail for historical information could not be obtained using a reasonable amount of effort; or Estimates required for measurement at the appropriate level of detail could not be determined without the use of hindsight and/or professional judgment could not be applied to such estimates in accordance with the requirements of IFRS 17 or Lifeco’s interpretations and established policies.
Lifeco has performed a cut-off date assessment (by region and product) to determine the contracts to which the full retrospective approach can be applied. The full retrospective approach was applied to all identified insurance contracts unless it was impracticable, in the cases where reasonable and supportable information necessary to complete the full retrospective approach was not available.
The fair value approach calculates the CSM or loss component of the liability for remaining coverage as the difference between the fair value of a group of insurance contracts at the date of transition and the fulfillment cash flows measured at that date. The fair value approach was applied to contracts where it was impracticable to apply the full retrospective approach.
IFRS introduces changes to the classification and measurement of financial instruments as well as the transition from an incurred loss model under IAS 3 to an ECL model for the determination of allowances for credit losses.
Upon adoption of IFRS , the Corporation elected to present comparative information for certain of its financial assets, primarily those held by Lifeco, as if the classification and measurement requirements of IFRS had been applied in the comparative period, on an instrument-by-instrument basis, as permitted by the amendment to IFRS 17 published by the IASB in December 2021.
The changes in accounting policies resulting from the adoption of these standards had an impact on the Corporation’s opening equity balances.
The quantitative impact of transitioning to IFRS 17 and IFRS is illustrated in the opening balance sheet reconciliation table below:
The adoption of IFRS 17 and the IFRS overlay resulted in an overall reduction of total assets of $13.6 billion, total liabilities of $10.2 billion, and total equity of $3.4 billion on the transition balance sheet as at January 1, 2022.
Asset and liability reclassifications were driven by changes to the groupings of certain assets and liabilities. Significant reclassifications included $8.3 billion of loans to policyholders, $7. billion of funds held by ceding insurers, and $1. billion of premiums in the course of collection reclassified to insurance contract liabilities. In addition, $40.5 billion of insurance contract liabilities were reclassified to investment contract liabilities, and insurance contract assets of $1.5 billion and reinsurance contract held liabilities of $1.3 billion were established.
The presentation of liabilities on account of segregated fund policyholders was separated between insurance and investment contract liabilities.
IFRS adjustments primarily resulted in an increase to assets of $2.6 billion due to a change in designation of certain bonds and mortgage and other loans held at amortized cost under IAS 3 to FVPL under IFRS
IFRS 17 adjustments mainly resulted in an increase to insurance contract liabilities of $6.8 billion, which is primarily the result of the establishment of CSM for in-force contracts of $4.1 billion associated with shareholders' equity and $4.4 billion associated with non-controlling interests, partially offset by risk adjustments related to the transition from IFRS 4 to IFRS 17 of $1.4 billion associated with shareholders’ equity and $0.6 billion associated with non-controlling interests. This does not include the CSM on in-force segregated fund business which does not have a material impact on capital.
Total equity decreased by $3.4 billion, consisting of a $2.3 billion reduction to shareholders’ equity and a $1.1 billion reduction to non-controlling interests.
Shareholders’ equity decreased by $2.3 billion, primarily due to the establishment of the CSM of $4.4 billion and the adjustment for differences in the discount rate of $1.3 billion, offset by increases due to the transition of risk adjustments from IFRS 4 to IFRS 17 of $1.4 billion and the impact of the initial application of the IFRS overlay of $1.5 billion. All other impacts, including taxes, adjustments for non-attributable expenses and from reclassifications, totalled an increase of $0.5 billion.
The non-controlling interests decrease of $1.1 billion was due to the impact of the initial application of IFRS 17 of $2.0 billion, offset by the impact of the application of the IFRS overlay of $0. billion.
For the year ended
December
Net earnings under IFRS and IAS 9, previously reported ,
Impact of initial application of IFRS and IFRS 9 overlay:
Deferral of new business gains within CSM ( )
CSM recognized in the period, net of impact of changes in liabilities for insurance-related risks
Changes in impacts from assumption changes and management actions ( )
Changes in market-related impacts
Attributable to Lifeco’s participating account surplus in subsidiaries ( 9 )
Other, including changes in insurance experience impacts
Tax impacts ( )
Restated net earnings under IFRS and IFRS 9 overlay ,
REINSURANCE CONTRACTS HELD
Reinsurance contracts held under fair value approach
CSM beginning balance, as at January , 9
Change related to current service provided
CSM recognized for services provided
Changes that relate to future service
Contracts initially recognized in the year
Changes in estimates that adjust the CSM
Total changes in insurance service result
Net finance expenses from reinsurance contracts
Total change
Other reinsurance contracts held CSM beginning balance, as at January ,
Change related to current service provided
CSM recognized for services provided
Changes that relate to future service
Contracts initially recognized in the year
Changes in estimates that adjust the CSM
Total changes in insurance service result
Net finance expenses from insurance contracts
Total change
Net closing balance, as at December
,
TRANSITION
EFFECT OF INITIAL APPLICATION
The following table shows the reconciliation of each class of financial asset from the original measurement category under IAS 3 to the new measurement category under IFRS :
Classification
Financial Assets
Bonds
9
Designated as fair value through profit or loss
Classified as fair value through profit or loss
Available for sale
Loans and receivables
9
Designated as fair value through profit or loss
Classified as fair value through profit or loss
Classified as fair value through profit or loss
Fair value through other comprehensive income
Amortized cost
Designated as fair value through profit or loss
Fair value through other comprehensive income
Amortized cost
Mortgage and other loans
Designated as fair value through profit or loss
Available for sale
Loans and receivables
Classified as fair value through profit or loss
Classified as fair value through profit or loss
Designated as fair value through profit or loss
Fair value through other comprehensive income
Amortized cost
Shares
Designated as fair value through profit or loss
Available for sale
Classified as fair value through profit or loss
Classified as fair value through profit or loss
Fair value through other comprehensive income
NOTE 3 Adoption of IFRS 17, Insurance Contracts and IFRS 9, Financial Instruments (continued)
Reconciliation of carrying value of assets from IAS 39 to IFRS 9 The following table reconciles the carrying value of financial assets under IAS 3 to the carrying value under IFRS :
The adoption of IFRS , on January 1, 2023, resulted in a reclassification of available-for-sale investments to fair value through profit or loss investments and has led to a reclassification of the investment revaluation reserves to retained earnings of $305 million.
Financial assets measured at fair value through profit or loss are not subject to the ECL model. The ECL model only applies to FVOCI and amortized cost assets, and the value of ECL allowances upon adoption of IFRS at January 1, 2023 of $38 million was not materially different from the allowances that was carried under IAS 3 . Of the ECL allowance of $38 million at January 1, 2023, $6 million was stage 1 and $32 million were stage 2.
The ECL allowance was $36 million at March 31, 2023, of which $5 million was stage 1 and $31 million was stage 2.
On April 3, 2023, Lifeco and IGM announced that they have entered into an agreement whereby Lifeco will acquire 100% of Investment Planning Counsel Inc. (IPC), a leading independent wealth management firm, from IGM, for cash consideration of $575 million, subject to adjustments.
This is a related party transaction, and therefore, the transaction was reviewed and approved by the appropriate related party and conduct review committee. The transaction is expected to close in the fourth quarter of 2023, subject to the customary closing conditions and regulatory approvals.
The Corporation currently consolidates IPC and therefore the transaction will not have a significant impact on the consolidated statements of earnings and balance sheets.
are as follows:
[ ] The Corporation has elected to apply the overlay approach on an instrument-by-instrument basis and has presented the comparative information for the classification and measurement requirements of IFRS 9 for certain investments.
] The Corporation has elected to apply the overlay approach on an instrument-by-instrument basis and therefore includes the application of the IFRS 9 overlay for certain instruments.
Investment income from bonds and mortgage and other loans includes interest income and premium and discount amortization. Income from shares includes dividends and distributions from equity investment funds and gains realized on deconsolidation of subsidiaries and investment funds. Investment properties income includes rental income earned on investment properties, ground rent income earned on leased and subleased land, fee recoveries, lease cancellation income, and interest and other investment income earned on investment properties. Other income includes foreign exchange gains and losses, income earned from derivative financial instruments and other miscellaneous income.
The carrying values of the investments in jointly controlled corporations and associates are as follows:
[ ] IFRS 9 was adopted on January , . The comparative information is in accordance with IAS 9.
[ ] Includes investments in jointly controlled corporations and associates held by entities that meet the definition of a venture capital organization, which have been elected to be measured at fair value through profit or loss.
On January 12, 2023, IGM acquired a 13. % equity interest in ChinaAMC from Power Corporation for an aggregate consideration of $1.15 billion in cash, increasing IGM’s equity interest in ChinaAMC from 13. % to 27.8%. The consolidated financial statements continue to include a 27.8% equity interest in ChinaAMC through the Corporation’s interest in IGM; therefore this transaction did not have a significant impact on the consolidated statements of earnings and balance sheets.
On April 3, 2023, IGM acquired a 20.5% equity interest in Rockefeller Capital Management, a leading U.S. independent financial services advisory firm focused on the high-net-worth and ultra-high-net-worth segments, for cash consideration of approximately US$622 million, payable on June 2, 2023.
The following presents details of the investments, determined in accordance with the relevant statutory reporting requirements of each region of Lifeco’s operations, on account of segregated fund policyholders:
[ ] The Corporation has adjusted certain comparative figures to conform to the current year's presentation. These adjustments had no impact on the equity or net earnings of the Corporation.
[ ] At March 31, 2023, $67,67 million of investments on account of segregated fund policyholders are reinsured by Lifeco on a modified co-insurance basis ($66,283 million at December 31, 2022). Included in this amount are $276 million of cash and cash equivalents, $12,343 million of bonds, $15 million of shares and units in unit trusts, $55,121 million of mutual funds, $ 0 million of accrued income and $166 million of other liabilities.
[ ] The Corporation has adjusted certain comparative figures to conform to the current year's presentation. These adjustments had no impact on the equity or
CONTRACTS ON ACCOUNT OF SEGREGATED FUND POLICYHOLDERS (by fair value hierarchy level)
Investments on account of segregated fund policyholders [ ] , 9 , , , [ ] Excludes other liabilities, net of other assets, of $4, 81 million.
Investments on account of segregated fund policyholders [ ][ ] , 9 , , 9 , [ ] Excludes other liabilities, net of other assets, of $4,185 million.
[2] The Corporation has adjusted certain comparative figures to conform to the current year's presentation. These adjustments had no impact on the equity or net earnings of the Corporation.
During the three months ended March 31, 2023, certain foreign equity holdings valued at $4,580 million were transferred from Level 1 to Level 2 ($2,301 million were transferred from Level 2 to Level 1 at December 31, 2022), primarily based on Lifeco’s change in use of inputs in addition to quoted prices in active markets for certain foreign equity holdings. Level 2 assets include the assets where fair value is not available from normal market pricing sources, where inputs are utilized in addition to quoted prices in active markets and where Lifeco does not have access to the underlying asset details within an investment fund.
The following presents additional information about Lifeco’s investments on account of segregated fund policyholders for which Lifeco has utilized Level 3 inputs to determine fair value:
Transfers into Level 3 are due primarily to decreased observability of inputs in valuation methodologies. Transfers out of Level 3 are due primarily to increased observability of inputs in valuation methodologies as evidenced by corroboration of market prices with multiple pricing vendors.
Included in the insurance contract balances are policyholder loans of $ ,013 million and funds withheld on reinsurance contracts issued by Lifeco of $4,152 million ($8, million and $4,105 million, respectively, at December 31, 2022).
ANALYSIS BY REMAINING COVERAGE AND INCURRED CLAIMS
The tables below provide an analysis of the insurance contract liability and asset balances, including segregated fund balances, but excluding the assets for insurance acquisition cash flows.
[ ] Other cash flows includes transfer to/from segregated funds, premiums to be settled via funding component balance (FCB), claims to be settled via FCB, net settlement, and other cash flows from policy loans.
[ ] Other movements represents changes in the expected fulfillment cash flows on certain reinsurance contracts held where Lifeco has no continuing involvement other than exposure to the remote insolvency risk of the reinsurer. This movement is offset by movement in associated reinsurance assets.
[ ] Other cash flows includes transfer to/from segregated funds, premiums to be settled via FCB, claims to be settled via FCB, net settlement, and other cash flows from policy loans.
[ ] Other movements represents changes in the expected fulfillment cash flows on certain reinsurance contracts held where Lifeco has no continuing involvement other than exposure to the remote insolvency risk of the reinsurer. This movement is offset by movement in associated reinsurance assets.
[3] On April 1, 2022, Lifeco completed the acquisition of the full-service retirement services business of Prudential. The contributions of the acquired business to Lifeco’s overall results have been presented separately for the comparative period.
ANALYSIS BY MEASUREMENT COMPONENT FOR INSURANCE CONTRACTS NOT MEASURED UNDER PAA
The tables below provide an analysis of the insurance contract liability and asset balances, including segregated fund balances, but excluding the assets for insurance acquisition cash flows, for insurance contracts not measured under PAA.
[ ] Other cash flows includes transfer to/from segregated funds, premiums to be settled via FCB, claims to be settled via FCB, net settlements, and other cash flows from policy loans.
[ ] Other movements represents changes in the expected fulfillment cash flows on certain reinsurance contracts held where Lifeco has no continuing involvement other than exposure to the remote insolvency risk of the reinsurer. This movement is offset by movement in associated reinsurance assets.
[3] On April 1, 2022, Lifeco completed the acquisition of the full-service retirement services business of Prudential. The contributions of the acquired business to Lifeco’s overall results have been presented separately for the comparative period.
OF THE ASSET FOR INSURANCE ACQUISITION CASH FLOWS
The table below provides analysis on the asset for insurance acquisition cash flows.
Lifeco applied the following rates to discount cash flows by major currency:
The forward rates used in the tables above are calculated based on prevailing interest rates observed in their respective markets. When interest rates are not observable, the yield curve to discount cash flows transitions to an ultimate rate composed of a risk-free rate and illiquidity premium. These amounts are set based on historical data.
The earnings and CSM sensitivities illustrated in the table below represent impacts as at December 31, 2022 under the current accounting policies as at March 31, 2023, including accounting for insurance contracts under IFRS 17. Lifeco’s insurance risk sensitivities at March 31, 2023 have not changed significantly from the amounts disclosed in the table below.
% life mortality increase
% annuity mortality decrease
% morbidity adverse change ( ) ( )
% expense increase – ( )
% adverse change in policy termination and renewal ( , )
These sensitivities reflect the impact on earnings and CSM of an immediate change in assumptions on the value of insurance contract liabilities.
Most assumption changes directly impact CSM under IFRS 17, rather than earnings. For products measured under the general measurement model, there is a second-order impact, which captures the difference between the assumption change impact measured at prevailing discount rates and the impact under locked-in discount rates. Most locked-in rates for the calculation of CSM impacts were determined at January 1, 2022 for the in-force portfolio. Given the significant rise in interest rates in 2022, the prevailing discount rates now differ significantly from the locked-in discount rates. Therefore, under current market conditions, an assumption change which strengthens liabilities will be measured at lower interest rates in the CSM than prevailing rates, leading to a liability-strengthening offset by CSM reduction and an increase to earnings due to the interest rate effects.
The CSM outlined above is presented net of reinsurance held.
Included in the reinsurance contract held amounts are funds withheld by Lifeco under reinsurance contracts of $1,078 million ($1,03 million as at December 31, 2022).
ANALYSIS BY REMAINING COVERAGE AND INCURRED CLAIMS
The tables below provide an analysis of the reinsurance contract held liability and asset balances.
[ ] Other cash flows includes transfer to/from segregated funds, premiums to be settled via FCB, claims to be settled via FCB, net settlements, and other cash flows from policy loans.
[ ] Other movements represents changes in the expected fulfillment cash flows on certain reinsurance contracts held where Lifeco has no continuing involvement other than exposure to the remote insolvency risk of the reinsurer. This movement is offset by movement in associated reinsurance assets.
ANALYSIS BY MEASUREMENT COMPONENT FOR REINSURANCE CONTRACTS HELD NOT MEASURED UNDER PPA
The tables below provide an analysis of the reinsurance contract held liability and asset balances for reinsurance contracts held not measured under PAA.
the statement of earnings and of comprehensive income
that relate to current service
adjustment for non-financial risk for risk expired
relate to future service
period
estimates that adjust the CSM
estimates that result in losses and reversal of losses on onerous contracts
that relate to past service
(expenses) from reinsurance contracts, excluding the effect of changes in non-performance risk of reinsurers
[ ] Other cash flows includes transfer to/from segregated funds, premiums to be settled via FCB, claims to be settled via FCB, net settlements, and other cash flows from policy loans.
[ ] Other movements represents changes in the expected fulfillment cash flows on certain reinsurance contracts held where Lifeco has no continuing involvement other than exposure to the remote insolvency risk of the reinsurer. This movement is offset by movement in associated reinsurance assets.
Lifeco did not acquire any reinsurance contracts held through transfer or business combination.
EXPECTED REMAINING CSM RECOGNITION
DISCOUNT RATES
Lifeco applied the following rates to discount cash flows by major currency:
The forward rates used in the tables above are calculated based on prevailing interest rates observed in their respective markets. When interest rates are not observable, the yield curve to discount cash flows transitions to an ultimate rate composed of a risk-free rate and illiquidity premium. These amounts are set based on historical data.
POWER CORPORATION
Debentures – unsecured
% debentures due April , 9
% debentures due January , 9 9
% debentures due July , Total Power Corporation
The Corporation has a line of credit of $500 million bearing interest at Adjusted Term SOFR plus 0.70%. At March 31, 2023 and December 31, 2022, the Corporation was not using its line of credit.
A) POWER FINANCIAL, LIFECO AND IGM
The following table presents the debentures and other debt instruments issued by Power Financial, Lifeco and IGM. The 6. 0% debentures of Power Financial are direct obligations of Power Financial and are non-recourse to the Corporation. All debentures and other debt instruments of Lifeco and its subsidiaries are direct obligations of Lifeco or its subsidiaries, as applicable, and are non-recourse to the Corporation. All of the debentures of IGM are direct obligations of IGM and are nonrecourse to the Corporation.
POWER FINANCIAL
Debentures – unsecured
.9 % debentures due March ,
April , (€ million) [ ]
, (€ million) [ ]
,
Other Debt Instruments – unsecured
Commercial paper and other short-term debt instruments with interest rate of % ( % at December , )
Revolving credit facility with interest equal to LIBOR plus % (US$ million)
Non-revolving credit facility with interest based on Adjusted Term SOFR (US$ million)
.9 % senior notes due August , (US$ million)
% senior notes due September , (US$ million)
% senior notes due May , (US$ million)
% senior notes due March (US$ million)
, (US$ million)
[
] Designated by Lifeco as hedges of the net investment in foreign operations.
IGM FINANCIAL
Debentures – unsecured
% debentures due January ,
% debentures due December ,
% debentures due May 9,
% debentures due December ,
% debentures due March ,
% debentures due December ,
% debentures due January ,
% debentures due December 9,
% debentures due July ,
% debentures due March ,
Debentures of IGM held by Lifeco as investments ( ) ( )
Total IGM
Total Power Financial, Lifeco and IGM , ,
LIFECO
Subsequent
On April 18, 2023, Lifeco repaid the principal amount of its maturing 2.50% €500 million senior bonds, together with accrued interest.
The table below details changes in the debentures and other debt instruments arising from financing activities, including both cash and non-cash changes:
The following table presents the other debt instruments held by alternative asset investment platforms and other. All other debt instruments are credit or loan facilities that are direct obligations, and secured by the assets, of subsidiaries of the Corporation and are non-recourse to the Corporation.
March December
Investment Funds and Other – secured
Revolving credit facility up to $ 9 million, with interest equal to prime rate plus % 9
Revolving credit facility up to US$ million, with interest equal to the U.S. base rate minus % (US$ million)(US$ million at December , )
Revolving loan facility up to $ million, with interest equal to prime rate plus % or SOFR plus % ($ million and US$ 9 million)($ million and US$ million at December , )
Senior loan due in June 9, with interest equal to Euribor plus % (€ million) [ ]
Renewable Energy – Project debt – secured
Construction loan facilities due from January to December , bearing interest at various rates from % to %, LIBOR plus % and U.S. base rate plus % ($ million and US$ 9 million)($ million and US$ million at December , )
Loan facilities due from June to December , bearing interest at various rates from % to %
Loan facilities due from January to June 9, bearing interest at various rates from % to %, prime rate plus margin between % and %, CDOR plus % and LIBOR plus margin
% and % ($ million and US$ million)($ million and
The table below details changes in the other debt instruments arising from financing activities, including both cash and non-cash changes:
AUTHORIZED
The authorized capital of Power Corporation consists of an unlimited number of First Preferred Shares, issuable in series; an unlimited number of Participating Preferred Shares; and an unlimited number of Subordinate Voting Shares.
During the three months ended March 31, 2023, 113, 02 Subordinate Voting Shares were issued under the Corporation’s Executive Stock Option Plan for a consideration of $3 million (1,661,817 Subordinate Voting Shares issued for the three months ended March 31, 2022 for a consideration of $46 million).
During the three months ended March 31, 2023, dividends declared on the Corporation’s participating shares amounted to $0.5250 per share ($0.4 50 per share in 2022).
On February 28, 2022, the Corporation commenced a Normal Course Issuer Bid (NCIB) which was effective until February 27, 2023. During the three months ended March 31, 2023, no Subordinate Voting Shares were purchased for cancellation by the Corporation pursuant to this NCIB (4,474,700 Subordinate Voting Shares for a total of $175 million during the three months ended March 31, 2022 under the NCIB programs).
On March 1, 2023, the Corporation commenced a new NCIB which is effective until the earlier of February 2 , 2024 and the date on which the Corporation has purchased the maximum permitted number of Subordinate Voting Shares. Pursuant to this NCIB, the Corporation may purchase up to 30 million of its Subordinate Voting Shares outstanding (representing approximately 5.4% of the public float of Subordinate Voting Shares outstanding as at February 22, 2023) at market prices. During the three months ended March 31, 2023, the Corporation purchased for cancellation 1,15 ,700 Subordinate Voting Shares pursuant to this NCIB for a total of $42 million.
In the three months ended March 31, 2023, the Corporation’s share capital was reduced by the average carrying value of the shares repurchased for cancellation. The excess paid over the average carrying value of stated capital was $24 million and was recognized as a reduction to retained earnings ($108 million during the three months ended March 31, 2022).
In connection with its NCIB, the Corporation has entered into an automatic share purchase plan (ASPP) and may provide parameters thereunder from time to time to allow a designated broker to purchase Subordinate Voting Shares under the NCIB at times when the Corporation would ordinarily not be permitted to purchase shares due to regulatory restrictions or self-imposed blackout periods. Outside of these predetermined trading blackout periods, purchases under the Corporation’s NCIB will be completed at management’s discretion.
On March 31, 2023, there were 21,253,14 Subordinate Voting Shares and 10, 00,781 Subordinate Voting Shares reserved for issuance under Power Corporation’s Executive Stock Option Plan and under Power Financial’s Employee Stock Option Plan, assumed by Power Corporation (Stock Option Plans).
A summary of the status of the Corporation’s Stock Option Plans, including tandem share appreciation rights (TSARs), as at March 31, 2023 and 2022, and changes during the respective periods then ended, is as follows:
The exercise price of the 26,735,763 outstanding options ranges from $27.30 to $42.45.
A summary of the status of the Corporation’s options with TSARs attached, as at March 31, 2023 and 2022, and changes during the respective periods ended is as follows:
In 2022, the Corporation reclassified 13,621,606 options as cash-settled share-based payments and recognized a liability for the corresponding vested TSARs which is measured at fair value at each reporting period. The reclassification as cash-settled share-based payments resulted in a decrease to retained earnings and to the share-based compensation reserve of $54 million and $3 million, respectively.
The fair value of the outstanding cash-settled liability was $56 million at March 31, 2023 ($3 million at December 31, 2022) and is recorded in other liabilities. The intrinsic value of this liability at March 31, 2023 was $44 million ($17 million at December 31, 2022).
The fair value of the TSARs was estimated using the Black-Scholes option-pricing model with the following weightedaverage assumptions:
, March ,
Expected life (years)
Share price ($/share)
Weighted-average exercise price ($/option)
Weighted-average fair value ($/option)
The Corporation entered into a total return swap agreement to manage exposure to the volatility of a portion of its cashsettled share-based payments and related liability. For the three months ended March 31, 2023, a net loss of $4 million (nil in 2022) arising from the change in fair value of the liability, net of the gain on the remeasurement to fair value of the derivative instrument, was included in operating and administrative expenses in the statements of earnings.
During the three months ended March 31, 2023, Power Corporation granted 1,284,026 options (670,304 options were granted for the three months ended March 31, 2022) under its Executive Stock Option Plan. Options granted in the three months ended March 31, 2023 vest on the basis of [i] 50% three years from the date of grant and [ii] 50% four years from the date of grant.
The fair value of these options was estimated using the Black-Scholes option-pricing model with the following weightedaverage assumptions:
The expected volatility has been estimated based on the historical volatility of the Corporation’s share price using the expected option life.
Lifeco, IGM and Wealthsimple have also established stock option plans pursuant to which options may be granted to certain officers and employees. In addition, other subsidiaries of the Corporation have established share-based compensation plans. Compensation expense related to equity-settled stock option plans is recorded based on the fair value of the options or the fair value of the equity instruments at the grant date, amortized over the vesting period. For the three months ended March 31, 2023, total compensation expense relating to the equity-settled stock options granted by the Corporation and its subsidiaries amounted to $30 million ($33 million in 2022), and was recorded in operating and administrative expenses in the statements of earnings.
As a holding company, Power Corporation’s objectives in managing its capital are to: provide attractive long-term returns to shareholders of the Corporation; provide sufficient financial flexibility to pursue its growth strategy to invest on a timely basis in its operating companies and other investments as opportunities arise; maintain a capital structure that matches the long-term nature of its investments by maximizing the use of permanent capital; maintain an appropriate credit rating to ensure stable access to the capital markets; and maintain available cash and cash equivalents at a minimum of two times fixed charges.
The Corporation manages its capital taking into consideration the risk characteristics and liquidity of its holdings. In order to maintain or adjust its capital structure, the Corporation may adjust the amount of dividends paid to shareholders, return capital to shareholders or issue capital.
The capital structure of the Corporation consists of debentures, non-participating shares, participating shareholders’ equity and non-controlling interests. The Corporation views non-participating shares as a cost-effective source of permanent capital. The Corporation is a long-term investor and as such holds positions in long-term investments as well as cash and fixed income securities for liquidity purposes.
The Board of Directors of the Corporation is responsible for capital management. Management of the Corporation is responsible for establishing capital management procedures and for implementing and monitoring its capital plans. The Board of Directors of the Corporation reviews and approves capital transactions such as the issuance, redemption and repurchase of participating shares, non-participating shares and debentures. The boards of directors of the Corporation’s subsidiaries, as well as those of Parjointco and GBL, oversee and have the responsibility for their respective company’s capital management.
The Corporation itself is not subject to externally imposed regulatory capital requirements. However, Lifeco and certain of its main subsidiaries, IGM’s subsidiaries and certain of the Corporation’s other subsidiaries are subject to regulatory capital requirements and they manage their capital as described below.
Lifeco manages its capital on both a consolidated basis and at the individual operating subsidiary level. The primary objectives of Lifeco’s capital management strategy are: to maintain the capitalization of its regulated operating subsidiaries at a level that will exceed the relevant minimum regulatory capital requirements in the jurisdictions in which they operate; to maintain strong credit and financial strength ratings of Lifeco ensuring stable access to capital markets; and to provide an efficient capital structure to maximize shareholder value in the context of Lifeco’s operational risks and strategic plans.
Management of Lifeco is responsible for establishing capital management procedures for implementing and monitoring the capital plan.
The target level of capitalization for Lifeco and its subsidiaries is assessed by considering various factors such as the probability of falling below the minimum regulatory capital requirements in the relevant operating jurisdiction, the views expressed by various credit rating agencies that provide financial strength and other ratings to Lifeco, and the desire to hold sufficient capital to be able to honour all policyholder and other obligations of Lifeco with a high degree of confidence.
In Canada, OSFI has established a regulatory capital adequacy measurement for life insurance companies incorporated under the Insurance Companies Act (Canada) and their subsidiaries known as the Life Insurance Adequacy Test (LICAT). The LICAT ratio compares the regulatory capital resources of a company to its required capital, defined by OSFI, as the aggregate of all defined capital requirements. The total capital resources are provided by the sum of available capital, surplus allowance and eligible deposits. OSFI has established a supervisory target total ratio of 100%, and a supervisory minimum total ratio of 0%. Canada Life’s consolidated LICAT ratio at March 31, 2023 was 127%.
Other foreign operations and foreign subsidiaries of Lifeco are required to comply with local capital or solvency requirements in their respective jurisdictions.
IGM’s capital management objective is to maximize shareholder returns while ensuring that IGM is capitalized in a manner which appropriately supports regulatory capital requirements, working capital needs and business expansion. IGM’s capital management practices are focused on preserving the quality of its financial position by maintaining a solid capital base and a strong balance sheet. IGM regularly assesses its capital management practices in response to changing economic conditions.
IGM’s capital is primarily used in its ongoing business operations to support working capital requirements, long-term investments made by IGM, business expansion and other strategic objectives.
The IGM subsidiaries that are subject to regulatory capital requirements include investment dealers, mutual fund dealers, exempt market dealers, portfolio managers, investment fund managers and a trust company. These IGM subsidiaries are required to maintain minimum levels of capital based on either working capital, liquidity or shareholders’ equity. At March 31, 2023, IGM subsidiaries have complied with all regulatory capital requirements.
Certain subsidiaries are subject to regulatory capital requirements, including portfolio managers, asset managers and an order-execution-only broker. These subsidiaries are required to maintain levels of capital based on their working capital, liquidity or shareholders’ equity. At March 31, 2023, these subsidiaries have complied with all regulatory capital requirements
The Corporation and its subsidiaries have established policies, guidelines and procedures designed to identify, measure, monitor, report and mitigate risks associated with financial instruments. The key risks related to financial instruments are liquidity risk, credit risk and market risk.
Liquidity risk is the risk that the Corporation and its subsidiaries would not be able to meet all cash outflow obligations as they come due or be able to, in a timely manner, raise capital or monetize assets at normal market conditions.
Credit risk is the potential for financial loss to the Corporation and its subsidiaries if a counterparty in a transaction fails to meet its payment obligations. Credit risk can be related to the default of a single debt issuer, the variation of credit spreads on tradable fixed income securities and also to counterparty risk relating to derivative products.
Market risk is the risk that the market value or future cash flows of a financial instrument and the value of insurance and investment contract liabilities will fluctuate as a result of changes in market factors. Market factors include three types of risks: foreign exchange risk, interest rate (including inflation) risk and equity risk.
Foreign exchange risk relates to the Corporation, its subsidiaries and its jointly controlled corporations and associates operating in different currencies and converting non-Canadian investments and earnings at different points in time at different foreign exchange levels when adverse changes in foreign currency exchange rates occur.
Interest rate risk is the risk that the fair value of a financial instrument will fluctuate following changes in the interest rates.
Equity risk is the potential loss associated with the sensitivity of the market price of a financial instrument arising from volatility in equity markets.
Estimates of sensitivities and risk exposure measures are included for certain risks, such as the sensitivity due to specific changes in interest rate levels projected and market prices as at the valuation date. Actual results can differ significantly from these estimates for a variety of reasons, including, but not limited to, changes in the Corporation and its subsidiaries’ asset or liability profile, changes in business mix, effective income tax rates, other market factors, difference in the actual exposure relative to board market indices, variation in exposures by geography, and general limitations of internal models.
For these reasons, the sensitivities should only be viewed as directional estimates of the underlying sensitivities for the respective factors. Given the nature of these calculations, the Corporation cannot provide assurance that the actual impact on net earnings will be as indicated.
The following is a summary of risks in respect to the Corporation and its subsidiaries’ financial instruments. In the first section below, the risk management policies and procedures of Power Corporation, Power Financial and the Corporation’s alternative asset investment platforms and other (other subsidiaries) are discussed. Risks related to Lifeco and IGM are discussed in subsequent sections. For a more detailed discussion, refer to Note 22 to the Corporation’s Consolidated Financial Statements for the year ended December 31, 2022.
a) Liquidity and funding
As a holding company, the Corporation’s ability to pay dividends is dependent upon the Corporation receiving dividends from its principal operating subsidiaries and other investments. Lifeco and its subsidiaries are subject to restrictions set out in relevant corporate and insurance laws and regulations, which require that solvency and capital ratios be maintained. IGM’s subsidiaries are also subject to minimum capital requirements. Regulatory requirements may change from time to time, and thereby impact the ability of the operating subsidiaries to pay dividends. The declaration and payment of dividends by the Corporation in future periods remains at the discretion of its Board of Directors and is dependent on the operating performance, profitability, financial position and creditworthiness of its operating subsidiaries and other investments, as well as on their ability to pay dividends.
Power Corporation and Power Financial believe their ongoing cash flows from operations, available cash balances and liquidity available through their lines of credit are sufficient to address their liquidity needs.
b) Equity risk
As at March 31, 2023, the impact of a 10% decrease in the value of other investments held by Power Corporation, Power Financial and other subsidiaries would have resulted in an approximate $62 million unrealized loss recorded in other comprehensive income related to investments classified as fair value through other comprehensive income and $1 3 million of loss recorded in net earnings related to investments classified as fair value through profit or loss and investments in jointly controlled corporations and associates measured at fair value through profit or loss.
GBL holds a portfolio of investments which are classified as fair value through other comprehensive income or fair value through profit or loss. As at March 31, 2023, the impact of a 10% decrease in equity markets would have resulted in an approximate $232 million unrealized loss recorded in other comprehensive income related to investments classified as fair value through other comprehensive income and $67 million of loss recorded in net earnings related to investments classified as fair value through profit or loss, representing the Corporation’s share of Parjointco’s unrealized losses.
Power Corporation, Power Financial and other subsidiaries’ exposure and management of liquidity risk, credit risk and market risk have not changed materially since December 31, 2022.
The risk committee of the board of directors of Lifeco is responsible for the oversight of Lifeco’s key risks. Lifeco has established policies and procedures designed to identify, measure, manage, monitor and report material risks associated with financial instruments. Lifeco’s approach to risk management has not changed significantly since December 31, 2022. A summary of the risks is presented below. For a more detailed discussion of Lifeco’s risk governance structure and risk management approach, refer to the Risk Management note in the Corporation’s December 31, 2022 financial statements.
Lifeco has the following policies and procedures in place to manage liquidity risk: Lifeco closely manages operating liquidity through cash flow matching of assets and liabilities and forecasting earned and required yields, to ensure consistency between policyholder requirements and the yield of assets. Management of Lifeco closely monitors the solvency and capital positions of its principal subsidiaries opposite liquidity requirements at the holding company. Additional liquidity is available through established lines of credit or via capital market transactions. Lifeco maintains committed lines of credit with Canadian chartered banks.
Concentrations of credit risk arise from exposures to a single debtor, a group of related debtors or groups of debtors that have similar credit risk characteristics in that they operate in the same geographic region or in similar industries. The characteristics are similar in that changes in economic or political environments may impact their ability to meet obligations as they come due. No significant changes have occurred from the year ended December 31, 2022.
a) Foreign exchange risk
If the assets backing insurance and investment contract liabilities are not matched by currency, changes in foreign exchange rates can expose Lifeco to the risk of foreign exchange losses not offset by liability decreases.
A 10% weakening of the Canadian dollar against foreign currencies would be expected to increase non-participating insurance and investment contract liabilities and their supporting assets by approximately the same amount, resulting in an immaterial immediate change to net earnings.
A 10% strengthening of the Canadian dollar against foreign currencies would be expected to decrease non-participating insurance and investment contract liabilities and their supporting assets by approximately the same amount, resulting in an immaterial immediate change to net earnings.
Lifeco has net investments in foreign operations. Lifeco’s debt obligations are denominated in Canadian dollars, euros and U.S. dollars. In accordance with IFRS, foreign currency translation gains and losses from net investments in foreign operations, net of related hedging activities and tax effects, are recorded in other comprehensive income. Strengthening or weakening of the Canadian dollar spot rate compared to the U.S. dollar, British pound and euro spot rates impacts Lifeco’s total equity. Correspondingly, Lifeco’s book value per share and capital ratios monitored by rating agencies are also impacted.
Interest rate risk exists if asset and liability cash flows are not closely matched and interest rates change causing a difference in the value of assets and the value of liabilities. Lifeco has the following policies and procedures in place to mitigate its exposure to interest rate risk:
Interest rate risk is managed by investing in assets that are suitable for the products sold.
Lifeco uses a formal process for managing the matching of assets and liabilities. This involves grouping general fund assets and liabilities into segments. Assets in each segment are managed in relation to the liabilities in the segment. For products with fixed and highly predictable benefit payments, investments are generally made in fixed income assets or investment properties whose cash flows closely match the liability product cash flows. Where assets are not available to match certain period cash flows, such as long-tail cash flows, a portion of the assets are invested in equities and other non-fixed income assets, while the rest are duration matched. Hedging instruments are employed when there is a lack of suitable permanent investments or to manage the level of loss exposure to interest rate changes.
To the extent asset and liability cash flows are matched, protection against interest rate change is achieved and any change in the fair value of the assets will be offset by a similar change in the fair value of the liabilities. For products with less predictable timing of benefit payments, investments are made in fixed income assets with cash flows of a shorter duration than the anticipated timing of benefit payments, or in equities and non-fixed income assets. The risk associated with the mismatch in portfolio duration and cash flow, asset prepayment exposure and the pace of asset acquisition is quantified and reviewed regularly.
The impact to net earnings from changes in the interest rates would be largely offset by changes in the value of financial assets supporting the liabilities. However, differences in the interest rate sensitivity in the value of assets and the value of insurance and investment contract liabilities leads to a sensitivity to interest rate movements in net earnings under IFRS 17 and IFRS
Lifeco’s asset liability management strategy uses equities and other non-fixed income assets as a component of general fund assets supporting liabilities, which leads to interest rate exposure in the net earnings. Furthermore, the classification of financial assets under IFRS , such as mortgage assets which are valued at amortized cost and held in the general fund assets supporting liabilities, also contributes to interest rate exposure in net earnings.
The immediate impact to net earnings from an immediate parallel 50 basis point increase or decrease in interest rates is illustrated in the table below:
Interest rate sensitivities vary by geography. Net earnings are positively impacted by rising rates in Canada and the UK, and are positively impacted by falling rates in the eurozone.
The potential impact on the net earnings does not take into account any future potential changes to Lifeco’s ultimate investment rate (UIR) assumptions. As at December 31, 2022, the sensitivity of net earnings of the Company to a 10 basis point increase or decrease in the UIR in all geographies would be an increase of $25 million or a decrease of $25 million post-tax, respectively.
Lifeco has investment policy guidelines in place that provide for prudent investment in equity markets with clearly defined limits to mitigate this risk.
The risks associated with segregated fund guarantees on lifetime Guaranteed Minimum Withdrawal Benefits have been mitigated through a hedging program using equity futures, currency forwards, and interest rate derivatives.
Some insurance and investment contract liabilities with long-tail cash flows are supported by publicly traded common shares and investments in other non-fixed income assets, primarily comprised of investment properties, real estate funds, private equities, and equity-release mortgages. Net earnings will reflect changes in the values of non-fixed income assets.
The liabilities for segregated fund products with guarantees will fluctuate with changes in the value of the non-fixed income assets. Under current market conditions, there are no earnings impacts to Lifeco on segregated fund business that it does not hedge, as changes in the cost of guarantees are able to be fully offset within the CSM. For segregated fund business that Lifeco hedges, there is a limited earnings impact with respect to the change in liability versus the change in hedge assets.
The following table provides information on the expected immediate impacts of an immediate 10% or 20% increase or decrease in the value of publicly traded common shares on the net earnings.
The following table provides information on the expected impacts of an immediate 5% or 10% increase or decrease in the value of other non-fixed income assets on the shareholders’ net earnings.
The risk committee of the board of IGM is responsible for assisting the board of directors of IGM in reviewing and overseeing the risk governance structure and risk management program of IGM.
The risk management policies and procedures of IGM are discussed in the IGM section of the Corporation’s Management’s Discussion and Analysis (Part C) for the three months ended March 31, 2023 and in Note 22 to the Corporation’s Consolidated Financial Statements for the year ended December 31, 2022 and have not changed significantly since December 31, 2022.
IGM’s liquidity management practices include:
Maintaining liquid assets and lines of credit to satisfy near-term liquidity needs. Ensuring effective controls over liquidity management processes. Performing regular cash forecasts and stress testing.
Regular assessment of capital market conditions and IGM’s ability to access bank and capital market funding. Ongoing efforts to diversify and expand long-term mortgage funding sources.
Oversight of liquidity by management and by the financial risk management committee, a committee of finance and other IGM business leaders.
A key liquidity requirement for IGM is the funding of advisor network compensation paid for the distribution of financial products and services. This compensation continues to be paid from operating cash flows. IGM also maintains sufficient liquidity to fund and temporarily hold mortgages pending sale or securitization to long-term funding sources and to manage any derivative collateral requirements.
IGM believes its ongoing cash flows from operations, available cash balances and liquidity available through its lines of credit are sufficient to address its liquidity needs.
IGM manages credit risk related to cash and cash equivalents by adhering to its investment policy that outlines credit risk parameters and concentration limits. IGM regularly reviews the credit ratings of its counterparties. The maximum exposure to credit risk on these financial instruments is their carrying value.
IGM’s allowance for credit losses was $1 million at March 31, 2023, unchanged from December 31, 2022, and is considered adequate by IGM’s management to absorb all credit-related losses in the mortgage portfolios based on: i) historical credit performance experience; ii) recent trends including increasing interest rates; iii) current portfolio credit metrics and other relevant characteristics; iv) its strong financial planning relationship with its clients; and v) stress testing of losses under adverse real estate market conditions.
IGM’s exposure to and management of credit risk related to cash and cash equivalents, fixed income securities and mortgage portfolios have not changed materially since December 31, 2022.
The pension plan and other post-employment benefits expense included in net earnings and other comprehensive income is as follows:
The discount rates decreased by 0.2% to 0.3% during the three months ended March 31, 2023, primarily due to the decrease in yields on high-quality corporate bonds (increased by 0. % to 1.1% in the corresponding period in 2022, primarily due to the increase in yields on high-quality corporate bonds).
The components of income tax expense (recovery) recognized in net earnings are:
The effective income tax rate for the Corporation for the three months ended March 31, 2023 was 16.6%, compared to 15.1% for the year ended December 31, 2022 and 15.8% for the three months ended March 31, 2022.
The effective income tax rate for the three months ended March 31, 2023 is higher than the effective income tax rate for the same period last year mainly due to the tax expense resulting from the ChinaAMC transaction between the Corporation and IGM, partially offset by the jurisdictional mix of earnings and higher non-taxable investment income at Lifeco.
The effective income tax rates for the comparative figures and for the year ended December 31, 2022 have been restated to reflect the adoption of IFRS 17 and IFRS . As IFRS 17 and IFRS impacted the composition of earnings in all jurisdictions at Lifeco, the changes in effective income tax rates were due to the jurisdictional mix of earnings.
The effective income tax rates are generally lower than the Corporation’s statutory income tax rate of 26.5% due to nontaxable investment income, lower tax in certain foreign jurisdictions and results from jointly controlled corporations and associates that are not taxable.
The following is a reconciliation of the numerators and the denominators used in the computations of earnings per share:
Three months ended March ,
Earnings
Net earnings attributable to shareholders
Dividends on non-participating shares ( ) ( )
Net earnings attributable to participating shareholders
Dilutive effect of subsidiaries’ outstanding stock options –
Effect of equity-settled method for TSARs – –
Net earnings adjusted for dilutive effect
Number of participating shares [millions]
Weighted average number of participating shares outstanding – Basic
Potential exercise of outstanding stock options
Weighted average number of participating shares outstanding – Diluted .9
Net earnings per participating share
Basic
Diluted
For the three months ended March 31, 2023, 2.2 million stock options (0.6 million in 2022) were excluded from the computation of diluted earnings per share as they were anti-dilutive.
The Corporation’s assets and liabilities recorded at fair value have been categorized based upon the following fair value hierarchy:
Level Definition Financial assets and liabilities
Level 1 Utilize observable, unadjusted quoted prices in active markets for identical assets or liabilities that the Corporation has the ability to access.
actively exchange-traded equity securities; exchange-traded futures; mutual and segregated funds which have available prices in an active market with no redemption restrictions; open-end investment fund units and other liabilities in instances where there are quoted prices available from active markets.
Level 2 Utilize other-than-quoted prices included in Level 1 that are observable for the asset or liability, either directly or indirectly. Level 2 inputs include quoted prices for similar assets and liabilities in active markets, and inputs other-than-quoted prices that are observable for the asset or liability, such as interest rates and yield curves that are observable at commonly quoted intervals.
The fair values for some Level 2 securities were obtained from a pricing service. The pricing service inputs include, but are not limited to, benchmark yields, reported trades, broker/dealer quotes, issuer spreads, two-sided markets, benchmark securities, offers and reference data.
Level 3 Utilize one or more significant inputs that are not based on observable market inputs and include situations where there is little, if any, market activity for the asset or liability.
The values of the majority of Level 3 securities were obtained from single-broker quotes, internal pricing models, external appraisers or by discounting projected cash flows.
assets and liabilities priced using a matrix which is based on credit quality and average life; government and agency securities; restricted shares; certain private bonds and investment funds; most investment-grade and high-yield corporate bonds; most asset-backed securities; most over-the-counter derivatives; most mortgage and other loans; deposits and certificates; most debentures and other debt instruments; most of the investment contracts that are measured at fair value through profit or loss; certain limited-life and redeemable fund units.
certain bonds; certain asset-backed securities; certain private equities; certain mortgage and other loans, including equity-release mortgages; investments in mutual and segregated funds where there are redemption restrictions; certain over-the-counter derivatives; investment properties; obligations to securitization entities; certain other debt instruments; certain limited-life and redeemable fund units.
The Corporation’s assets and liabilities recorded at fair value, including their levels in the fair value hierarchy using the valuation methods and assumptions described in the summary of significant accounting policies of the Corporation’s December 31, 2022 Consolidated Financial Statements and above, are presented below. Fair values represent management’s estimates and are generally calculated using market information at a specific point in time and may not reflect future fair values. The calculations are subjective in nature, and involve uncertainties and matters of significant judgment (Note 2).
[ ] The Corporation has elected to apply the overlay approach on an instrument-by-instrument basis and therefore includes the application of the IFRS 9 overlay for certain instruments.
There were no significant transfers between Level 1 and Level 2 in these periods.
Additional information about assets and liabilities measured at fair value on a recurring basis for which the Corporation and its subsidiaries have utilized Level 3 inputs to determine fair value for the three months ended March 31, 2023 and 2022 is presented below.
[ ] Amount of other comprehensive income for fair value through profit or loss bonds, mortgage and other loans, shares, investment properties and other assets and liabilities represents the unrealized gains (losses) on foreign exchange.
[ ] Includes investments in mutual and segregated funds where there are redemption restrictions. The fair value is based on observable, quoted prices.
[3] Balance at the beginning of year represents available-for-sale shares reclassified as fair value through profit or loss on transition.
[ ] Amount of other comprehensive income for fair value through profit or loss bonds, mortgage and other loans, shares, investment properties and other assets and liabilities represents the unrealized gains (losses) on foreign exchange.
[ ] Includes investments in mutual and segregated funds where there are redemption restrictions. The fair value is based on observable, quoted prices.
Transfers into Level 3 are due primarily to decreased observability of inputs in valuation methodologies or the placement of redemption restrictions on investments in mutual and segregated funds. Transfers out of Level 3 are due primarily to increased observability of inputs in valuation methodologies as evidenced by corroboration of market prices with multiple pricing vendors or the lifting of redemption restrictions on investments in mutual and segregated funds.
Significant unobservable inputs used at period-end in measuring assets categorized as Level 3 in the fair value hierarchy are presented below.
Interrelationship between key unobservable inputs and fair value measurement
Investment properties Investment property valuations are generally determined using property valuation models based on expected capitalization rates and models that discount expected future net cash flows. The determination of the fair value of investment property requires the use of estimates such as future cash flows (such as future leasing assumptions, rental rates, capital and operating expenditures) and discount, reversionary and overall capitalization rates applicable to the asset based on current market rates.
Discount rate Range of 4.0% – 16.1%
A decrease in the discount rate would result in an increase in fair value.
An increase in the discount rate would result in a decrease in fair value.
Reversionary rate Range of 4.0% – 7.8%
A decrease in the reversionary rate would result in an increase in fair value.
An increase in the reversionary rate would result in a decrease in fair value.
Mortgage and other loans – equityrelease mortgages (fair value through profit or loss)
The valuation approach for equity-release mortgages is to use an internal valuation model to determine the projected asset cash flows, including the stochastically calculated cost of the no-negative-equity guarantee for each individual loan, to aggregate these across all loans and to discount those cash flows back to the valuation date. The projection is done monthly until expected redemption of the loan either voluntarily or on the death/entering into long-term care of the loanholders.
Vacancy rate Weighted average of 2.8%
A decrease in the expected vacancy rate would generally result in an increase in fair value. An increase in the expected vacancy rate would generally result in a decrease in fair value.
Discount rate Range of 4.3% – 7.0%
A decrease in the discount rate would result in an increase in fair value. An increase in the discount rate would result in a decrease in fair value.
Shares
The determination of the fair value of shares requires the use of estimates such as future cash flows, discount rates, projected earnings multiples, or recent transactions.
Discount rate Various
A decrease in the discount rate would result in an increase in fair value. An increase in the discount rate would result in a decrease in fair value.
Limited-life and redeemable fund units
The determination of the fair value of the limited-life and redeemable fund units is based on the fair value of the underlying fund’s investments
Discount rate Various
A decrease in the discount rate would result in an increase in fair value. An increase in the discount rate would result in a decrease in fair value.
The Corporation is an international management and holding company. Its core holdings are leading insurance, retirement, wealth management and investment businesses, including a portfolio of alternative asset investment platforms.
As a holding company, the Corporation evaluates the performance of each operating segment based on its contribution to the earnings attributable to participating shareholders. The contribution to the earnings attributable to participating shareholders from Lifeco, IGM Financial, GBL, Sagard, Power Sustainable and other, represents the Corporation’s share of their net earnings.
The Corporation’s reportable segments include Lifeco and IGM Financial due to their quantitative contribution, and the Corporation also considers GBL as a reportable segment. Together, they represent the Corporation’s investments in publicly traded operating companies. As well, the Corporation considers the Holding company to be a reportable segment.
Lifeco is a financial services holding company with interests in life insurance, health insurance, retirement savings, wealth and asset management, and reinsurance businesses, primarily in Canada, the U.S. and Europe.
IGM F Financial is a leading wealth and asset management company supporting advisors and the clients they serve in Canada, and institutional investors through North America, Europe and Asia.
GBL is indirectly held through Parjointco. GBL is a Belgian investment holding company and leading investor in Europe focused on long-term value creation. Its portfolio is comprised of a portfolio of listed and private assets composed of global companies, which are leaders in their sectors.
Holding company comprises the corporate activities of the Corporation and Power Financial, on a combined basis, and presents the investment activities of the Corporation including its investments in consolidated entities. The Holding company activities present the Holding company’s assets and liabilities, including cash, investments, debentures and non-participating shares. The Holding company cash flows are primarily comprised of dividends received, income from investments and income (loss) from cash and cash equivalents, less operating expenses, financing charges, income taxes and non-participating and participating share dividends.
The Corporation’s asset management activities through the investment platforms, Sagard and Power Sustainable, together with their investing activities, are presented on a combined basis in another category, Alternative asset investment platforms and other, as they do not qualify as reportable segments.
Alternative asset investment platforms and other are comprised of the results of: Alternative asset management businesses, Sagard and Power Sustainable; Investments managed by Sagard and Power Sustainable on behalf of the Corporation; Entities held through the alternative asset managers which are consolidated; and Standalone businesses representing a subsidiary, a jointly controlled corporation and associates which are managed to realize value over time.
Effect of consolidation represents the reconciliation between the measurement basis used for the presentation of the Holding company with the consolidated financial statements, as well as the intersegment elimination for investments under common control and other consolidation entries.
The segmented assets present the activities of the holding company, including its investments in consolidated entities, Lifeco and IGM, as well as other controlled entities, using the equity method of accounting as a measurement basis. These entities are consolidated in the Corporation’s consolidated balance sheets. Common equity interests in Lifeco, IGM, and alternative asset investment platforms and other (intersegment investments) are included in their respective segment’s assets.
[ ] Included within insurance service result in the statements of earnings.
[ ] Included within net investment result in the statements of earnings.
[ ] Included within fee income and other revenues in the statements of earnings.
[ ] Dealer compensation expenses at IGM are included in operating and administrative expenses.
[ ] Includes net finance income (expenses) from insurance contracts, net finance income (expenses) from reinsurance contracts and changes in investment contract liabilities.
[ ] The contribution from Lifeco, IGM, GBL and alternative asset investment platforms and other to net earnings attributable to participating shareholders of the Corporation includes the effect of consolidation.
[ ] The contribution from Lifeco and IGM includes an allocation for the results of investments under common control based on their respective interests.
PAGE B 2
PAGE B 70
Please note that the bottom of each page in Part B contains two different page numbers. A page number with the prefix “B” refers to the number of such page in this document and the page number without any prefix refers to the number of such page in the original document issued by Great-West Lifeco Inc.
The attached documents concerning Great-West Lifeco Inc. are documents prepared and publicly disclosed by such subsidiary, and are available under such subsidiary’s profile on SEDAR at www.sedar.com. Certain statements in the attached documents, other than statements of historical fact, are forward-looking statements based on certain assumptions and reflect the current expectations of the subsidiary as set forth therein. Forward-looking statements are provided for the purposes of assisting the reader in understanding the subsidiary’s financial performance, financial position and cash flows as at and for the periods ended on certain dates and to present information about the subsidiary’s management’s current expectations and plans relating to the future and the reader is cautioned that such statements may not be appropriate for other purposes.
By its nature, forward-looking information is subject to inherent risks and uncertainties that may be general or specific and which give rise to the possibility that expectations, forecasts, predictions, projections or conclusions will not prove to be accurate, that assumptions may not be correct and that objectives, strategic goals and priorities will not be achieved.
For further information provided by the subsidiary as to the material factors that could cause actual results to differ materially from the content of forward-looking statements, the material factors and assumptions that were applied in making the forward-looking statements, and the subsidiary’s policy for updating the content of forward-looking statements, please see the attached documents, including the section entitled Cautionary Note Regarding Forward-Looking Information. The reader is cautioned to consider these factors and assumptions carefully and not to put undue reliance on forward-looking statements.
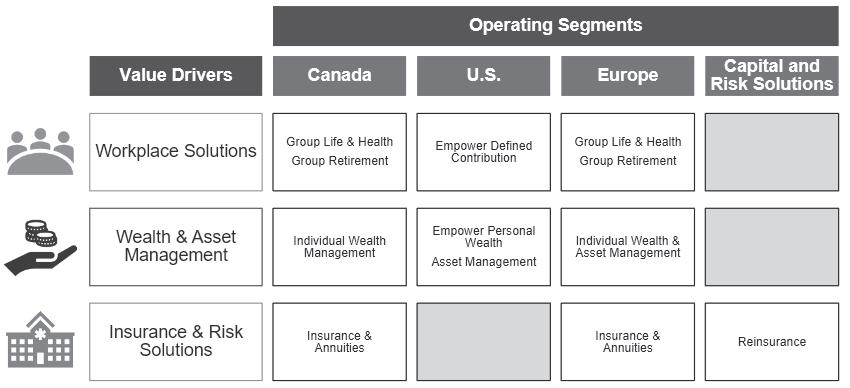
C
PAGE C 2
PAGE C 57
Please note that the bottom of each page in Part C contains two different page numbers. A page number with the prefix “C” refers to the number of such page in this document and the page number without any prefix refers to the number of such page in the original document issued by IGM Financial Inc.
The attached documents concerning IGM Financial Inc. are documents prepared and publicly disclosed by such subsidiary, and are available under such subsidiary’s profile on SEDAR at www.sedar.com. Certain statements in the attached documents, other than statements of historical fact, are forward-looking statements based on certain assumptions and reflect the current expectations of the subsidiary as set forth therein. Forward-looking statements are provided for the purposes of assisting the reader in understanding the subsidiary’s financial performance, financial position and cash flows as at and for the periods ended on certain dates and to present information about the subsidiary’s management’s current expectations and plans relating to the future and the reader is cautioned that such statements may not be appropriate for other purposes.
By its nature, forward-looking information is subject to inherent risks and uncertainties that may be general or specific and which give rise to the possibility that expectations, forecasts, predictions, projections or conclusions will not prove to be accurate, that assumptions may not be correct and that objectives, strategic goals and priorities will not be achieved.
For further information provided by the subsidiary as to the material factors that could cause actual results to differ materially from the content of forward-looking statements, the material factors and assumptions that were applied in making the forward-looking statements, and the subsidiary’s policy for updating the content of forward-looking statements, please see the attached documents, including the section entitled Forward-Looking Statements. The reader is cautioned to consider these factors and assumptions carefully and not to put undue reliance on forward-looking statements.
Certain statements in this report, other than statements of historical fact, position and results of operations as at and for the periods ended on certain dates and to present information about management’s current expectations and plans relating to the future. Readers are cautioned that such statements financial condition, expected financial results, performance, prospects,
or anticipated events or results. These factors include, but are not limited to: the impact or unanticipated impact of general economic, political and
in nature, depend upon or refer to future events or conditions, or include
future accounting changes, operational and reputational risks, business competition, technological change, changes in government regulations proceedings, catastrophic events, outbreaks of disease or pandemics
foregoing factors.
The reader is cautioned that the foregoing list is not exhaustive of the The reader is also cautioned to consider these and other factors,
This information is based upon certain material factors or assumptions that historical trends, current conditions and expected future developments, its subsidiaries’ control, affect the operations, performance and results of
This report contains Non-IFRS financial measures and non-IFRS ratios that and ratios are used to provide management, investors and investment make the period-over-period comparison of results from operations less
Refer to the appropriate reconciliations of non-IFRS financial measures, including as components of non-IFRS ratios, to reported results in
• Assets Under Management and Advisement (AUM&A) represents the management segment is providing investment management services or eliminated in our reporting such that there is no double-counting of the
• Assets Under Advisement (AUA)
RatioNumeratorDenominator available to common shareholders outstanding common available to common shareholders non-controlling interest excluding the impact of fair value through other comprehensive income investments
available to common shareholders non-controlling interest and the impact of fair value through other comprehensive income investments net of tax
• Assets Under Management (AUM) provide investment management services, and include investment portfolio management responsibilities.
• Working Capital excluding assets and liabilities not reflective of ongoing operations.
serve in Canada, and institutional investors throughout North number of operating subsidiaries and also holds a number of strategic investments that provide benefits to these subsidiaries
(a non-IFRS ratio – see Non-IFRS Financial Measures and Other other comprehensive income investments (a non-IFRS ratio – see dividend per common share declared in the first quarter of 2023
•
Highlights of the Rockefeller transaction include:
•
Net earnings available to common shareholders for the three comparative period in 2022, an increase of 75.8% in earnings
• that it has entered into an agreement to sell 100% of Investment
of the common shares of Investment Planning Counsel Inc.
have been classified as assets and liabilities held for sale. Net earnings from discontinued operations for all periods and 3 –
• position in one of the leading asset managers in China.
• Reinforcing relationships and business opportunities clients and strengthens distribution opportunities in China.
• at Mackenzie.
• Our clients experienced average investment returns of 4.4% in the first quarter of 2023. In 2022, client investment returns
institutions, pensions and other institutional investors.
• Strategic Investments and Other Investments are classified in this segment (as opposed to the or other unique characteristics.
Assets Under Management and Advisement (AUM&A) is providing investment management services or distributing eliminated in our reporting such that there is no doubleoperating companies.
Assets Under Advisement (AUA)
Management segment operating companies.
Assets Under Management (AUM) segment in relation to its investment management activities.
• Wealth Management – reflects the activities of operating planning and related services to Canadian households. This classified as discontinued operations. These firms are retail distribution organizations that serve Canadian households through their securities dealers, mutual fund dealers and other subsidiaries licensed to distribute financial products are derived from providing financial advice and distributing financial products and services to Canadian households. This segment also includes the investment management activities of these organizations, including mutual fund management
• Asset Management – reflects the activities of operating management services, and represents the operations of Mackenzie Investments. Investment management services are provided to a suite of investment funds that are
The financial presentation includes revenues and expenses to
• Wealth management revenue –related administration fees, distribution revenue associated revenue relating to mortgage lending activities.
• Asset management revenue Management segment related to investment management
• Dealer compensation – asset-based and sales-based segment.
• Advisory and business development expenses – expenses include compensation, recognition and other support
under management or advisement, business development measures including sales and client acquisition, and the number of advisor and client relationships.
• Operations and support expenses – expenses associated
• Sub-advisory expenses – reflects fees relating to investment
Interest expense represents interest expense on long-term debt and leases. Interest expense is allocated to each segment
consolidated changes in the effective tax rates are detailed in
levels of income taxes. Management monitors the status of its of its provision for income taxes and, as a result, income income tax rates on foreign operations.
recurring nature or that could make the period-over-period comparison of results from operations less meaningful and are not allocated to segments.
Other items in the first quarter of 2023 included a gain on
eight most recent quarters and the reconciliation of non-IFRS
• Advisory fees are related to providing financial advice to clients including fees related to the distribution of products under advisement.
• Product and program fees are related to the management of investment products and include management, the level and composition of assets under management.
• Other financial planning revenues are fees related to providing clients other financial products including mortgages, insurance and banking products.
parties for investment management services provided to our
based on values for similar sized asset management mandates.
Income taxes are also reported in each segment.
comprehensive personal financial planning to Canadians. Investment Planning Counsel, founded in 1996, is an independent distributor of financial products, services and products the total segment.
– have been classified as
of the common shares of Investment Planning Counsel Inc.
nesto
a strategic agreement in the fourth quarter of 2022 to have
and financial planning platforms.
Corporate Class Mutual Funds trust fund equivalent, on a tax deferred basis. The mergers are expected to be completed during the second quarter.
to inspire financial confidence that can transform the lives of and live.
Advisors
more than 3,000 advisors in communities throughout Canada. complicated financial needs.
•
segments tend to have more complicated financial needs, and confidence.
• entrepreneurial advisor practices to focus on those clients comprehensive financial planning and product solutions. Our client segmentation approach and enhancing a strong brand.
• represented 36% of total assets under advisement.
• advisement.
communities and a better future for all.
that takes into consideration all dimensions of their financial
Our strategic mandate is to be Canada’s financial partner investment solutions designed to deliver returns and risks that take into account each client’s needs and requirements. value of all efforts that sit outside the investment portfolio construction. This includes the value that an advisor adds to
• represented 8% of total assets under advisement. in holding a credentialed financial planning designation. These qualifications that require an individual to demonstrate financial planning competence through education, standardized examinations, continuing education requirements, and
•
•
•
• 1,162 associates and regional vice-presidents (1,164 at
management, retirement, tax and estate planning services.
through an enhanced digital experience to develop and track a
• period of 2022.
• of 2022.
• impediment.
• Tightened recruiting standards that increased the likelihood
• National Service Centre that provides consistent service for advisors.
•
•
• TM and other client experience enhancements.
• Digital application to deliver tailored client investment advanced financial planning, mortgages and banking, insurance, providing comprehensive financial planning across all elements licensed and securities licensed advisors and specialists.
These products include:
• that match risk and investment performance to each client’s needs and requirements.
• from the leading insurers in Canada.
• Mortgage and banking solutions that are offered as part of a comprehensive financial plan.
The Charitable Giving Program is a donor-advised giving securities and investment products available in the marketplace to individual investors. investment portfolios, and to create value for clients through of investment products and solutions. Each asset manager is all sub-advisors to ensure that their activities are consistent
Our investment solutions leverage top global asset manager relationships including Mackenzie Investments and other
product changes that enable clients to achieve their goals.
financial advice to their clients.
that include public markets, private markets and alternative strategies.
Our investment solutions include:
• capitalization and sector.
• Managed solutions that rebalance investments to ensure that a chosen mix of investments and risk and return is
• Segregated funds that provide for long-term investment guarantee features and estate planning efficiencies.
• the introduction of a Private Credit Mandate in the iProfile Fixed Income Private Pool. The pool has committed to three Northleaf Capital Partners’ private credit investments that PIMCO and Sagard. Private Investment Mandates are also
and long-term capital appreciation through exposure to
a commitment to the Northleaf Capital Opportunities Fund. † fund
• iProfile Portfolios – iProfile Portfolios are a suite of four managed solutions that provide comprehensive diversification and are designed to suit personal preferences for risk tolerance and investment goals. These portfolios provide exposure similar to the investments of the iProfile Private Pools.
• iProfile Private Portfolios – iProfile Private Portfolios are model portfolios comprised of iProfile Private Pools, Management in excess of $250,000. iProfile Private Portfolios
determining fund performance.
fund assets had a rating of three stars or better from Morningstar † fund ranking service and 58.4% had a rating of four or five stars. This compared to the Morningstar † universe of 85.8% for three stars or better and 49.9% for four and five † are an
model portfolios and six iProfile Private Pools to support the iProfile ETF Private Pool providing exposure through Market geographic coverage.
investment returns.
redemptions and investment returns. and investment products, including assets under management
in the comparable period in 2022. During the first quarter, in assets under advisement compared to a decrease of Changes in mutual fund assets under management for the assets under management.
first quarter, investment returns resulted in an increase of
average redemption rate for all other members of the
distribution of life insurance in Canada. Through its care coverage and group insurance.
the first quarter, increased 15.9% from the previous quarter, the first quarter compared to 11.0% in the fourth quarter of provide guaranteed retirement income for life. The investment
Insurance Planning Specialists, located throughout Canada, Investors Group Securities Inc. is an investment dealer registered in all Canadian provinces and territories providing
through Investors Group Securities Inc. †
solution that integrates the features of a mortgage, term loan, revolving line of credit and deposit account, is also offered through Solutions Banking †
a strategic agreement to have nesto provide next generation across Canada through its Mortgage Cloud solution. nesto’s
enhanced mortgage experience through: an online application advisors to develop mortgage and lending strategies that meet the individual needs and goals of each client as part of their comprehensive financial plan.
and through Solutions Banking † for the first quarter ended †
2023, the balance outstanding of Solutions Banking †
Other products and services offered through Solutions Banking † include investment loans, lines of credit, personal loans, creditor insurance, deposit accounts, and credit cards. Through Solutions Banking †
and client service centre. The Solutions Banking † offering financial solutions for our clients through a broad financial planning platform. Total outstanding lending products of † offering, including Solutions Banking † mortgages totalled
Management and Investment Planning Counsel.
quarter in 2022 and unchanged from the prior quarter.
quarter in 2022 and a decrease of 0.1% from the prior quarter.
clients including fees related to the distribution of products, of average assets under advisement compared to 101.9 basis points in 2022.
composition of mutual fund assets under management.
due to the decrease in average assets under management of under management compared to 86.0 basis points in 2022, reflecting price reductions in certain funds and changes in product mix.
• Mortgage banking operations
• Distribution of insurance products through I.G. Insurance Services Inc.
• Securities trading services provided through Investors Group Securities Inc.
• Banking services provided through Solutions Banking†
development expenses that include compensation paid to our sales levels, such as direct marketing and advertising, financial planning specialist support and other costs incurred to support selling commission units maturing and other compensation
Net investment income and other consists of unrealized gains
on our cash and cash equivalents and securities and other income not related to our core business. It also includes a charge from the Strategic Investments and Other segment for the use of unallocated capital.
decreases in other advisor program expenses and distribution of insurance products.
management and other general and administrative functions
incorporated throughout 2022. management.
on long-term debt and interest expense on leases, totalled
average assets under management, compared to 102.4 basis points in the fourth quarter.
Expenses
in asset based compensation as a result of higher assets.
quarter due to continued focus on expense management.
in the fourth quarter of 2022. The increase in product and
2023 than the comparable period in 2022. the prior quarter.
in the fourth quarter due to a decrease in earnings from the distribution of insurance products.
• Net asset management fees – third party includes fees received from our mutual funds and fees from third parties for investment management services. Compensation paid to dealers offsets the fees earned.
• Asset management fees – Wealth Management includes
segment and transfer pricing is based on values for similar sized asset management mandates.
Income taxes are also reported in each segment.
Mackenzie Investments is a diversified asset management
investment mandates through a boutique structure and using
asset management solutions provider and business partner.
• Management fees earned from its investment funds, sub-advised accounts and institutional clients.
• Fees earned from its mutual funds for administrative services.
• The largest component of Mackenzie’s revenues is management fees. The amount of management fees depends on the level and composition of assets under management. Management
than fixed income mandates and retail mutual fund accounts have higher management fee rates than exchange traded funds, sub-advised accounts and institutional accounts.
attracting and fostering the best minds in the investment an innovative and future oriented product focus, and being
Our investment management capabilities are delivered through
on being committed to the success of our clients and on having defining features of our approach.
and infrastructure investment solutions to our clients and our
in selected areas. The development of a broad range of supporting the evolving financial needs of investors.
strategic alliances and institutional.
advisors and their firms across Canada. Our innovative, comprehensive lineup of investment solutions covers all asset products and investment solutions designed to help advisors to provide enhanced investment solutions. In addition to our retail distribution team, Mackenzie also institutional marketplace. banks, insurance companies and other investment companies.
focus on client experience and investment excellence. investors the importance of remaining invested across all The changes in total assets under management are total assets under management. our clients.
and launched a suite of 25 funds designed to address the
In the institutional channel, Mackenzie provides investment management services to pension plans, foundations and other
2022, a decrease of 6.9%. Mackenzie’s mutual fund assets
institutional accounts can be more pronounced than in the retail channel, given the relative size and the nature of the distribution relationships of these accounts. These accounts under management.
Mackenzie continues to be positioned to build and enhance our distribution relationships given our team of experienced
During the current quarter, investment returns resulted in Mackenzie ETFs. Excluding this transaction, ETF net creations
Redemptions of long-term mutual funds in the first quarter
first quarter of 2023, compared to 15.4% in the first quarter
redemption rates for front-end load assets and matured assets are higher than the redemption rates for deferred sales charge
2022. Net sales of Mackenzie mutual funds for the current Redemptions of long-term mutual fund assets in the current compared to 18.2% in the fourth quarter.
fourth quarter.
fourth quarter.
Dublin and Hong Kong.
Oversight is conducted through a common process intended Mackenzie’s 56% economic interest in Northleaf enhances its credit and infrastructure investment solutions to our clients. supplements investment capabilities through the use of third initiatives on climate change in support of the global goal
• Released 2030 interim net zero targets.
• companies that are high contributors to Mackenzie’s financed emissions.
• time frame. Mackenzie also monitors its fund performance relative to the ratings it receives on its mutual funds from the
Morningstar †
† had a rating of three stars or better and 43.8% had a rating of four or five stars. This compared to the Morningstar † universe of 85.8% for three stars or better and 49.9% for four and five star funds enhanced investment solutions for financial advisors to offer their clients.
launches and fund mergers to streamline fund offerings for advisors and investors.
expand retail investor access to private market investment solutions. Mackenzie’s broad and innovative fund line-up and reflects its personal goals. These ETFs offer investors another investment Mackenzie’s current line-up consists of 45 ETFs: 24 active and strategic beta ETFs and 21 traditional index ETFs. ETF assets assets under management.
Knights Global 100 Index ETF and Mackenzie Corporate Knights management, enduring financial strength and exceptional
the first quarter in 2022 and a decrease of 5.7% from the quarter in 2022 and a decrease of 6.2% from the prior quarter.
•management and administration fees earned from our investment funds and management fees from our third
The largest component is management fees from our investment funds. The amount of management fees depends on the level and composition of assets under rates than exchange traded funds, fixed income mandates and retail mutual fund accounts have higher management fee rates than sub-advised and institutional accounts. The
-Redemption fees – consists of fees earned from the redemptions of mutual fund assets sold on a deferred
option. Redemption fees charged for deferred sales charge the purchase option.
-Dealer compensation expenses – consists of assetcompensation represents trailing commissions paid to dealers on certain classes of retail mutual funds and are calculated as a percentage of mutual fund assets under compensation are paid to dealers on the sale of mutual funds under the deferred sales charge purchase option
load purchase options as of June 1, 2022, in accordance
processes, in-house investment management and product shelf management, corporate management and support
53.2 basis points in the comparative period in 2022. The increase average assets under management. Mackenzie’s management comparative period in 2022.
on long-term debt and interest expense on leases, totalled
to Mackenzie.
• current quarter, an increase of 2.7% from the prior quarter.
• the current quarter compared to 55.1 basis points in the
•
• current quarter, an increase of 3.6% from the prior quarter.
the current quarter compared to 14.7 basis points in the
commissions and the timing of certain expenses.
The Strategic Investments and Other segment includes Earnings from the Strategic Investments and Other segment
investment income on unallocated capital.
The proportionate share of associates’ earnings increased in 2022. The increase in the three month period from 2022
combined direct and indirect interest of 24% and a fair value of used in the valuation of comparable public companies. to backing innovating financial services companies and are
in Net investment income and other in the Consolidated Statements of Earnings. of residential mortgages sold to securitization programs measured at fair value through profit or loss are residential
Total loans being held pending sale or securitization are serviced basis, including Canada Mortgage and Housing
interest rate risk, can be found in the Financial Risk section of
residential mortgages are sold to securitization trusts
Corporation of Canada.
Insurance Contracts
mortgages and related obligations are carried at amortized effective interest rate method, recorded over the term of the Mortgage Bonds and receives investment returns on the reinvestment of repaid mortgage principal, are recorded at fair carried at amortized cost.
Founded in 1998 as one of the first fund management a position among the market leaders in China’s asset
interest and a 70% economic interest in Northleaf. The infrastructure fund manager headquartered in Toronto.
is used to account for the acquisition vehicle’s 70% economic interest as it exercises significant influence. Significant influence arises from board representation, participating in recognizes the full 70% economic interest in Northleaf and Northleaf’s assets under management, including invested
included in deposit liabilities.
liabilities excluding assets and liabilities held for sale, totalled
Earnings before interest, taxes, depreciation and amortization non-IFRS measure (see Non-IFRS Financial Measures and Other
• Finance ongoing operations, including the funding of
• Finance common share repurchases and retirement of long-term debt.
• Capital investment in the business and business acquisitions.
its operations. Earnings before interest, taxes, depreciation
first quarter of 2023 in 2022. Cash and cash equivalents from discontinued
during the first quarter of 2023 compared to 2022 consist of
• The add-back of amortization of capitalized sales commissions paid.
• The add-back of amortization of capital, intangible and
• Changes in operating assets and liabilities and other.
The first quarter of 2022 also included the purchase of 570,000
Investing activities during the first quarter of 2023 compared to
Financing activities during the first quarter of 2023 compared to 2022 related to:
• to an increase in obligations to securitization entities
mortgage banking operations.
represents the amount of accumulated other comprehensive maintaining a solid capital base and a strong balance sheet.
Other activities in 2023 included the declaration of common Changes in common share capital are reflected in the reflect the potential impact of all risks on the value of securities rating organization.
mutual fund dealers, exempt market dealers, portfolio
These subsidiaries are required to maintain minimum
susceptible to the adverse effects of changes in circumstances and economic conditions than obligations in higher
market inputs are used in the valuation techniques.
• financial institutions.
•
Morningstar long-term rating scale, debt securities rated
• length third parties, use of market multiples, and discounted
• entities having similar terms and characteristics.
•
financial assets and financial liabilities. The table excludes fair value information for financial assets and financial liabilities not approximation of fair value. These items include cash and cash equivalents, accounts and other receivables, certain other certain other financial liabilities.
• debenture available in the market.
• Other investments and other financial assets and financial liabilities are valued using quoted prices from active markets, available, valuation techniques are used that require assumptions related to discount rates and the timing and
• Derivative financial instruments are valued based on quoted additional discussion on the determination of fair value of financial instruments.
fair values of financial instruments, these changes did not have
strong risk management culture and the implementation of an effective risk management approach. Our approach coordinates risk management across the organization and its business units and seeks to ensure prudent and measured risk-
and return. Fundamental to our enterprise risk management program is protecting and enhancing our reputation. through our comprehensive Enterprise Risk Management
risk governance, risk appetite, risk principles, a defined risk management process, and risk management culture. The
• conflicts of interest. Management, Mackenzie Investments and Investment Planning Counsel, the Chief Financial Officer, the General Counsel, the Chief Operating Officer, and the Chief Human Resources
The Chief Executive Officers of the operating companies have respective companies.
Executive Risk Management Committee accountable to the Risk out its risk management mandate. The Risk Committee is the risk governance structure and risk management program of management process on a regular basis to ensure that it is • responsibilities in relation to financial disclosure, internal compliance activities, including administration of the Code
• The Human Resource Committee oversees compensation policies and practices.
• The Governance and Nominating Committee oversees corporate governance practices.
The leaders of the various business units and support activities. Responsibilities of business unit and support function the identification, assessment, documentation and escalation the Risk Management Committee.
Committee on the level of risks relative to the established risk and training to business unit and support function leaders.
including the Financial Risk Management and Operational Risk Management committees. These committees perform
and business units for identification and assessment of risks.
Third Line of Defence provides independent assurance to senior management and risk management policies, processes and practices.
risk transfer activities. The results of these assessments are including the ERM Department. The ERM Department promotes and coordinates communication and consultation to support effective risk management and escalation. The assessments and on the assessment process to the Risk Management Committee and to the Board Risk Committee.
understood and managed. These appetite levels guide our inform them in establishing policies, limits, controls and risk
into our business activities.
reinforces our risk management culture. Our compensation practices, responsible management and measured risk-taking ongoing risk management process.
• Ongoing assessment of risks and tolerance in a changing operating environment.
• emerging risks and risk response.
• changing circumstances.
both internal and external to the organization. These risks are strategic, business, and environmental and social.
processes.
• Performing regular cash forecasts and stress testing.
• Regular assessment of capital market conditions and the
funding sources.
• Management Committee, a committee of finance and other business leaders.
compensation paid for the distribution of financial products and services. This compensation continues to be paid from collateral requirements. Through its mortgage banking operations, residential mortgages are sold to third parties including certain mutual funds, institutional investors through private placements, Canadian bank-sponsored securitization
not utilizing its committed lines of credit or its uncommitted lines of credit.
The actuarial valuation for funding purposes related to the
securitization market conditions and government regulations
The registered pension plan had a going concern surplus
requirements, changes in assumptions and management’s
included in assets held for sale at March 31, 2023 are held
Corporation at March 31, 2023. The maximum exposure to credit risk on these financial related to cash and cash equivalents and fixed income securities
Mortgage Portfolio
Credit Risk to a transaction fails to meet its obligations. practices on an ongoing basis to evaluate their effectiveness.
Cash and Cash Equivalents and Client Funds on Deposit
mortgages through:
in cash reserve accounts and future net interest income, to future net interest income are not reflected on the balance
Term Income Fund through an agreement to repurchase mortgages in certain circumstances benefiting the funds. These credit losses.
chartered banks and, as a result, management has determined
all credit-related losses in the mortgage portfolios based on:
activities and utilization of derivative contracts can be found in Note 7 to the Interim Financial Statements and Notes 2, 7 and
This is the risk of loss arising from changes in the values of the
Interest Rate Risk portfolio and on certain of the derivative financial instruments used in our mortgage banking operations.
testing of losses under adverse real estate market conditions.
• of the securitization transactions under the CMB Program.
investment returns on reinvested mortgage principal
contracts
utilizes
hedge interest rate risk, to facilitate securitization transactions and to hedge market risk related to certain stock-based compensation arrangements. These
that the interest rates earned on floating rate mortgages and reinvestment returns decline. The fair value of these
To the extent that the fair value of the derivatives is in a its counterparties fail to fulfil their obligations under these arrangements. aggregate credit risk exposure related to derivatives that or collateral arrangements. The exposure to credit risk, considering netting agreements and collateral arrangements
•
committed to or held pending sale or securitization to long-
or securitization. Hedge accounting is applied to the cost of funds on certain securitization activities. The effective portion of fair value changes of the associated interest revenue over the term of the related Obligations to
exposure to and management of interest rate risk have not Equity Price Risk
other comprehensive income or fair value through profit are deferred and linked to the performance of the common Foreign Exchange Risk
due to changes in foreign exchange rates are recognized in recorded in Proportionate share of associates’ earnings in the Consolidated Statements of Earnings, is also affected
percentage of the level of assets under management and risks that affect the value of assets under management and advisement on an ongoing basis. These include market risks, client portfolios.
to investment returns on its client portfolios is beneficial
activities such as hedging in relation to these exposures. of its assets under management, revenues, earnings and cash
This is the risk of financial loss, reputational damage or
errors relating to transaction processing, financial models and valuations, fraud and misappropriation of assets, and inadequate application of internal control processes.
Operational risks relating to people and processes are mitigated through policies and process controls. Oversight of risks and ongoing evaluation of the effectiveness of controls
program to enable critical operations and processes to function in the event of a business disruption.
assesses and determines the nature and extent of insurance that is appropriate to provide adequate protection against
or contractual agreements.
Operational risk affects all business activities, including operational risk can be difficult to measure, given that it forms
The business unit leaders are responsible for management of units. Specific programs, policies, training, standards and governance processes have been developed to help manage operational risk.
response coordination policies and procedures in the event has a crisis assessment team comprised of senior leadership engaged in the scenario-dependent crisis response team.
that of clients or other stakeholders, and could result in negative consequences including lost revenue, litigation, home programs introduces increased need to mitigate risk of potential data loss.
efficiencies that support our operational activities. Our standard operating procedures and dedicated resources, and monitoring activities before entering into contractual
Model Risk
instruments, operational scenario testing, management of acquisitions. These models incorporate internal assumptions, observable market inputs and available market prices. Effective controls exist over the development, implementation and assumptions or other factors affecting the models could have position and reputation.
Legal and Regulatory Compliance Risk
to regulation governing product distribution, investment management, accounting, reporting and communications.
processes and oversight, including specific communications on compliance and legal matters, training, testing, monitoring and reporting on compliance initiatives and issues.
Business units are responsible for management of legal and policies, procedures and controls. The Compliance Department is responsible for providing oversight of all regulated
Privacy Risk
transfer, disclosure and retention of personal information
agencies of the federal, provincial and territorial governments and its subsidiaries. These requirements include those that management and provision of financial products and services, including securities, insurance and mortgages, and other
information and protect it through contractual and other measures that commit the service providers to maintain levels of protection comparable to ours.
to promote a strong culture of compliance. The monitoring of
controls regarding the handling and safeguarding of personal
also continues to develop and maintain compliance policies,
complaints and access to information requests.
Contingencies course of its business. In December 2018, a proposed
client account numbers, names, addresses and social insurance impacted clients and offered credit monitoring at no cost for this incident.
This is the risk of potential adverse impacts resulting from inadequate or inappropriate governance, oversight, our shareholders.
business cases and oversees progress against our strategic strategic plan. The strategic plan sets out both the annual and discussion of strategic matters including receiving updates less competitive than the products of other financial service treatment, disclosure requirements, transaction processes or also impact product structures, pricing, and dealer and advisor treatment of financial products or services is limited. guidance and communications.
Acquisition Risk
companies – Investors Group Inc., Mackenzie Financial Corporation and Investment Planning Counsel Inc. – each of
due diligence prior to completing an acquisition, but there
to an acquisition. Subsequent changes in the economic expense reductions. The success of an acquisition and of the General
This risk refers to the potential for unfavourable impacts on factors relating to the marketplace. and demographics can affect investor confidence, income levels and other factors can influence inflation, interest rates, global result in investors redeeming their investments. These factors educate Canadian investors on the merits of financial planning, Redemption rates for long-term funds are summarized in
Catastrophic events or loss refers to the risk that events such as earthquakes, floods, fire, tornadoes, pandemics, or terrorism investor confidence, income levels and financial planning management and advisement.
This risk refers to the potential for unfavourable impacts on service providers, investment managers and product and relative service levels, relative pricing, product attributes, position and operating results. Please refer to The Competitive to ensure competitiveness in the marketplace. products relative to benchmarks and peers. Poor investment performance relative to benchmarks or peers could reduce the level of assets under management and sales and asset reputation. Meaningful and/or sustained underperformance investment processes and disciplines that give us a competitive
This risk refers to the potential for unfavourable impacts on
Management clients and advisors, Mackenzie retail distribution, strategic and significant business partners, clients of Mackenzie funds, and sub-advisors and other product suppliers. relationship based on the client’s confidence in that individual
important role in developing, implementing, managing and purpose of driving an inclusive, equitable and consistent
range of products and services in the context of personalized
derives sales of its investment products and services from its strategic alliance and institutional clients. Due to the nature of the distribution relationship in these relationships and the relative size of these accounts, gross sale and redemption
adverse effect on Mackenzie’s operating results and business
to continue to build and enhance its distribution relationships. Mackenzie’s diverse portfolio of financial products and its longterm investment performance record, marketing, educational and service support has made Mackenzie one of Canada’s leading investment management companies. These factors
This is the potential for financial loss or other unfavourable connected to our business operations, investment activities, chain, including clients, investee companies and suppliers. Environmental risks include issues such as climate change, Committee, the Board is responsible for ensuring that material responsible for oversight of the risk management process, committees provide oversight of specific risks including the initiatives, measuring progress, and approving annual reporting
Our commitment to responsible management is demonstrated through various mechanisms. These include our Code of investment sub-advisors, are signatories to the Principles Investment Planning Counsel have implemented Sustainable strong ESG performance through positions earned on the FTSE4Good Index Series, Jantzi Social Index, Corporate Knights’ 2023 Global 100 and 2022 Best 50 Corporate Citizens.
Committee, the Board is responsible for ensuring that material
corporate disclosures on greenhouse gas emissions and climate change management including setting and monitoring
climate disclosures.
in response to investor demand for enhanced information on operating companies support the TCFD recommendations related financial disclosures that provide decision-useful
The senior-most leaders at each of our operating companies Chief Risk Officer oversees implementation of the Corporate investee companies, and addressing increased disclosure expectations. roadmap, and the market.
and ESG matters including but not limited to evaluating and considering climate-related risks and opportunities. detailed its climate commitments in a position statement on
The TCFD recommends that organizations disclose information about climate-related risks and opportunities in four areas: Our Board is responsible for providing oversight on risk and to discuss plans and emerging ESG issues. Through its Risk
1. – Our to manage climate risks and create innovative solutions to our ongoing climate issues.
2. Collaborating and engaging to help shape the global transition –and solutions to clients, helping companies adapt, and
3. stand behind our commitments.
Our operating companies are active participants in collaborative engaging companies on improving climate change governance, reducing emissions and strengthening climate-related financial mortgage loans and investments. Climate-related risks and opportunities are identified and budgets. Our climate-related risks and opportunities can be
focuses on thematic investing to combat climate change and and governance factors.
Risks
and benefit from the global transition to net zero emissions.
Scenarios
requirements that could affect our business. Diversification the valuations of investment properties and client mortgages,
emissions reductions over time in meeting the goals of the external data providers to support us in our efforts to run
Our operating companies are committed to sustainable investing material climate risks into our investment and oversight of the hiring process and ongoing assessment of sub-advisors, Opportunities sustainable investing and climate change.
identification and assessment of risks, considering factors both grouped into five categories: financial, operational, strategic, focused on defining the relationship of climate risk to other material risks.
and IPC, management evaluates the sustainable investing practices of investment manager sub-advisors, including the integration of climate risks into their investment and active
Management, investment management sub-advisors including Mackenzie are responsible for engagement activities and regular due diligence and oversight.
Mackenzie Investments is a founding participant in Climate Engagement Canada and participates in CERES’ Investor Investor Statement on Climate Change.
possible, including Scope 3 investment emissions related to to expand and enhance our measurement and reporting of emissions related to our investment portfolios as tools and information improves.
Investments also set interim targets for investment portfolios as The long-term nature of these targets require significant
recent report from Investor Economics. The nature of holdings cash management purposes to longer-term investments held for longer-term savings needs of Canadians. Of the $2.3 trillion held consisted of bank deposits. emphasis of our business model is to support these financial promote the value of financial advice and the importance of a long-term financial plans and goals.
of investment funds are comprised of mutual fund products, hedge funds, pooled funds, closed end funds and exchange available in a broad range of mandates and structures to meet most investor requirements and preferences.
brokerages, financial planning firms and insurance agent sales service providers strive to offer comprehensive financial advice implemented through access to a broad product
financial planning and investment management services. Canadian banks distribute financial products and services
full service and discount brokerage subsidiaries. Bank branches continue to place increased emphasis on both financial
banks has one or more mutual fund management subsidiaries. mutual fund managers and affiliated firms represented 46% of and 68% of total mutual fund assets under management at larger organizations.
efficiencies and improve the service experience for our to meet competitive challenges and capitalize on future
Our competitive strength includes:
• Broad and diversified distribution through more comprehensive financial planning.
•
• Enduring client relationships and the long-standing heritages and cultures of its subsidiaries.
•
• Shifting demographics as the number of Canadians in their
• Changes in investor attitudes based on economic conditions.
• Continued importance of the role of the financial advisor.
distribution through over 30,000 independent financial entities to provide investment management services.
service providers in the advice segment, including other banks and insurance companies. Our asset management other investment managers for assets under management, classes for a share of Canadians’ investment assets. Competition from other financial service providers, alternative or public preferences could impact the characteristics of our product and service offerings, including pricing, product structures, dealer and advisor compensation and disclosure. as appropriate.
Our subsidiaries continue to develop and launch innovative products and strategic investment planning tools to assist advisors in building optimized portfolios for clients. clients. In addition, our subsidiaries have strong heritages and
innovations, effective and responsible management of the
This includes efforts to modernize our digital platforms and
products and capital.
to critical accounting estimates from those reported at be measured using updated estimates and assumptions that to insurance contracts and is effective for periods beginning the option to defer adoption of IFRS 9 – Financial Instruments
IFRS 17 and IFRS 9 in the second quarter of 2023. This change public disclosures.
During the first quarter of 2023, there have been no changes
Financial Statements.
2023 totalled 238,037,799. Outstanding stock options as at totalled 238,041,916 and outstanding stock options totalled
Information Form, is available at
(unaudited) (in thousands of Canadian dollars)
(unaudited) (in thousands of Canadian dollars)
(unaudited) (in thousands of Canadian dollars)
(unaudited) (In thousands of Canadian dollars, except shares and per share amounts)
Interim Financial Reporting, using the accounting policies as set out
2023. Entities adopting IFRS 17 had the option to defer adoption of IFRS 9 – Financial Instruments beginning this quarter. classified as assets and liabilities held for sale.
revenues include insurance, banking products and services, and mortgage lending activities.
composition of assets under management.
including revenue multiples used in the valuation of comparable public companies.
revenue also includes other mortgage banking related items including portfolio insurance, issue costs, and other items.
these mortgages on its balance sheets and has recorded offsetting liabilities for the net proceeds received as Obligations to
on securitized mortgages that are not due to be settled until after the reporting period. Issue costs are amortized over the life of the obligation on an effective interest rate basis.
First preferred shares, issuable in series
Second preferred shares, issuable in series
Class 1 non-voting shares
Common shares, no par value
average fair value of options granted during the three months ended March 31, 2023, has been estimated at $5.56 per option
Other assumptions used in these valuation models include:
valuation methodologies.
valuation techniques.
long-term debt. The fair value of fixed income securities is determined using quoted market prices or independent dealer price quotes. The fair value of derivative financial instruments and deposits and certificates are determined using valuation models, is determined using indicative broker quotes.
financial assets, obligations to securitization entities and derivative financial instruments. Derivative financial instruments consist
amortized cost. The table also excludes fair value information for financial assets and financial liabilities not measured at fair value if
•
related to this incident.
• Strategic Investments and Other
• Wealth Management
Canadian households through their securities dealers, mutual fund dealers and other subsidiaries licensed to distribute financial financial products and services to Canadian households. This segment also includes the investment management activities of
• Asset Management services, and represents the operations of Mackenzie Investments. Investment management services are provided to a suite of mandates to financial institutions, pensions and other institutional investors.
• Strategic Investments and Other
751 Victoria Square
Montréal, Quebec, Canada H2Y 2J3
514-286-7400
1-800-890-7440
corporate.secretary@powercorp.com
www.powercorporation.com
This document is also available on the Corporation’s website and on SEDAR at www.sedar.com
Shares of Power Corporation of Canada are listed on the Toronto Stock Exchange:
Subordinate Voting Shares: POW
Participating Preferred Shares: POW.PR.E
First Preferred Shares, Series A: POW.PR.A
First Preferred Shares, Series B: POW.PR.B
First Preferred Shares, Series C: POW.PR.C
First Preferred Shares, Series D: POW.PR.D
First Preferred Shares, Series G: POW.PR.G
161 Bay Street, Suite 5000 Toronto, Ontario, Canada M5J 2S1 416-607-2250
Computershare Investor Services Inc.
Offices in:
Montréal, Quebec; Toronto, Ontario; Vancouver, British Columbia www.investorcentre.com
Shareholders with questions relating to the payment of dividends, change of address, share certificates, direct registration and estate transfers should contact the Transfer Agent:
Computershare Investor Services Inc.
Shareholder Services
100 University Avenue, 8th Floor Toronto, Ontario, Canada M5J 2Y1
1-800-564-6253 (toll-free in Canada and the U.S.) or 514-982-7555 www.computershare.com
Power Corporation of Canada is a certified Imagine Canada Caring Company, recognized for leadership and excellence in community investment.
To learn more about the organizations we support, visit www.PowerCorporationCommunity.com