33 minute read
A New Approach to Operational Excellence for Oil and Gas


Technology Applications
A New Approach to Operational Excellence for Oil and Gas
Advertisement
By: Marco Buzzo and Marco Mazzoni, Backer Hughes, a GE Company
Abstract
Organizations generally run several improvement initiatives simultaneously targeting different aspects of their operations. These initiatives will improve the specific operation efficiency, but due to the fragmented approach don›t necessarily lead the organization to lasting results. The overall effectiveness can be improved by an all-embracing program allowing all initiatives to align, leverage one another and succeed – approach commonly identified as Operational Excellence (OE) [1]. Even if a standard definition of OE is not specified, its concept has been developed around 2000 in the Quality circles [2] and rapidly spread as an evolution of the total quality management [3]. OE - due to its amplitude, requires a longterm sustained commitment from executives, senior leaders and employees. In the past this approach would have made little sense for most operations in the Oil and Gas industry due to their predictability and stability. In the last decade this industry has been under a continuous pressure due to a constant decline in the oil barrel price coupled with rising exploration, development and production costs, putting margins under significant pressure. Furthermore, the market push for risk reduction even when the industry is taking new challenges like drilling in ultra-deepwater or in the Arctic, intensive onshore operations in populated areas (like shale gas in the northeastern US) and pioneering technologies like floating liquefied natural gas terminals. Industry executives are working to define and deliver OE at such frontiers, where few benchmarks exist. The need of enterprise-wide operational effectiveness and to achieve consistently better results in the Oil and Gas industry has been also seen as market evolution from the top consulting firms that offer such dedicated services. It has been estimated that a 10% production capacity is locked up in complexity and inefficiency—a valuable opportunity for improvement [4]. Despite these opportunities, OE implementation literature in Oil and Gas is marginal and experiences have been mainly reported limited to the field of health, safety and environment [5], [6], [7]. This work presents a novel approach to OE in the Oil and Gas industry, carried out at Backer Hughes, a GE Company in its Turbomachinery & Process Solutions division. This part of the organization represents a common complex case study in this industry, due its global footprint where a constellation of more than 100 manufacturing, engineering and service sites hosting more than 12000 employees. The next chapters present the assessment, selection and adoption of a standard OE model, the evaluation of current operations with respect to the model and the development of initiatives supporting it.
Introduction
Organizations generally run several improvement initiatives simultaneously targeting different aspects of their operations. These initiatives will improve the specific operation efficiency, but due to the fragmented approach don›t necessarily lead the organization to lasting results. The overall effectiveness can be improved by an all-embracing program allowing all initiatives to align, leverage one another
and succeed – approach commonly identified as Operational Excellence (OE) [1]. Even if a standard definition of OE is not specified, its concept has been developed around 2000 in the Quality circles [2] and rapidly spread as an evolution of the total quality management [3]. OE - due to its amplitude, requires a long-term sustained commitment from executives, senior leaders and employees. In the past this approach would have made little sense for most operations in the Oil and Gas industry due to their predictability and stability. In the last decade this industry has been under a continuous pressure due to a constant decline in the oil barrel price coupled with rising exploration, development and production costs, putting margins under significant pressure. Furthermore, the market push for risk reduction even when the industry is taking new challenges like drilling in ultra-deepwater or in the Arctic, intensive onshore operations in populated areas (like shale gas in the northeastern US) and pioneering technologies like floating liquefied natural gas terminals. Industry executives are working to define and deliver OE at such frontiers, where few benchmarks exist.
The need of enterprise-wide operational effectiveness and to achieve consistently better results in the Oil and Gas industry has been also seen as market evolution from the top consulting firms that offer such dedicated services. It has been estimated that a 10% production capacity is locked up in complexity and inefficiency—a valuable opportunity for improvement [4]. Despite these opportunities, OE implementation literature in Oil and Gas is marginal and experiences have been mainly reported limited to the field of health, safety and environment [5], [6], [7]. This work presents a novel approach to OE in the Oil and Gas industry, carried out at Backer Hughes, a GE Company in its Turbomachinery & Process Solutions division. This part of the organization represents a common complex case study in this industry, due its global footprint where a constellation of more than 100 manufacturing, engineering and service sites hosting more than 12000 employees. The next chapters present the assessment, selection and adoption of a standard OE model, the evaluation of current operations with respect to the model and the development of initiatives supporting it.
Materials and Methods
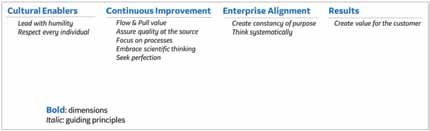
The landscape of OE experiences shows a variety of approaches that have been developed for the specific organization needs with strong focus in the field of health, safety and environment like in the cases of the Oil and Gas industry [5], [6], [7]. In other industries the OE experiences led to the development of models and the subsequent rise of consulting services around it [8]. A well-documented and internationally recognized OE model is the Shingo one [9], which is the reference for the Shingo prize for Operational Excellence established in 1988 [10]. Shigeo Shingo has been one of the most influential consultants on Japan›s manufacturing industries in the 50s [11], who worked with the industry leader Taiichi Ohno on the development of Toyota Production System [12], [13], [14]. In his work the path to OE is presented as the need for a comprehensive approach to improvement, which goes beyond than the application of new tools or enhancement of single processes. Sustainable excellent results require to nurture an organization›s culture aligned to specific guiding principles rather than depending solely on tools, programs or initiatives. Shingo defined the model that takes his name providing a framework for transforming an organization›s culture to achieve ideal results. He focuses on the individual in the organization who has a set of values and beliefs influencing the way he behaves. Ultimately, the aggregate of people,s behaviors makes up the organizational culture, that in turn influences the organization,s results. This lead to the definition of ten guiding principles, known as the Shingo Guiding Principles, that are the basis for building a lasting culture and achieving enterprise excellence. The principles are divided into four dimensions as depicted in Figure 1: Cultural Enablers, Continuous Improvement, Enterprise Alignment and Results [15].
Firstly, we evaluated and confirmed the compatibility of the principles behind this model with the pillars of the organizational culture [16]. After that we decided to assess how the organization subject to the study would compare with respect to the behaviors identified it model. The next paragraphs describe clarify how the organization has been evaluated and what initiatives have been designed to secure improvements in each of the model dimensions.
Survey
An in-depth assessment of the organization would require an extensive audit program in several sites, rising doubts on the global validity of those findings and its timely feasibility. We decided to conduct a survey to get swift results even if with limited accuracy. The survey has been developed along the principles of the Shingo model identifying 19 ideal behaviors distributed according to the four dimensions: cultural enablers (4 behaviors), continuous improvement (9 behaviors), enterprise alignment (3 behaviors), results (3 behaviors). For each of the ideal behaviors the survey participants have been requested to provide a rating for frequency (how often a certain behavior is adopted) and intensity (how strong the behavior is observed).
The rating has been defined according the Likert scale [17] to ensure consistency of feedback. Each behavior contributes to determine a score associated to the dimension where it belongs, whose weight – as summarized in Table 1 – is used to calculate the overall Shingo score [15]. The score enables the classification according to levels as presented in Table 2, ranging from level #1 – the lowest score, to level #5 which indicates the maximum score and the operational excellence level. Considering the dimension of the target population for the division under study (12000 employees), its global footprint and the consequent challenge to activate the study, it has been considered of outmost importance to understand the minimum set of survey participants required to validate the study. The statistical significance of the survey the sample population has been calculated according the following formula
where N is the target population size e is margin of error and z the z-score [18]. For the case study under discussion the confidence level has been placed at 95% and the margin of error ±2. This lead to a sample size of 2001 employees, as the minimum set of completed surveys required to ensure validity of the analysis. To achieve the reach of such population size, a global communication campaign has been designed involving the top executive roles in email and internal social media communication as depicted in Table 3. Furthermore, the risk of a biased survey due to cross contamination has been mitigated by limiting the time for the survey to 7 days.
Dimension Enterprise Alignment – Vision
Achieving OE requires that an organization aligns every value stream. This starts providing clarity on the organization purpose, where it is going, and how it will get there such that it can enable people to align their actions, innovate, adapt and take risks with greater confidence. The starting point is to generate value for customers, society and the economy with long-term focus from the executive level to provide a foundation of stability [19]. When an organization creates a long-term focus, it is more likely that decisions will in fact pursue safety, quality, delivery and cost rather than just periodical financial targets. In conjunction with taking care of the short- and medium-term priorities, thinking in terms of long term goals significantly reduces the tendencies for knee-jerk reactions to urgent pressures. Organizations working according to the total quality management principles have strategic plans based on vision, mission and objectives [20]. For the case of BHGE, purpose and mission have been defined at corporate level; for the division in the scope of this work we needed the definition of a vision capable to provide an OE long term focus. We decided to engage with the organization›s president to align a OE vision for the organization, that should be based on the concept of risk management, relationship with external providers (customers and suppliers) and daily long-term focus.
Dimension Results - Leadership Workshop
According to the Shingo model great results can only be achieved following the principles that govern the results. The closer an organization emulates ideal behaviors, the closer it can achieve OE – consistently delivering ideal results to all stakeholders. The organization under study has established a solid performance measurement system to monitor financial and operational indicators. The attention to behaviors has been mainly focused to those that are the foundations for an environment of inclusion like gender diversity, disability or sexual orientation [21], opening the opportunity to extend the focus also to the ideal behaviors of the Shingo model. Expanding this approach to promote ideal behaviors on the whole dimensions spectrum can be effectively done by transformational leaders capable to inspire, energize and intellectually stimulate the employees [21]. Past literature shows that transformational leadership can be stimulated by opportune training [22]. A transformational leadership workshop has been designed to engage the senior leadership on the critical role played by the organizational culture to achieve OE, share the OE vision (as earlier defined) and promote the ideal behaviors (already used for the survey). The workshop has been defined to target the c-suite of the organization and two layers below (~250 employees). The workshop has been designed as an interactive fullday in-class experience with group exercises, knowledge sharing session and simulations. For a timely assessment of the initiative effectiveness we decided to evaluate it by surveying the participants with the net promoter score (NPS) [23]. The survey asked the participants if he would recommend to a colleague to participate to the workshop using a rating with a (0 – 10) scale which enables to identify detractors (0 - 6), neutrals (7 - 8) and promoters (9 – 10). The overall score is calculated a
where P is the total number of promoters, D the total number of detractors and N the total numbers of survey received.
Dimension Continual Improvement - NO defect passed forward
The history of the Toyota Production System shows how Taiichi Ohno visiting the most efficient Ford plant in Detroit in the 50s was surprised by the approach to keep the line running continuously at the cost to pass on any defect that might have been generated, counting on the inspection at the following level to avoid the issue propagation [24]. The practice of passing defects forward, not only impacted the cost to rectify the issue (which is higher as higher is the complexity level of the process step where it is found), it also had a demoralizing effect on employees because it reduced the likelihood of zero defects. This led to the definition of the «andon cord» approach that is to put the manufacturing line «on hold» when a defect is identified until it is rectified or removed from the process [25]. This approach is widely adopted in modern manufacturing organizations [26] and often defined as «stop the line» or «stop the work». With the focus to enhance the dimension of Continual Improvement we decided to expand this approach from the pure operational arena to the whole organization, covering also the traditionally transactional processes. This led to the «No defect passed forward» initiative, aimed to promote with employees the approach to: Ó Assess the incoming work to ensure to have all required inputs prior starting to work Ó Verify and ensure that the completed work is free of defects Ó Never knowingly pass defects to the following operation The project has been discussed with the organization leaders in the OE workshop and it has been coupled with a cultural initiative aimed to foster an open reporting of defects -a prerequisite to ensure the success with in the whole organization. The «No defect passed forward» concept is essential for OE from different points of view. From a leader,s perspective, it requires great courage to stop the process long enough to understand the root cause and take counter-measures that prevent the issues from reoccurring. This often means trading any short-term loss for substantial long-term gain and requires putting in place system to ensure that any result that varies from the standard creates an expectation of immediate action. From the employee perspective, it requires a mindset of ownership and accountability: if standards are clearly defined every employee can discriminate between proper work and defects. Leaders should role-model and create the conditions for employees to ensure that no one would ever knowingly or willingly forward the outcome of their value contribution to someone else if it contained the slightest variation from the standard. This concept feeds the mind-set of continuous improvement and creates the conditions for seeking perfection.
Dimension Cultural Enablers - Quality Network
Cultural Enablers focus on people as the foundation of each organization, aiming to empower and involve everyone. Market competitivity requires to exploit the full potential of every single individual, which is the only organizational asset with a potential infinite capacity to appreciate in value. Excellence can only be achieved when every individual in the organization is able to continuously innovate and improve. The management responsibility is to eliminate the barriers to such innovation. The Shingo model prescribes instilling to the employees the key principles behind the activities they do so that – when they understand the «why», they become empowered to take personal initiative. Managing a team of people who share a deep understanding and commitment to the key concepts and principles is much easier than managing those who are only doing what they are told.
For engaging the whole workforce population, we designed a benchmarking program during which we hosted internationally recognized companies in conference-like sessions open to all employees. The program has been branded as Quality Network, where organizations belonging to different industries share their approaches to OE with focus on selected topics (data analysis, employees training, …). Speakers affiliated with those companies have been invited for a talk on their interpretation of OE culture followed by a question and answer session. It has been demonstrated that benchmarking is an external focus on internal activities, functions and operations that can boost continuous improvement. It is the process of judging a company,s processes or products by comparing them to the world,s best, including those in other industries. Benchmarking is emerging in leading-edge companies as a tool for obtaining the information needed to support continuous improvement and gain competitive advantage [27]. The events have been organized in the division headquarter in the Florence Learning Center auditorium which can host around 250 participants. The engagement of employees also located in different countries requires that the events should broadcasted in live streaming. Considering that the use of instant communication technology enhance the engagement of participants in conference environment [28], [29], we decided to adopt an audience response system to give the chance to each participant (in the venue or online) to actively participate by asking questions [30] and also vote for questions asked by their colleagues in real time. The question and answers session has been then structured such that the host presenter would answer the highest ranked questions in the allotted time.
Results and Discussion
The initiative earlier described have been designed and conducted over the span of 12 months. The survey has been launched in November 2017 and the employees participating to the study have been 3290, well above the threshold required to ensure statistical relevance of the analysis. It is interesting to consider that such survey response would ensure a confidence level of 99% with a margin of error ±2, well above the planned one. Figure 2 represent the regional distribution of the division employees compared with the participants to the survey. The delta between the two sets is ±4% except for the region Europe, where the difference accounts for ~10% in favor of the survey participation. The significant higher participation to the survey in this region can be explained by the higher density of employees, which accounts for more than half of the workforce and enabled a higher cross-engagement in the initiative. Figure 3 shows the final survey score of 77.2% that once compared with data in Table 2 indicates how the selfevaluation placed the organization one level below the OE. Furthermore, splitting the survey participants in people leaders (with at least one direct report) and employees, the latter provided generally higher scores (~5%). Data indicates that this difference is mainly related to Cultural Enabler dimension where people leaders scored in general lower when surveying the engagement of the workforce. This highlighted the need to enhance the employee participation in daily improvements. In term of the Enterprise Alignment dimension we worked on the definition of the OE vision together with the organization,s president. The statement has been released as follows: «Quality is our commitment to eliminate any risk of mistakes by working together and developing the best relationships with our customers and suppliers, every time, every day. Integrity, safety and quality are the essential core pillars of our organization, without which we would not be able to do business». The vision has been presented in January 2018 to the Global Leadership Meeting event, during which all the people leaders in the organization gather every year in Florence, Italy to review the past year business and plan the following year activities. The vision has been then shared with the whole workforce via internal communication channel and the internal social media. The OE workshop has been defined as the main initiative to enhance the Results dimension. It has been conducted with 20% of the target population and the participants perception has been positive with a 73% NPS score. The participating leaders defined and shared a mission statement tailored to their specific scope supporting the OE vision and championed the «No defect passed forward initiative». In term of Cultural Enablers, the Quality Network program has been launched in the summer 2018. The overall events reach has been assessed as 2500 participants (in person or live streaming) during the 6 months of activities. The events have been made available in a streaming platform to maximize the visibility to those located in different time zones or unable to attend due to critical assignment. The participants have been surveyed with NPS and the events scored between 60% and 92%, indicating a growing interest in the working population. The basis of value creation and success of organizations depends on the leverage of knowledge available internally therefore corporate portals present the potential of providing organizations with a rich and complex shared information workspace for the generation, exchange, and use of knowledge [31]. A portal has been developed to share information with the employees and support all the initiatives presented in this work: it has been used as reference to provide information to the OE survey, to support the OE vision communication and the «no defects passed forward» campaign, and as point of contact for the Quality Network program. The effectiveness of the portal has been evaluated using Google analytics as conventional web reporting system [32]. For the portal 64 pages have been created and it got 5344 unique views in its first 6 months with an average spent time on page of 2:38 minutes.
Conclusions
This work presents a novel approach to nurture Operational Excellence in the Oil and Gas industry, based on the adoption of the Shingo model and its progressive integration in the organization from the senior leadership down to the operative levels. An assessment that uses such model as reference can be used to identify areas of improvement, once ensured the compatibility of the model with existing organization culture. The initiatives presented in this paper span from top-down programs like the workshop dedicated to the senior leadership, to bottom-up projects like the Quality Network benchmarking program aimed to engage each employee in the operative layers. The preliminary results are very promising such that in the coming months, the initiatives drafted in the previous paragraphs will be expanded. We recognize that a complete evaluation of the results requires a longer -term observation and the organization leadership is committed to embrace the initiative on such time scale. Over a longer period, we will assess the results to consider the extension of the model to the whole BHGE organization. Enterprises willing to embrace OE initiatives may leverage on this work to optimize their OE efforts. Top executive
sponsorship and support are critical enablers to take advantage of the adoption of the OE model described; conversely limiting the reach to the management without focusing on the whole workforce put at risk any OE initiative.
Acknowledgements
We would also like to show our gratitude for supporting the Quality Network initiative to Antonio Aga Rossi and Rich Leonardi (Amazon), Tommaso Luchetti (FCA), Gianfranco Pozzali (Fincantieri), Alfredo Vitale and Steven Blaker (Leonardo), Alessandra Biagi and Nele Van Isterdael (Lilly), Roberto Cuccodoro (Saipem), Antonio Rendina and Antonio
REFERENCES
1. J. S. Oakland, Total Quality Management and Operational Excellence,
New York, NY: Routledge, 2014. 2.M. Bigelow, «How to achieve operational excellence,» Quality
Progress, vol. 35, no. 10, pp. 70–75, 2002. 3.A. Martinez Lorente, F. Dewhurst and B. Dale, «Total quality management: origins and evolution of the term.,» The TQM Magazine, vol. 10, no. 5, pp. 378–386, 1998. 4.John McCreery; Ethan Phillips; Francesco Cigala, «Operational excellence: The imperative for oil and gas companies,» 25 February 2013. [Online]. Available: https://www.bain.com/insights/ operationalexcellence-the-imperative-for-oil-and-gas-companies/. [Accessed 27
December 2018]. 5.«Operational excellence management system,» Chevron, 2018. [Online]. Available: https:// www.chevron.com/about/operationalexcellence. [Accessed 27 December 2018]. 6.«Operational excellence,» ExxonMobil, [Online]. Available: https:// www.esso.it/en/wholesalefuels/health-safety-and-environment. [Accessed 27 December 2018]. 7. «HSE & Operational Excellence,» Halliburton, 2018. [Online].
Available: https://www.halliburton.com/en-US/ps/solutions/heavy-oil/ environmental-benefits/default.html.[Accessed 27 December 2018]. 8. «Operations Excellence Overview: A Continuous Journey of
Improvement,» DuPont, [Online]. Available:http://www.dupont.com/products-and-services/consultingservices-processtechnologies/articles/operations-excellence-overview. html. [Accessed 28 December 2018]. 9. S. J. Rusev and K. Salonitis, «Operational excellence assessment framework for manufacturing,» in 5th CIRP Global Web Conference
Research and Innovation for Future Production, Patras, Greece, 2016. 10. C. SS, A. JB and H. JI, «The Shingo Prize for operational excellence: rewarding world-class practices,» International Journal of Business
Excellence, vol. 1, no. 4, pp. 418–433, 2008. 11. A. R. Shigeo Shingo, Modern Approaches to Manufacturing
Improvement: The Shingo System, Taylor & Francis, 1990. 12. S. S. Andrew P. Dillon, A Revolution in Manufacturing: The SMED
System, CRC Press, 1985. 13. S. Shingo, Zero Quality Control: Source Inspection and the Poka-
Yoke System, CRC Press, 1986. 14. S. Shingo, Non-Stock Production: The Shingo System for Continuous
Improvement, CRC Press, 1988. 15.«The Shingo Prize for Operational Excellence, Principles of operational excellence & Assessment workbook, version 1.2,» 2011. 16. «Our Culture #We are BHGE,» BHGE, [Online]. Available: https://www.bhge.com/annualreport/our-culture.html. [Accessed 27
December 2018]. 17. R. Likert, «A Technique for the Measurement of Attitudes,» Archives of Psychology, vol. 140, p.1–55, 1932. 18. C. D. Florey, «Sample size for beginners,» The BMJ, vol. 306, no. 6886, p. 1181–1184, 1993. 19. J. K. Liker, The Toyota Way: 14 Management Principles from the World,s Greatest Manufacturer, McGraw-Hill, 2004. 20.S.D. David L. Goetsch, Quality Management for Organizational
Excellence: Introduction to Total Quality Management, Prentice Hall, 2008. Milella (Tetra Pak), Marco Papandrea and Fabio Farinelli (Toyota), Ingrid Fiordaliso Candalino (McCormick). We are also immensely grateful to Fabrizio Cantini (BHGE) who provided invaluable insights and expertise on the development of this research and Michele Serpi (BHGE) for valuable and constructive suggestions during development of this research and for reviewing and correcting the manuscript. Finally, we wish to thank Teresa Borrello (BHGE), Elisabetta Lucarelli (BHGE) and all the BHGE Quality Network volunteers for their active engagement and support of all the initiatives presented in this work.
21.T. Dvir, D. Eden, B. J. Avolio and B. Shamir, «Impact of
Transformational Leadership on Follower Development and
Performance: A Field Experiment,» Academy of Management Journal, vol. 45, no. 4, 2017. 22. B. M. Bass, «From transactional to transformational leadership:
Learning to share the vision,» Organizational Dynamics, vol. 18, no. 3, pp. 19–31, 1990. 23. F. F. Reichheld, «The One Number You Need to Grow,» Harward
Business Review, December 2003. 24. J. P. Womack, D. T. Jones and D. Roos, The machine that changed the world: the story of lean production., Harper Collins, 1991. 25. T. Ohno, Toyota Production System: Beyond Large-Scale Production,
CRC Press, 1988. 26. J. Li and D. E. Blumenfeld, «Quantitative analysis of a transfer production line with Andon,» IIE Transactions, vol. 38, no. 10, pp. 837–846., 2006. 27. Y. K. Dean Elmuti, «An overview of benchmarking process: a tool for continuous improvement and competitive advantage,» Benchmarking for Quality Management & Technology, vol. 4, no. 4, pp. 229–243, 1997. 28. S. Morales, C. Millares, T. Brashears and B. Brenes, «Engaging
Participation in the Instant Communication Era,» in Southern Region
Conference of the American Association for Agricultural Education,
San Antonio, TX, 2016. 29. V. Konkol›ová and J. Paralič, «Active Learning in Data Science
Education,» in 16th International Conference on Emerging eLearning
Technologies and Applications (ICETA), Košice, 2018. 30. «Sli.Do,» sli.do s. r. o., [Online]. Available: https://www.sli.do/. [Accessed 27 December 2018]. 31. H. Benbya, N. A. Belbaly and G. Passiante, «Corporate portal: a tool for knowledge management synchronization,» International Journal of
Information Management, vol. 24, no. 3, pp. 201–220, 2004. 32. B. Clifton, Advanced web metrics with Google Analytics, Indianapolis:
John Wiley & Sons, 2012. 33. A. P. D. Shigeo Shingo, A Study of the Toyota Production System:
From an Industrial Engineering Viewpoint, CRC Press, 1989. 34. Bjoern Ewers, Jean-Christophe Bernardini, «A new era for operations excellence in E&P,» Pipeline Oil & Gas Magazine, 16 August 2018. 35. J. S. Mitchell, Operational Excellence: Journey to Creating Sustainable
Value, John Wiley & Sons, 2015. 36. A. P. D. Shigeo Shingo, A Study of the Toyota Production System:
From an Industrial Engineering Viewpoint, CRC Press, 1989. 37. «Diversity & Inclusion,» BHGE, [Online]. Available: https://www. bhge.com/diversity-inclusion. [Accessed 27 December 2018]. 38. R. D. Miller, J. Raymer, R. Cook and S. Barker, The Shingo model for operational excellence, Logan, Utah, 2013. 39. S. E. Edal and M. v. d. Hoek, «Building a high performance oil & gas business,» Deloitte Oil & Gas Consulting, 2014. 40. C. Laurens and O. Van Der Molen, «This is the time to deliver on upstream operational excellence,» mckinsey, February 2010. [Online].
Available: https://www.mckinsey.com/industries/ oil-and-gas/our-insights/this-is-the-time-to-deliver-on-upstreamoperational-excellence. [Accessed 27 December 2018].
Figure 1—dimensions and guiding principles according the Shingo model
Figure 2—Relationship between TPS population and survey responses
Figure 3—Overall results of the survey and split between people leader and employee results.
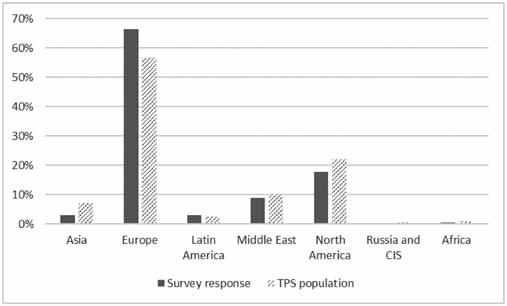
Table 1—Assessment area and score.
Assessment Dimensions
Cultural enablers
Continuous Improvement
Enterprise alignment
Results
#Sampled behaviors
4
9
3
3
Score (weight)
15%
40%
20%
25%
Table 2—Score levels; the level #5 indicates the operational excellence level.
Level
#1 0 – 20%
#2 21% – 40%
#3 41% – 60%
#4 61% – 80%
#5 (OE) 81% – 100%
Score (%)
Table 3—Summary of scheduled communication.
Day Communication Owner
# 1 Survey kick-off. Social media communication to all employees President and CEO
# 2 Communication to all employees Quality Executive
# 3 --
# 4 communication to sub business employees
# 5 -Quality Executive
# 6 last call to all employees
# 7 Survey closure President and CEO


PIMS-Attributes of champion lubricant plants
Introduction
Lubricant manufacturers worldwide are facing a multitude of challenges. Mature markets, volatile raw material prices, tariff changes, difficulty of inventory management, suboptimal productivity, and poor utilization rates of equipment, high downtime and associated production capacity loss, energy inefficiency, high maintenance spend and turnover of critical employees are amongst the growing obstacles for global majors as well as independent players.
There is an increased emphasis on understanding the drivers of performance that show the largest gap to best practice
Some companies have a policy to aim for “best quartile” performance. However, this immediately raises difficulties:
a. What should be the appropriate measure of success? Should operating expenditure be the sole barometer of success, or should losses, labor productivity, asset efficiency and safety performance be considered? b.What comparison sets to use? Should this be a country, a region or a global comparison? Should this be versus global majors, independent players or both?
c. Since labor represents the biggest portion of operating expenditure, and pay rates are location dependent, should pay rates be normalized, since a plant cannot change its location. d.Since complexity is the biggest driver of operating expenditure after labor, and generally intrinsic to a plant has mission, how to correct for differences in that?
e. Since scale of operation is also a key cost driver, should the performance evaluation correct for that?
f. What about other “givens” such as proximity to suppliers, order sizes, lead times, access to Secondary warehouses, etc.
Over the last 25 years, PIMS has provided lubricants and greases manufacturers with concrete recommendations to improve their competitive position based on objective evidence. Based on our research and experience, some plants consistently and substantially outperform their regional
peers. These regional champion plants have a significant cost advantage versus peers, operate substantially below their expected cost thresholds and attain a superior productivity position.
In this paper, we will explore the profile and key attributes of the champion plants that enable them to have the upper hand versus competition. Overview: Americas
In the 20162017- cycle of the PIMS Lubricants and Greases Benchmarking, the average volume of finished lubricants produced by a plant in the Americas region was 77,700 tons. Although the median volume in Latin America has
remained,stable at around 32,000 tons per annum, the North American median has fallen from 92,000 tons in 20102011- to 80,000 tons in 20162017.
The aggregated complexity index2 of 45% for the region is 5 percentage points below the global average. Whilst the median complexity for Latin America sits around 49%, a median complexity of 38% for North America brings down the aggregated average. The median unit cost in Latin America has increased by 8% from20102011 to $67/ton and North America saw a similar increment to $67/ton.
Profile: Champions versus regional peers
The average annual throughput of the champion lubricants manufacturers in Americas is 128,500 tons, whilst other plants in the region (the “peers”)have a significant scale disadvantage with an average throughput of 66,000 tons.
In Figure-1 we see that the product portfolio of thechampions aligns with that of the peers, with motor and hydraulic oil accounting for almost 90% of the portfolio. For the champions, 65% of the volume is produced using an in-line blender and the remaining via automatic batch blending. In contrast, although83% of the peers’ throughput is producedvia in-line blending, the remaining 17% is carried out by manual batch blending.
Despite an almost double annual throughput, the average volume packed by the champion plants is50,300 tons whilst the peers are packing 37,000 annually. This higher proportion of bulk is one aspect that enables the champions to have a less complex operation. Figure 2 below shows the packing distribution of the champions and the peers. Although the large pack (i.e. greater than 10 litres) to small pack (i.e. less than 10 liters) ratio is similar between the two groups, the champion plants are filling less into drums and more into pails and 310- liter packs. It must be noted that kegs and <0.9 litre packs are not prevalent in this region. The average automation index3 for the small pack and large pack filling lines are identical for both groups at 100% and 50% respectively.
So what enables these champion plants to have a competitive advantage versus peers in the region? Productivity and batch sizes:Champions versus the restTable 1 below shows the
productivity (FTE = Full Time Equivalent) of the champion plants versus the peers inAmericas across all core activity areas of the plant.
Figure 1. Showing the product portfolio of the champions and peers in Americas.
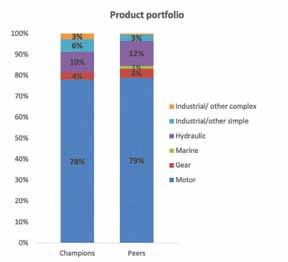
Figure 2. Showing the packing portfolio of the champions and peers in Americas.
Table 1 showing the labour productivity of the Champions and peers across core activity areas of a lubricant manufacturing facility.

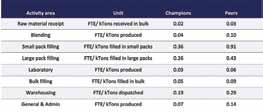
The champion plants in Americas have a better productivity position across the board. In labor-intensive departments such as small pack filling, the champions require 60% fewer people in comparison to the champions, whilst in large pack filling they use 40% fewer. In addition, the inplant general & Administrative operations are significantly more streamlined. In the Americas, 60% of the plant OPEX arises from personnel related costs such as salaries, benefits, social costs, etc. Streamlining this effort enables the champions to gain a competitive advantage versus the peers. Of course, part of the equation is the overall size of the plant – champion Plants fill 36% more in comparison to their peers. However, the differences are such that mere scale effects do not fully explain the advantages the champions manage to have. What is it about the processes of the champions that promote productivity over and above simple scale effects? Figure 3 below shows the average batch size by blending equipment of the champions versus the peers. Although over 80% of the peers’ throughput is produced via in-line blending, their much smaller manual batches drag down their overall average. When evaluated on a product type basis (see Figure 4), champion plants’ batch size for motor and hydraulic oil (which accounts for ~ 90% of the portfolio) is 32% and 13% larger respectively. Despite the larger batches, the average blending time per batch for the champions require approximately 30 minutes less in comparison to peers (2.96 hours per run for the champions versus 3.36 for the peers). The economies of scale in conjunction with faster utilization rates boost productivity in the production department. In the large pack filling department (see Figure 5), the regional peers have a 2.5-ton run size advantage in Drums in comparison to the champions. However, champions fill almost 30% of their throughput into Pails, and here there is a ~3 ton per run advantage versus the regional peers. For less than 10 liter packs (see Figure 6), the average
Figure 3.Showing the batch size by blending equipment.
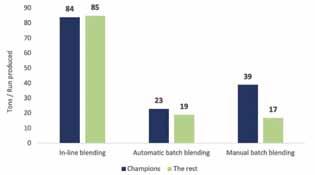
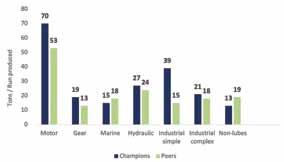
Figure 4. Showing the batch size by product type.

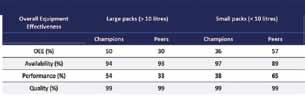
run size for the 3 - 10 liter packs for the champions is more than double the peers. Table 2 above shows the aggregated OEE4 andcomponent scores for the large pack and smallpack filling lines for the champions and the regional peers. The champion plants manage their fillingoperation with fewer unplanned stoppages, are better at managing the planned downtime, andthus outperform their peers on Availability. The utilization rates of the champions (as indicated bythe Performance aspect) for the large packs lines are significantly higher than the peers are, although thereis significant spare capacity for the < 10 liter lines. Thus, bigger batches, higher utilization rates (forlarge pack lines) and well managed downtime boosts productivity in the packaging department. The quality component of OEE is very well managed in Americas. The OEE results indicate that significant investment in newer equipment is beneficial providing the labor productivity improves significantly.
Summary

The champion plants in Americas are exploiting economies of scale by producing and filling the finished lubricants in bigger batches in comparison to their peers. This, in conjunction with better utilization rates, lower complexity and wellmanaged downtime boosts productivity. Ultimately, this streamlinedeffort enables the champions to have a significant competitive advantage versus regional peers. Champions are to the top by being bettermanaged and more aligned with the rest of the supply chain – not by having more or newer equipment. There is a significant time delay between the installation of new equipment and the reaping of the benefits – whichin turn also depends on how well managed the plant is. Champion plants typically invest modestly and focus on few but important goals. This is not the result of magic or coincidence but hard work andProfessionalism.
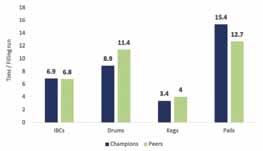
Figure 5. Showing the average run size for large packs (greater than 10 liters)
Figure 6. Showing the average run size for small packs (less than 10 liters).
Table 2. Showing the OEE and component scores for large and small pack lines.