27 minute read
The Fracture Characterization and Fracture Modeling of a Tight Carbonate Reservoir


The Fracture Characterization and Fracture Modeling of a Tight Carbonate Reservoir: The Najmah Sargelu of West Kuwait Part (1)
By
Advertisement
O. Fonta, Beicip-Franlab; H. Al-Ajmi, N.K. Verma, and S. Matar, KOC; V. Divry, BeicipFranlab; and H. Al-Qallaf, KOC
Abstract and for different shalyness. This paper presents Secondly, we used an innovative an innovative solution to deliver an accurate map and promising, of large-scale fractures location. This multidiscipline approach uses concurrently a set of integrated approach that includes selected fracture relevant attributes geology (BHI, cores, wireline logs), in a multi-variable statistical process geophysics (seismic facies analysis), called Seismic Facies Analysis (SFA). and reservoir engineering data A 3D stochastic fracture model was (production data, PLT, welltest) that then generated incorporating the two were combined to identify the main scales of fractures and constrained types of fractures, to predict their by the reservoir shalyness, the S/T occurrence in the reservoir and to ratio and the seismic facies map. The determine the hydraulic properties of calibration of the hydraulic properties the different fractures sets of the fractures was achieved through The Najmah – Sargelu of West Kuwait the second innovation presented in this is an oil bearing reservoir made of paper: the simulation of a synthetic tight carbonates where porosity and well test using the 3D fracture model permeability is mainly provided by and matched with the real data. the fracture network. In this paper, This resulted in the calibration of we will first introduce the method the hydraulic fractures conductivity used to identify and predict the two for each fracture type. These values main scales of fractures: joints and were combined with the 3D stochastic largescale fractures (faults and fracture fracture model to produce 3D swarms). The shale content (Vshale) fracture properties models (porosity, and mechanical beds thickness were permeabilities and block size) for the found to be the two main geological Najmah – Sargelu of West Kuwait. drivers on joints occurrence. Thickness of individual beds were recorded from BHI acoustic images which enabled to measure an S/T ratio (fracture spacing to bed thickness) for each fracture set
Introduction
A detailed geological and hydraulic characterisation of the fracture network occurring within the Upper Jurassic Najmah – Sargelu reservoir of West Kuwait was planned in 2003 - 2004 by Kuwait Oil Company (KSC). The objective of the study was to identify the main geological drivers on natural fractures occurence, to measure their hydraulic properties and eventually using discrete fracture modeling (DFN) approach to compute the equivalent fracture properties (porosity, permeability and block sizes) required for the reservoir simulation. This was achieved through a close integration of geological, geophysical, petrophysical and dynamic data carried out using workflows and methods implemented in a fracture analysis and modeling software (see Ref. 1). The main tasks performed during the project and presented in this paper are the following: ● Fracture analysis from cores ● Fracture analysis from BHI logs ● Integration of 3D seismic data set ● 3D fracture modeling ● Hydraulic characterization of the fracture network ● Computation of the fracture properties in the reservoir grids
Introduction: Background considered as one of the source rocks Properties of AphronThe study area is approx. 2000 Km2 in Kuwait. Aphron were first described by Sebba2 and covers four fields namely A, B, About 50 wells were logged in the as unique microspheres with unusual C and D from North to South, (Fig. Najmah – Sargelu reservoir. Cores properties.1). The structure of the reservoir are available from 21 vertical wells Aphrons are comprised of a spherical is characterized by gentle, rather and BHI acoustic images at 18 wells, core of air and a protective outer elongated anticlines plunging mainly 10 of these had both cores and BHI shell. In contrast to a conventional in the NNE and SSW directions at A, logs available for the study. Matrix air bubble, which is stabilized by a B and D fields. Field C and the west quality is generally very poor, surfactant monolayer, the outer shell branch of field D are NNW – SSE dominated by microporosity (< 8%) of the Aphron is thought to consist oriented. The Top reservoir depth with low permeabilities (< 0.01 md). of a much more robust surfactant triranges between 11,000ft to 12,000ft. Locally, higher matrix porosities layer.4 This tri-layer is envisioned The Najmah – Sargelu reservoir and permeabilities may be found as consisting of an inner surfactant of West Kuwait consists of a tight in the unit V and VI of the Sargelu film enveloped by a viscous water carbonate sequence of Upper Jurassic limestones. Production mostly comes layer; overlaying this is a bi-layer of age deposited in open marine from fracture network in reservoir surfactants that provides rigidity and environment, more proximal in the units II, IIIB, V and VI. low permeability to the structure while South, more distal in the North. imparting some hydrophilic character The general high degree of lateral to it. Although this water-wet nature of continuity and gradual thickness the shell makes it compatible with the changes within the Najmah – Sargelu aqueous bulk fluid, Aphron appear to reservoir suggest that these sediments have little affinity for each other or for were deposited in a ramp setting the mineral suq`1rfaces in the pores of with alternations of clean limestones permeable rocks.defined from logs (Vshale < 30%), Aphron can act as a unique bridging shaly limestones (30% < Vshale < material, forming a micro-environment 60%), and calcareous shales (Vshale in a pore network or fracture that > 60%). behaves in some ways like foam and The isopachs indicate a general gradual in other ways like a solid, yet flexible, thinning of the intervals within the bridging material. As is the case with Najmah – Sargelu from fields C and any bridging material, concentration D in the South (600ft thick) towards and size of the Aphron are critical to fields A and B in the North (300ft the ability of the drilling fluid to seal thick). Traditionally, the reservoir thief zones. Drilling fluid Aphron are was divided on the basis of core constructed by entraining air in the bulk descriptions and wireline logs response fluid with standard drilling fluid mixing into eight main units I, II, IIIA, IIIB, equipment, thus reducing the safety IIIC, IV (Najmah formation) and units concerns and costs associated with V and VI (Sargelu formation), (Fig. highpressure hoses and compressors 2). Reservoir units II, V and VI are commonly utilized in underbalanced massive limestones whereas unit IIIB air or foam drilling.6 Although each is made of thin alternations of shales application is customized to the and limestone beds. Unit V is the individual operator’s needs, the drilling thickest limestone sequence averaging fluid system generally is designed to approx. 130ft. contain between 12 volume % and 15 Reservoir units II and VI has similar volume % air at ambient temperature thickness of nearly 60ft in West and pressure.Kuwait. Other units I, IIIA, IIIC and In contrast to conventional bubbles, IV are non reservoir shaly limestones which do not survive long past a few / calcareous shales with some having hundred psi, Aphrons can survive high organic content and therefore compression to at least 27 MPa (4,000 psig) for significant periods. When bubbles are subjected to a sudden increase in pressure above a few hundred psi, they initially shrink as predicted by Boyle’s Law3. Aphron are no exception. However, conventional bubbles begin to lose air rapidly via diffusion through the bubble membrane, and the air dissolves in the surrounding aqueous medium. Aphrons also lose air, but they do so much more slowly, shrinking at a rate that depends on fluid composition, bubble size, and rate of pressurization and depressurization. One other factor results in a slight reduction in size of the Aphrons shortly after they are created. Several components in the drilling fluid Fracture Analysis from Cores scavenge dissolved oxygen and The objective of the core fracture oxygen within the bubbles, leaving observation was first the definition and each of them with a core that is the logging of the different fracture mainly nitrogen. This reduces Aphron datasets e.g. the identification of the diameter by about 7%, but eliminates natural fractures vs artefact related any concern about corrosion of features. It was also to compare the core tubulars and other hardware. observations with the BHI interpretation. The second part of this task deals with Fluid Dynamicsthe analysis of the core fracture data to The base fluid in Aphron drilling fluids determine whether parameters such as yields a significantly larger pressure lithology, porosity and bed thickness loss (or lower flow rate for a fixed may have an impact on the fracture pressure drop) in long conduits than distribution in the reservoir. any conventional high viscosity We would like to emphasize that the drilling fluid.method adopted in describing fractures Similarly, if flow is restricted or on cores enabled us to differentiate stopped, Aphron drilling fluids generate non tectonic fractures (mainly early significantly lower downstream diagenetic features) from tectonic pressures than other drilling fluids. In fractures, only the latter having a real permeable sands, the same phenomena potential impact on production.are evident. Furthermore, at low to moderate Several terms are of general use in the pressures, Aphrons themselves slow literature to characterize the different the rate of fluid invasion and increase «breaks» in a geological material. the pressure drop across the sands. However, their exact significance Lastly, and most importantly, Aphrons varies according to different authors move more rapidly through the sands and could lead to misunderstanding. than the base fluid. When an Aphron In this study, we made a quantitative drilling fluid is exposed to a pressure description based on objective criteria gradient, a phenomenon called “bubbly such as fracture dimension, geometry, flow” causes the aphrons to move type of surface, type of cement, more rapidly than the base fluid. Just relative chronology, etc. as high-density particles like barite The fracture core description was or drilled cuttings In a loss zone, conducted on about 2800ft of cores Aphron that survive the trip down hole cut from 16 vertical wells. Overall, can migrate faster than the base liquid the core recovery is good with a good and concentrate at the fluid front, coverage of Najmah units I, II, IIIA, thereby building an internal seal in the IIIB, IIIC and IV. Cores in the Sargelu pore network of the rock. A micro-are mostly from top to middle of unit el network formed by particulates in V; unit VI being rarely cored. In the the drilling fluid aids the Aphron in following section, we mainly present slowing the rate of invasion, as does, the different types of natural fractures of course, the radial flow pattern of the whereas artifact related fractures are invasion. As the fluid slows, the very briefly described. Comparison with high LSRV (low-shear-rate viscosity) BHI logs and core logging of the of the base fluid becomes increasingly mechanical bed thickness are also important; this high LSRV, coupled detailled. with low thixotropy, enables the fluid to generate high viscosity rapidly. Bridging and formation of a lowThe main types of fractures in permeability external filter cake also the Najmah-Sargelu occur during the latter part of this Three main types of natural fractures period, ultimately reducing the rate of were observed in the Najmah – Sargelu invasion to that of ordinary fluid loss. reservoir. These are referred to as X, Another key finding is that Aphrons Y (non tectonic fractures) and Z-Type have very little attraction for each other (tectonic) fractures in this study. or for mineral surfaces. Consequently, they do not readily coalesce nor do they stick easily to the pore walls, resulting in easy displacement by the produced X – Type fractures: early diagentic features fluids. In addition, the drilling fluid These features often show preitself is very compatible with produced compactional phenomena and are fluids and generates low capillary obviously of non tectonic origin (Fig. forces, thereby facilitating back-flow 3). Most of them are totally cemented of produced fluids.by calcite and/or filled by dark organic The combination of these two effects matter/bitumen. They always exhibit is expected to result in low formation a low to very low aspect ratio (length/ damage and minimal requirements for width < 10) and low dip values (40° cleanup.to 70°).
These fractures are generally small, Aphron Drilling Fluids technique tortuous in shape with very limited The most dominant characteristics of vertical length in the range of 2cm to Aphron drilling fluids are their 10cm. The early diagenetic features are rheology and the presence of bubbles. very common in the shaly limestones The base fluid is highly shearthinning units I, IIIA, IIIC, IV, and sometimes and exhibits an extra ordinarily high in calcareous shales. These fractures LSRV (Low-Shear-Rate Viscosity) have no direct impact on production. with low thixotropy (flat- gels). The bubbles of air that are dispersed in the base fluid are a dramatic departure Y-Type Fractures: early from conventional fluids, because diagenetic fractures concerns over corrosion and well The early diagenetic fractures are control have traditionally led to another type of early diagenetic attempts to minimize air entrainment. features but their shape is more planar
and more secant than the previous X-Type fractures (Fig. 4). Their vertical extension is also higher (up to 20cm on cores) with a higher aspect ratio (10> length/width < 100) with near vertical dip values. Most of them are totally cemented by calcite. They are rarely partly-open. Their impact on production is very limited. These fractures were probably formed after the XType fractures affecting a material under compaction. They are also quite common in the Najmah-Sargelu reservoir and were mainly found in the shaly limestones and sometimes in the clean tight limestones.
Z-Type fractures: tectonic fractures
The Z-Type fractures of Najmah – Sargelu are joints with a planar and secant surface affecting a compacted rock (Fig. 5). The vertical extension of those fractures is high and typically of 20cm up to 1m on cores. They generally show a very high aspect ratio (length/width > 100) and are near vertical. They are less common on cores than X and Y-Types fractures as the probability of intersecting such vertical fractures in vertical wells is low. Z-Type fractures are frequently partly-open and thus are the most interesting from a production point of view. Indeed, it is highly probable that they are open in the reservoir conditions. From a chronological point of view, the Z-Type fractures were formed after the X-Type and Y-Type fractures. They are mainly found in the clean tight limestones units II, IIIB, V and VI. It may be noted that no fault related fractures were identified in NajmahSargelu cores during the present study.
Other features: artifact related fractures
These are features of dubious geological origin or which are clearly related to some surface phenomenon like core handling or core plugging. Those features were discarded from the previous natural fractures record. Uncemented fractures (Fig. 6) are rather common in carbonate reservoirs. These are breaks without any observable geological criteria. There are no traces of cementation or striations or displacement of the laminations. It is possible that these features are weak planes that may not exist as individual open / conductive planes in sub-surface conditions and the breakage could be related to the coring and the associated stress relaxation. On Fig. 6 the core is so broken that it prevented any reliable fracture logging.
The mechanical bed thickness from core data
The mechanical bed thickness is a property of the rock that has a large influence on the occurrence of joints (Z-Type fractures). Indeed, it is well known that fracture density of joints is higher in thin beds than in thick beds. The close relationship between the occurrence of joints and the bed thickness was noted in several cores of Najmah-Sargelu reservoir and the mechanical bed thickness was thus recorded in the clean limestones units. An example of the influence of the bed thickness is given in Fig. 7. Since the matrix is rarely impregnated, the mechanical bed thickness was recorded considering the lithological changes. The limitation of such approach is obvious and we will show in subsequent section how acoustic images were used to better measure the mechanical bed thickness.
Comparison of BHI logs with core observations
In general, we found a good agreement between core observations and BHI interpretations. It means that BHI interpretation can be used for further fracture analysis and fracture modeling purposes. Several examples of correlation are shown on Fig. 8. X-Type and Y-Type fractures are generally seen on images as discontinuous fractures even when they are large and totally cemented. This is a drawback of the acoustic logs which unfortunately fail to clearly image the cemented part of the fracture. The Z-Type fractures are clearly imaged on BHI logs (Fig. 9). Here also, fractures look like discontinuous on BHI log even if the fractures are continuous on cores. Finally, we made a comparison between the lithology changes (alternations of shaly limestones and clean limestones) and BHI logs. The Fig. 10 shows that acoustic logs are very well adapted to see the individual beds in the reservoir. In other words, this means that we can use the BHI logs in the Najmah – Sargelu to measure the detailed variations of the mechanical bed thickness.
Analysis of the core fracture data
The objective of this task is to relate the different types of natural fractures identified on cores to the stratigraphic, petrophysical and lithologic changes of the rock. We thus tried to quantify the impact of the shale content, the matrix porosity and the mechanical bed thickness on natural fractures occurrence. Eventually, we wanted to descriminate the non tectonic fractures from tectonic fractures, as the latter could have a direct bearing on production.
Impact of the shale content (Vshale)
A statistical analysis of the natural fractures occurrence vs. shale content was then undertaken to quantify the
.ةيعارزلاو
،تلاوحلما ف��لو ةيئابرهكلا تاحوللا عينس�تل ءابرهكلل هلزاع داو��م .3 .ةيئابرهكلا تادلولماو تاكرحلما تاحوللا عينس�تل ه��عاو��نأا��ب برفلا ن��م هعنس�م ءابرهكلل ه��لزا��ع عطق .4 .ةيئابرهكلا تاكرحلما فلو ،ةيئابرهكلا عطاوقلاو .ص�احن حئارس� و ةنرم دليس� كلس�أا نم ةنرم تلس�و .5 .ةيئابرهكلا تادلولماو تاكرحلما ،تلاوحلما فلل AC تافلم و DC تافلم .6 داولما زر��فو ديدلحا عفر تاس�يطانغلم موينمولألاا طئارس� نم تافلم .7 .ةيس�يطانغلما دئاس�ولاو ماحللا تلاومح تافلم اس�يأاو.ةيديدلحا عينس�تل لزعلا عاو��نأا عيمجب موينمولألاا و ص�احنلا نم لوزعم كلس� .8 .ةيئابرهكلا تادلولماو تاكرحلما ،تلاوحلما فلو .قلازنلاا تاقلحو ديحوتلا وس�ع ةنايس�ب ةس�اخ راجحأاو ددع ،تانيكام .9 .)Slip Ring( قلازنا تاقلحو )Commutator( ديحوتلا ءاس�عأا .10
gamal.mostafa@emtrade-co.com : نيوتركللإا دــيبرلا amr.hamdy@emtrade-co.com www.emtrade-co.com : نيوتركللإا عقولما
impact of shalyness. On the left of Fig. 11, we computed the histograms of the shale content for X-Type, Y-Type, and Z-type fractures. Fracture length histograms are also indicated on the right. One can see that X-Type and Y-Type fractures are short fractures mainly found in rocks where Vshale is very high and obviously higher than 30 %. On the contrary, most of the ZType fractures are longer and found in clean limestones for which Vshale is lower than 30%. A cut-off value can thus be applied to the Vsh logs which allow identifying and sorting the tectonic fracture (Z-Type) from the non tectonic fractures (X-Type and Y-Type): ● Tectonic fractures (joints) when
Vshale <= 30% ● Non tectonic fractures when
Vshale > 30% These cut-off values were also applied to the fractures interpreted on the BHI logs. It may be noted that it was not possible to discriminate between X-Type and Y-Type fractures based of the Vshale. Indeed, the Vshale values are too close for these two types of fractures to allow a proper distinction.
Impact of mechanical bed thickness
First of all, only Z-Type fractures were analysed. We also worked in the unit V being the main clean limestone unit in the Najmah – Sargelu reservoir. From cores, one can observe that fracture densities are higher in thin beds than in thick beds. In unit V, an overall trend of thin fractured beds is even noted at the top whereas thick beds are less fractured toward the middle of that unit (Fig. 12). The relatively poor core sampling of that unit however prevented us to quantify the mechanical bed thickness to fracture density correlation which will be addressed using BHI logs.
Matrix porosity
The average matrix porosity in the clean limestones reservoir units II, IIIB, V and VI where joints were noted on cores is very low (less 5%) with no big contrast of porosity. Therefore, comparison of porosity log with natural fractures recorded on cores did not show any correlation. Consequently, matrix porosity was not considered as a geological driver on natural fracture occurrence in the Najmah – Sargelu reservoir of West Kuwait.
Fracture Analysis from BHI Data
This section is dedicated to the statistical analysis of the natural fractures interpreted from BHI logs in the Najmah – Sargelu reservoir – West Kuwait. It aims first at the definition of the main fractures sets and secondly at the analysis of the different types (e.g. different scales) of tectonic fractures. This work was performed based on BHI interpretation available at 18 wells most of them being vertical.
Fracture sets definition
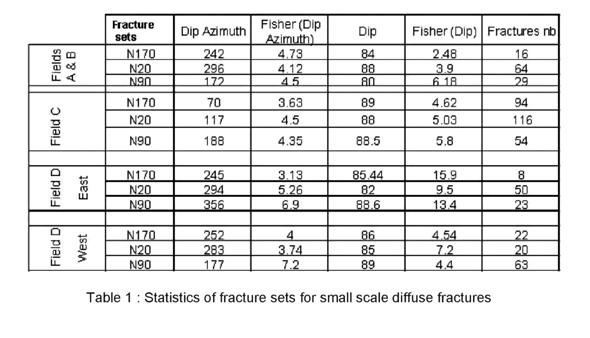
Among the total number of 953 fractures interpreted on the BHI logs, 767 fractures were identified as tectonic fractures using the 30% cut-off on Vshale as previously determined. The relative low number of non tectonic fractures compared to the very large number of those features seen on cores is related to their very low lateral and vertical physical extent within the rock and/or due to lack of resolution in acoustic image logs. Consequently, these features are very hard to pick on the images. 3 sets of tectonic fractures were thus determined: ● N170E (331 fractures), Fisher strike is 7.3
● N020E (270 fractures), Fisher strike is 11 ● N090E (166 fractures), Fisher strike is 6.2 Statistics on these 3 fracture sets are presented on table 1. The Fisher coefficient which shows the dispersion of the current value is high meaning that the fracture sets are well constrained. The fracture orientations are also consistent with the main structural directions of West Kuwait: N20E is the direction of the structural axis on fields A, B and east of field D. N170E is the direction of the structural axis in field C and the west branch of field D.
Fracture types definition
The observation of fractures from cores showed that tectonic fractures in the Najmah – Sargelu reservoir are subvertical joints also known as small scale diffuse fractures. Other tectonic fractures (large scale fractures) such as fractures swarms and fault related fractures are also expected in the reservoir. The lateral and vertical physical extents of those two types of tectonic fractures are different. The diffuse fractures are generally of metric to decametric scale whereas the large scale fractures could extend to several hundred meters or more. Their hydraulic characteristics are also expected to be different. It is therefore essential to give due considerations to these two types of tectonic fractures in any fracture modeling approach.
Methodology
The detailed analysis of the fracture density logs computed in the different wells showed that the fracture density is not homogenous with depth. There are peaks on the fracture density logs corresponding to more fractured intervals (Fig. 13). These peaks are named “clusters” in
the following text and were individually analysed to differentiate small scale fractures from large scale fractures.
Small scale diffuse fractures characterisation
On Fig. 13, the selected cluster of fractures appears in red in the logs and on the Schmidt diagram. Selected fractures are characterized by high dip and very high dip-azimuth spreading. This means that there are several fracture families at the same depth. This is a typical signature of diffuse fractures. Further the diffuse fractures which are found in clean limestone layers were analysed and the different sets characterised by specific dips and dip-azimuth values. However, the density of diffuse fractures and its variations in the reservoir still must be addressed. The impact of lithology was partly addressed through cut-offs on Vshale. The quantification of the influence of mechanical bed thickness on diffuse fracture density using BHI logs is presented here below.
Logging of individual mechanical beds
The individual mechanical bed distribution was manually recorded from the acoustic images. One example of record is given on Fig. 14 taken from unit V. Beds are individualised on acoustic images by thin shaly interbeds. The thickness of each bed was systematically recorded for the different limestone units II, V and VI. It may be worth mentioning here that this novel application of acoustic images enabled us to record individual beds for which vertical profiles were generated and analysed to understand its bearing on fracturing.
Definition of fractured layers
The shape of the fracture density logs computed for diffuse fractures shows a typical pattern which enables to define different fractured layers in the clean limestones of the Najmah – Sargelu reservoir. In unit V for instance (Fig. 15), the diffuse fractures density is high at the top and at the bottom whereas it is almost zero in the middle of unit V. This trend was already observed on cores and matches very well with the overall vertical variations of the mechanical bed profile recorded from acoustic images (Fig. 15). Three fractured layers were thus defined in unit V, two layers in unit VI and one single layer in units II and IIIB. Averages of bed thickness and diffuse fracture density were computed in each fracture layer.
S/T ratio measurement
Fig. 16 shows the crossplot between the fracture spacing (= 1/fracture density) and the average bed thickness as measured from wells. It shows a very clear linear relationship between fracture density and bed thickness: the thicker the beds, the higher the fracture spacing.. Therefore, this representation allows to measure an S/T ratio with the slope of the linear relation, where S = spacing in meters and T = bed thickness in meters. One can see that some points plot away from the points falling on the linear trend. The fracture density for these outliers is lower compared to the other points with the same bed thickness. This phenomenom was analysed in a similar crossplot (Fig. 16), where the size of the bubble corresponds to the average Vshale of the fractured layer where the measurement was obtained. One can see that all points plotting away from the linear relation have a high Vshale ranging from 15% to 30% compared to the other points. This explains why for the same bed thickness these points have a lower fracture density and consequently higher fracture spacing. Thus, the determination of the S/T ratios that relate the fracture spacing with the bed thickness takes into also account the shalyness of the reservoir: ● S/T = 0.6 where Vshale < 15% ● S/T = 1 where 15 % < Vshale < 30% We would like to stress here that the measurement of the S/T ratio from real sub-surface data as presented in this study is quite unique outcome achieved through innovative application, analysis & integration of data. Indeed, most of published S/T measurements mainly come from field observations and / or numerical models (see ref. 2).
Large scale fractures characterisation
When selected on the fracture density log, some other clusters of fractures did not show this kind of spreading of the fracture strike. On the contrary, fractures remain parallel together in a highly fractured interval. The examples of this type of fractures from two wells is presented in Fig. 17. These fractures correspond to large-scale fractures related to fracture swarms and/or to faults. Statistics on dip and dip-azimtuh values were produced for the three large scale fracture sets as follows ● N170E (212 fractures), Fisher strike is 10. ● N020E (105 fractures), Fisher strike is 8. ● N090E, (62 fractures), Fisher strike is 12. It worth noting that the directions of large scale fractures are similar to those of the small scale diffuse fracture as previously identified. In conclusion, the detailed analysis of the BHI logs enabled to properly characterize the different sets and different scales of tectonic fractures in the Najmah – Sargelu reservoir:
● The vertical variations of the diffuse fracture density in the reservoir have been correlated to the distribution of the bed thickness and quantified through the measurement of S/T ratio.
The lateral variation of the diffuse fracture density can easily controlled in the fracture model using maps of Vshale. ● Large scale fractures distribution cannot be simply inferred from well data. However, due to their very large extent, these large scale fractures often associated with fracture swarms and sub-seismic faults, may be located in the reservoir using 3D seismic data.
REFERENCES
1. B.J. Bourbiaux, Rémy Basquet, M.C. Cacas, and J.M. Daniel, Institut Français du Petrole, and Sylvain Sarda : “An Integrated
Workflow to Account for Multi-Scale Fractures in Reservoir Simulation Models: Implementation and Benefits ”, paper SPE 78489 presented at the 10th Abu Dhabi International Petroleum Exhibition and Conference. 2. Taixu Bai, David D. Pollard, Stanford University: “Closely spaced fractures in layered rocks: initiation mechanism and propagation kinematics”. Journal of Structural Geology 22 (2000), 1409 - 1425. 3. Gérard Bloch, Maged El Deeb, Hussein Badaam, ADCO, UAE, Frédéric Cailly, Gael lecante, Olivier Fonta, Antoine Meunier,
Beicip-Franlab, France “Seismic Facies Analysis for fracture detection: a powerful technique”, paper SPE 81526 presented at the
SPE 13th Middle East Oil Show & Conference, Bahrein 58- April 2003. 4. Stephan Bergbauer, Tapan Mukerji, and Peter Hennings: “Improving curvature analyses of horizons using scaledependent filtering techniques”, AAPG Bulletin, V. 87, No. 8 (August 2003), PP. 1255 – 1272. 5. B.J. Bourbiaux, SPE, M.C. Cacas, S. Sarda, J.C. Sabathier, Institut Français du Petrole : “A Fast and Efficient Methodology to
Convert Fractured Reservoirs Images Into a Dual-Porosity Model”, paper SPE 38907 presented at the 1997 SPE Annual Technical
Conference & Exhibition, San Antonio, Texas, 58- October 1997. 6. S. Sarda, L. Jeannin, and B.J. Bourbiaux, SPE, Institut Français du Petrole : “Hydraulic Characterisation of Fractured Reservoirs:
Simulation on Discrete Fracture Models”, paper SPE 66398 presented at the SPE Reservoir Simulation Symposium, Houston,
Texas, 1114- February 2001.
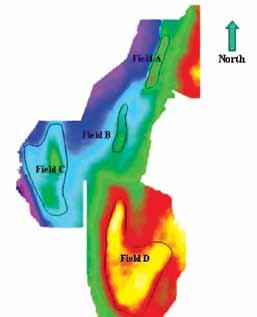
Fig. 1 : Top Najmah depth map (West Fig. 2 : Lithostratigraphic column of the Najmah – Sargelu in West Kuwait

Fig. 3: X-Type fractures (early diagenetic features)
Fig. 4: Y-Type fractures (early diagenetic fractures) Fig. 5 : Z-Type tectonic fractures (joints)
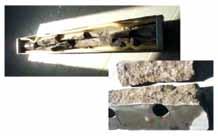
Fig. 6 : Uncemented fractures of dubious geological origin Fig. 7 : Mechanical bed thickness logging using lithological changes on cores
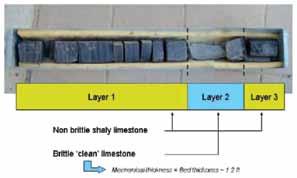
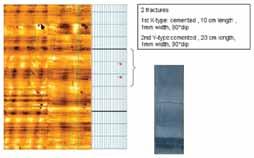
Fig. 8 : Comparison of X and Y-Types fractures with BHI logs Fig. 9 : Comparison of Z-Types tectonic fractures with BHI logs
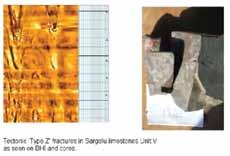
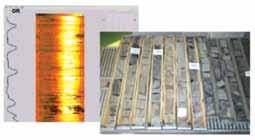
Fig. 10 : Alternances of shaly limestones (dark beds) and tight limestones (white beds) in unit IIIB as seen on BHI logs
Fig. 11 : Histograms of shale content and fracture legnth for each fracture type
Fig. 12 : Impact of mechanical bed thickness on fracture distribution as recorded on cores. From left to right : measured depth (ft), gamma ray, DT, Vshale, all fractures, tectonic fractures only, log of mechanical beds and core quality.
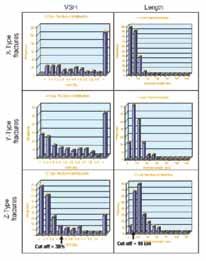
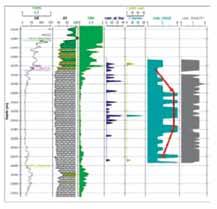
Fig. 14 : Exeample of individual beds logging in the Najmah- Sargelu using acoustic images
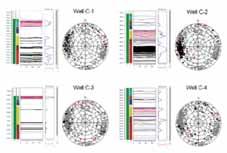
Fig. 13 : Identification of diffuse fractures from BHI logs
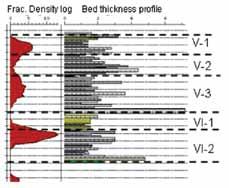
Fig.15 : Correlation between fracture density and bed thickness as measured from BHI logs Fig. 16 : Fracture spacing to bed thickness relationship. Bubble size is proportional to the rock shalyness.
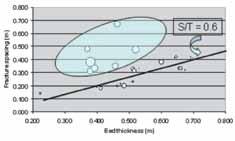
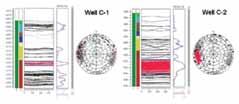
Fig.17 : Definition of large scale fractures from BHI logs analysis
Table 1 : Statistics of fracture sets for small scale diffuse fractures