23 minute read
Calculation of Porosity by Combiningthe Nuclear Magnetic Resonance And Soniclogs In Gas Bearing Reservoir, At Sienna Fieldof West Delta


Calculation of Porosity by Combiningthe Nuclear Magnetic Resonance And Soniclogs In Gas Bearing Reservoir, At Sienna Fieldof West Delta Deep Marine Concession In Egypt
By
Advertisement
A. Z. NOAH Faculty of Science and Engineering, The American University in Cairo, Egypt. E-mail: ahmednoah@aucegypt.edu
Abstract example, in this paper, of conventional The estimated porosity gas-bearing reservoir(Sienna Field) may be inaccurate verifies that this technique is usable not when calculated from only in tight gas sandstones, but also in conventional logs and any gas-bearing reservoirs. also underestimated when derived Through analysis, it is a fact that NMR from nuclear magnetic resonance tools are more accurate and more (NMR) logs due to the effect of the applicable than other conventional lower hydrogen index of natural gas tools. InterPetrophysics© by in gas-bearing sandstones. Proceeding Schlumberger is the software used in from the basic principle of NMR log interpretation. and the results obtained from a physical rock volume model constructed on the basis of interval transit time logs, a technique of calculating porosity by combining the NMR log with the conventional interval transit time log is proposed. For wells with the NMR log acquired from the MRIL-C tool, this technique is reliable for evaluating the effect of natural gas and obtaining accurate porosity in any borehole. The NMR porosity should be first corrected by using the deep lateral resistivity login wells with NMR log acquired from the CMR-Plus tool and with collapsed borehole. Two field examplesof tight gas sandstonesin the studied concession, illustrate that the porosity calculated by using this technique matches the core analyzed results very well. Another field
I. INTRODUCTION
Porosity is one of the most important input parameters in reservoir evaluation, so it is critical to accurately estimate this parameter in any reservoir especially in tight gas sandstones. Porosity can be calculated from conventional logsin oil-bearing or water saturated layers, but it may be overestimated or underestimated when calculated from these logs (such as density log, neutron log and acoustic log) in gas-bearing formations because of the effects of the lower hydrogen index of natural gas. For the same reason, the porosity directly obtained from NMR logs may be underestimated too. In order to evaluate the effects of natural gas on the conventional and NMR logging results, it is essential to calculate porosity with greater precision, by integrating density with NMR logs. However, the curves of density and NMR logs, especially the NMR log acquired from the CMR-Plus tool, are distorted if the borehole is collapsed.
II. OIL and GAS in EGYPT
The hydrocarbon reservoirs in Egypt are located in three main areas; the Gulf of Suez in the Red Sea, the Western Desert and the Mediterranean Sea. Gas was lately discovered in the Mediterranean with economic quantities. Several major oil companies (Agip, BP Amoco, B.Gas, GEOGE) have explored the Mediterranean and made good discoveries. The area of interest lies offshore in the West Delta Deep Marine concession. The study is applied on the interval (76148738- ft.) of Pliocene Formationof Sienna Field. Rashid Petroleum Company (JV comprising EGPC and BG Egypt / Edison International) has recently achieved good results in the Mediterranean West Delta Deep Marine (WDDM) concession. The gas discoveries in this highly prospective block used the 3D seismic data and the direct hydrocarbon indicators (DHIs)
such as bright spots, flat spots and AVO low, formation damage was anomalies. The gas bearing formations largely ignored and emphasis was has been discovered in the Pliocene placed on minimizing costs rather sands. Recent exploration activity has than maximizing productivity by focused on the Pliocene slope-channel minimizing the formation damage. complex play with 6 exploration discovery wells drilled in WDDM Usually, completion operations within the last two years. These include are performed under an overbalanced the Scarab/Saffron, Simian, Sienna pressure. This operation leads to an and Sapphire discoveries (Xiao et al., excessive invasions of some of the 2012). wellbore fluids into the formation Now, it is important to note that the pore space. These fluids are foreign success stories of exploration in liquids, salts, chemicals, and some the Western Desert summarize the solids. Economides [2] indicated application of advanced and updated that the depth of filtrate invasion technology. either while completion or workover operations may reach to about 15ft and return oil permeability may III. NMR PHYSICS decrease to any value between 0% The physics of pulsed NMR has been and 100% of its original value. known since 1950. It has been used However, Krueger [3] observed in extensively in industrial and medical his study that such damage usually applications. It is a complex and reaches to a depth from 0.3 to 1.0 ft innovative new technology, but it is depending on the type of filtrate and easy to understand. NMR logging rock materials. works by forcing the Hydrogen nuclei of the formation fluids into a spin, and Some portion of the permeability then monitoring the rate and the way in can be restored when production which they recover stability (Cannon et resumes. Based on Azari and al., 1998, Xiao et al., 2012). Leimkukler[4] study, about 6083%The Combinable Magnetic Resonance of permeability may be restored in (CMR)* tool is a pad-type tool that damaged cores that have lost 98% performs pulsed NMR measurements of their permeability owing to fresh using Carr - Purcell - Meiboom - Gill water dispersion by re-exposure to (CPMG)pulse sequences. The spin NaCl brines. – echo signals acquired during the measurement are derived from protons Nearly all formations of interest (i.e. Hydrogen nuclei) that process in to the oil industry contains clay the static magnetic field by a permanent minerals. Liu and Civan [5] defined magnet in the tool antenna (Mohamed four major types of clay minerals; N. et al. 2001). kaolinite, smectite (montmorillinite), illite, and chlorite. Each type exhibits particular problem concerning A CPMG consists of two time formation damage. Serious intervals: permeability reductions can occur 1. An initial wait time (WT) during when clays obstruct flow by either which the proton magnetization expanding “swelling» to fill pore approaches its thermal equilibrium spaces or entraining with the flow value in the static magnetic field. streams and blocking the pore throats. 2. Echo collection period during Serious permeability reductions can which a set of Radio Frequency occur due to those two factors. In (RF) pulses generated by the tool details, Kaolinite exhibits little or no antenna are used to generate the swelling characteristics. However, Zaiton and Berton [10] proved spin echoes. smectite and mixed-layer clays have experimentally that montmorillonite The tool antenna has a uniform high potentials for swelling. Illite can clay of 5% dispersed in a sandpack response over its 6 inches length, swell when it co-exists with smectite. is more stable in the presence of KCl which accounts for the high vertical than NaCl brines. They also measured resolution of the CMR measurements. Allen et al. [1] and Reed [6] the critical salt concentration (CSC) The CMR response has a blind zone showed that structural expansion values for KCl and NaCl and found as of approximately 12/ inch, which occurs when additional water is 5000 and 27,500 PPM respectively. provides immunity to mud cake and adsorbed between clay layers. moderate bore holerugosity effects. The Montmorillinite under reservoir Apparent formation damage measured integrated radial response salinity conditions has two or three can also be due to an increase in of the CMR tool shows that 90 % of layers of water between interlayer the water saturation around the the signal is derived from within 1.2 surfaces. This gives basal spacing wellbore, resulting in a reduction of inches of the bore hole wall (Mohamed of 15 to 18oA. If the formation the permeability to oil or gas. This N. et al. 2001, Kenyon, 1997). brine is diluted with fresh or brine, effect called a “water block” [1, 11], The CMR perform the following measurements: additional water is adsorbed between these layers until the basal spacing is perhaps becomes 30 oA or more. or named as “water sensitivity” based on vaidya and Fogler [12] study. 1. Total NMR hydrogen signal Therefore, the increased clay volume amplitude, which is used to derive may consume a very significant the total porosity. fraction of the flow channel. 2. The distribution of the NMR hydrogen relaxation, which is used Based on experimental works of to derive the pore size distribution.Mongenthaler [7], which indicated that unfavorable interactions with IV.NMR POROSITY formation waters are the major potential cause of formation damage The fact that NMR porosity with heavy brines in the sandstone depends only on thefluids content cores. of the formation, unlike densityand neutronporosity, which is influenced Nowak and Krueger [8] proved that by both fluids andsurrounding rocks, the saline filtrates causes less trouble makes NMR measurements muchmore and may, in fact, reduce particle size capable than conventional logs to and increase oil permeability in some furnish claycorrected,nonproductive cases. In addition, it was shown in and productive porosities.The strength their tests that polyvalent salts, such of the NMR signal is proportional tothe as CaCl2 and Al2Cl3 did not damage number of hydrogen atoms in NMR permeability as much as NaCl tool-dependentrock volume. In zones solutions. To explain the overall containing light hydrocarbon,where the increase of permeability gained after hydrogen index is less than unity,NMR flooding with some killing fluids. porosity will typically underestimate Gatlin [9] attributed this phenomenon trueporosity in proportion to the to ionic exchanges. Sodium ions are hydrogen index. In thisformation, initially present to neutralize the there is a separation between density surface charge of the individual clay andneutron porosity, which indicates particles. When brought into contact light hydrocarbon (Dunn et al. 2002).with the CaCl2 filtrate, some of Na+ For oil and water, NMR results can were replaced by Ca++ in the ratio of be expressed asthe percentage of two sodium ions for one calcium ion; fluid volume of the rock volume. this exchange results in shrinkage of The number of hydrogen atoms in clay particle, leading to restore or gas dependsstrongly on temperature may increase oil permeability. and pressure. Hence, it isimportant to estimate the pressure and temperatureaccurately to account for their effect on NMR resultsin natural gas reservoirs (Hassoun and Zainalabedin,1997; Hamada et al., 1999; Coates et al., 1998). In the literature, there has been some confusion indefining and using the results of NMR porosity data.To clear out this confusion, Fig. (1)shows the standardrock porosity model. MSIG denotes the totalwater content porosity. MPHI is the total porosityfrom NMR (fluid fractions of the rock excluding solids fluids).Fig. (2) exhibits uploaded data through interactive petrophysics software. The target interval investigated is Several authors [5, 10, 13, 14] tight gas sandstones. The density log indicated that formation damage is seriously affected by the borehole, could be caused by changes in the because more than 95% of the fluids themselves rather than a change boreholes have collapsed due to the in the permeability of the rock. The undercompaction. The NMR logs (Fig. damage caused by fluids is due to a 3), in 82% of wells, were acquired with change in the apparent viscosity of the MRIL-C tool and good measured the oil phase and/or to a change in its results were obtained. In other 9.5% of relative permeability. These types of wells, NMR logs were acquired with the damage are considered as temporary CMRPlus tool. Therefore, the density damage, and can be reomoved by back logs in 82% of wells and NMR logs flow while production theoretically. in 9.5% wells were distorted and the However, such removal is sometimes relationships between the density and difficult. The formation of waterthe core porosity and between the NMR in-oil emulsion in the reservoir porosity obtained from the CMR-Plus rock around the wellbore can cause tool and the core porosity are unsound. damage as well, because the apparent Figs. (4 and 5) illustrate a cross plot viscosity of the emulsion may be between core porosity and both of NMR more than an order or magnitude and acoustic porosity.To avoid the effect higher than that of the oil. of collapsed borehole on the calculated porosity, the interval transit time log 2. Experimental Setup was used for porosity calculation. Laboratory tests were designed to simulate fluid flow conditions In this paper, a technique of combining near the wellbore in order to the interval transit time with NMR logs study the effect of killing fluid to calculate porosity in gas bearing compositions on formation damage. sandstones is proposed. This technique The permeameter used in this study can be used to correct the effect of has the ability to work as a constant natural gas and provide accurate porosity differential pressure or a constant in gas bearing formation. A method is flow rate instrument. Even though also introduced to correct the effect of constant differential pressure collapsed borehole on the NMR log simulate the real well conditions, acquired with the CMR-Plus tool. therefore, it was decided to use the
V. POROSITY ESTIMATION IN GAS-BEARING FORMATION
V.1.Method of Calculating Porosity from NMR Log
Based on the principle of NMR logging, the equation of calculating porosity from NMR log can be expressed as follows(Xiao 2012, Coates et al. 2000): CMRP = Φ * Sg * HIg + Φ * HIf(1Sg) = Φ[Sg * HIg * Pg + HIf(1Sg)]……….(1) Where:Pg = 1-exp[-(Tw/Tl,g)] CMRP is the NMR porosity (in %), that can be acquired from NMR log directly;Φis the formation’s porosity (in %); Sgis the gas saturation in fraction;HIgis the hydrogen index of natural gas, HIfis hydrogen index of porefluid (the units are fractions); Pgis the polarization factor; Twis the polarization time, Tl,gis the longitudinal relaxation time of natural gas (the units are microseconds). For fully water-saturated rocks, HIfis taken to be 1.0, and Eq.(1) can be rewritten as(Xiao 1998, Coates et al. 2000): CMRP/Φ = 1-Sg(1 - Ig * vPg)… (2) The porosity must be calculated first to obtain information about Sg. V.2. Method of Calculating Porosity from an Interval Transit Time Log The sonic log is commonly used to calculate the porosity of formations; however the velocity of elastic waves through a given lithology is a function of porosity. Wyllie proposed a simple mixing equation to describe this behavior and called it the time average equation. It can be written in terms of velocity or ∆t (Xiao et al., 2012). Based on the principle of the volume physical model of gas-bearing sandstone, the response equation of interval transit time log can be expressed as (Yong et al. 1996, Raiga et al. 1988): Δt = Δtmat (1-Φ) + Δtf* Φ(1-Sg ) + Δtg* Φ * Sg .. (3) Where: Δtis the log measured interval transit time, Δtmatis the interval transit time of rock matrix, Δtfis the interval transit time of water; Δtgis the interval transit time of natural gas (the units are μs/m). At present, Wyllie’s average time equation is always used for porosity calculation from interval transit time log and it can be written as (Wyllie etal. 1956 and Chu et al. 2007). Φs = (Δt - Δtmat) / (Δtf - Δtmat)… (4) Where:Φs is the porosity estimated from the acoustic log in fraction; Δtfis the interval transit time of pore fluid. Equation (5) illustrates thatSgandΔtfare two important input parameters in calculating porosity from the interval transit time log. However, the determination of Sgrelies on porosity. It is difficult to calculate porosity from the conventional interval transit time logs alone (Mao et al., 2010). Φs / Φ = 1 + Sg * [(Δt - Δtmat) / (Δtf - Δtmat)].. (5)
V.3. Method of Calculating Porosity by Integrating Conventional Interval Transit Time with NMR Logs
Due to the effect of the lower hydrogen index of natural gas in gas-bearing sandstones, proceeding from the basic principle of NMR log and the results obtained from a physical rock volume model constructed on the basis of interval transit time logs, a technique of calculating porosity by combining the NMR log with the conventional interval transit time log is proposed. For wells with the NMR log acquired from the MRIL-C tool, this technique is reliable for evaluating the effect of natural gas and obtaining accurate porosity in any borehole. This technique is also suitable for collapsed borehole (Cao Minh et al., 1998). Xiao et al., (2012) assumed two values of x and y, where: X = [(Δt - Δtmat) / (Δtf - Δtmat) and Y = 1 – (Hg * Pg) By substituting these two parameters (X and Y) into Eqs. (5) and (2) separately, we obtain the following two expressions: Φs/Φ = 1 + (Sg. X)…. (6) CMRP/Φ = 1 – (Sg. Y)… (7) Then from equations (6 and 7) the following equation is obtained Φ = (Y/(X+Y))* Φs + CMRP (X (X+Y)).. (8) By assuming that A= y/(x+Y) and B= X (X+Y) the following equation is deduced: Φ = A*Φs + B* CMRP ... (9) Where A + B = 1 The advantage of this technique is that porosity can be estimated without the parameters Sg, HIfandPg. Fig. (6) shows that there is a good relation between core porosities and the estimated porosity from NMR combined tool. The values of A and B can be ensured by deriving them from core samples andwell logging data.Generally, core porosities are considered to be the accurate porosity ofthe formation. By substituting core porosities into Eq. (9), and dividing byCMRPon both sides, we obtain the following expression (Xiao et al., 2012): ΦC/CMRP = A (Φs/CMRP) + B… (10) If Φs/CMRP is plotted in the horizontal axis and ΦC/CMRP in the vertical axis, the linear regression method is used and the values of A and B can be determined as follow:
Φ = 0.6449 Φs + 0.0936 CMRP The porosity must be calculated first to obtain information about Sg. V.2. Method of Calculating Porosity from an Interval Transit Time Log The sonic log is commonly used to calculate the porosity of formations; however the velocity of elastic waves through a given lithology is a function
CMRDI Linear Swell Linear Swell Meter 2100 Meter 2100
Central Metallurgical R & D Institute (CMRDI) P.O. Box 87 Helwan, Cairo, Egypt T : 01006608673 F : 025010639 www.cmrdi.sci.eg info@cmrdi.sci.eg E : hassan_mervat@yahoo.com
Compaction of shale sample Compacted sample
Measure length with a caliper and weigh the core before and after your test
The LSM software records the measurements and summarizes the results in a real-time graph that shows the percentage of swelling versus time. Carefully pour the drilling fluid into the vessel surrounding the sample and start your test Prepare sample for test
Fann’s Linear Swell Meter is designed to test shale hydration or dehydration. Operators apply the information from this test to predict and correct shale problems encountered during oil well drilling. Having this information helps operators develop a drilling program that minimizes drilling risks and costs associated with shale. The CMRDI has all the equipments for the evaluation of bentonite as drilling fluids.
of porosity. Wyllie proposed a simple mixing equation to describe this behavior and called it the time average equation. It can be written in terms of velocity or ∆t (Xiao et al., 2012). Based on the principle of the volume physical model of gas-bearing sandstone, the response equation of interval transit time log can be expressed as (Yong et al. 1996, Raiga et al. 1988): Δt = Δtmat (1-Φ) + Δtf* Φ(1-Sg ) + Δtg* Φ * Sg ………... (3) Where: Δtis the log measured interval transit time, Δtmatis the interval transit time of rock matrix, Δtfis the interval transit time of water; Δtgis the interval transit time of natural gas (the units are μs/m). At present, Wyllie’s average time equation is always used for porosity calculation from interval transit time log and it can be written as (Wyllie etal. 1956 and Chu et al. 2007). Φs = (Δt - Δtmat) / (Δtf - Δtmat).. (4) Where:Φs is the porosity estimated from the acoustic log in fraction; Δtfis the interval transit time of pore fluid. Equation (5) illustrates thatSgandΔtfare two important input parameters in calculating porosity from the interval transit time log. However, the determination of Sgrelies on porosity. It is difficult to calculate porosity from the conventional interval transit time logs alone (Mao et al., 2010). Φs / Φ = 1 + Sg * [(Δt - Δtmat) / (Δtf - Δtmat)].. (5)
V.3. Method of Calculating Porosity by Integrating Conventional Interval Transit Time with NMR Logs
Due to the effect of the lower hydrogen index of natural gas in gas-bearing sandstones, proceeding from the basic principle of NMR log and the results obtained from a physical rock volume model constructed on the basis of interval transit time logs, a technique of calculating porosity by combining the NMR log with the conventional interval transit time log is proposed. For wells with the NMR log acquired from the MRIL-C tool, this technique is reliable for evaluating the effect of natural gas and obtaining accurate porosity in any borehole. This technique is also suitable for collapsed borehole (Cao Minh et al., 1998). Xiao et al., (2012) assumed two values of x and y, where: X = [(Δt - Δtmat) / (Δtf - Δtmat) and Y = 1 – (Hg * Pg) By substituting these two parameters (X and Y) into Eqs. (5) and (2) separately, we obtain the following two expressions: Φs/Φ = 1 + (Sg. X)… (6) CMRP/Φ = 1 – (Sg. Y)…(7) Then from equations (6 and 7) the following equation is obtained Φ = (Y/(X+Y))* Φs + CMRP (X (X+Y))……(8) By assuming that A= y/(x+Y) and B= X (X+Y) the following equation is deduced: Φ = A*Φs + B* CMRP… (9) Where A + B = 1 The advantage of this technique is that porosity can be estimated without the parameters Sg, HIfandPg. Fig. (6) shows that there is a good relation between core porosities and the estimated porosity from NMR combined tool. The values of A and B can be ensured by deriving them from core samples andwell logging data.Generally, core porosities are considered to be the accurate porosity ofthe formation. By substituting core porosities into Eq. (9), and dividing byCMRPon both sides, we obtain the following expression (Xiao et al., 2012): ΦC/CMRP = A (Φs/CMRP) + B…(10) If Φs/CMRP is plotted in the horizontal axis and ΦC/CMRP in the vertical axis, the linear regression method is used and the values of A and B can be determined as follow:
Φ = 0.6449 Φs + 0.0936 CMRP
SUMMARY ANDCONCLUSION
Nuclear Magnetic Resonance Imaging has emerged as the leading technological break-through which is providing difficult-to-interpret zones with the outstanding results. Unlike other conventional tools, the NMR measurements are largely based on the fluid and the pore space characteristics. This makes it possible to see the fluids and pores more obviously which are not seen on other conventionallogs like Density, Neutron and Sonic. The paper shows that combined NMR wireline tools with the sonic log are considered to be the most accurate technique compared to other conventional logging tools. Through analysis, it is a fact that NMR tools are more accurate and more applicable than other conventional tools. NMR tools overcome lots of obstacles that face conventional logs. They also can be integrated with other tools with phenomenon accuracy. NMR physics are explored and explained in details. InterPetrophysics© by Schlumberger is the software used in interpretation. Several software applications are done on the thesis. Moreover, applying the NMR interpretations on the studied well with all the needed data and logs for it is discussed in detail in the thesis. Finally, we conclude by stating the unique privileges of using the NMR technology for well logging and how useful it is in enhancing the oil industry in general. Then the porosity can be precisely estimated by combining interval transit time with NMR logs in any gas-bearing formations by using the technique proposed in this study. Before this technique is applied, a certain number of core samples should be drilled for routine analysis to determine the parameters of A and B.
REFERENCES
Cannon E.D. et al., (1998): Quantitative NMR interpretation SPE 49010, SPE Fall Meeting, New Orleans, USA. Cao Minh C. et al., (1998): Integration of NMR with other openhole logs for improved formation evaluation, SPE 49012, SPE Annual Technical Conference, New Orleans, USA. Chu, Z.H., J. Gao, L.J. Huang, and L.Z. Xiao, (2007): Principles and methods ofgeophysical logging (Part II), Petroleum Industry Pressure, Beijing, p. 224326. Coates, G.R., L.Z. Xiao, and M.G. Prammer, (1998): NMR logging principles and applications, Gulf PublishingCompany, Houston, p. 4278. Coates, G.R., Xiao, L.Z., Primmer, M.G., (2000): NMR logging principles and applications, Gulf Publishing Company, Houston, p. 1–200. USA. Dunn, K.J., Bergman, D.J., Latorraca, G.A., (2002): Nuclear magnetic resonance:petrophysical and logging applications, Handbook of Geophysical Exploration,Pergamon, New York, p. 1–120. Hamada, F., Tomoyasu, Y., Takatsu, Y., Nakamura, M., Nagai, S., Suzuki, A., Fujita, F., Shibuya, H., Toyoshima, K., Ueno, N., Akiyama, T. (1999): Negative regulation of wingless signaling by D-axin, a Drosophila homolog of axin. Science 283(5408): p. 17391742. Hassoun, T.H. and Zainalabedin, K., (1997): Hydrocarbon detection in low contrast resistivity payzones, capillary pressure and ROS determination with NMR logging in Saudi Arabia.SPE Paper 37770, 10th MEOS, Bahrain, March 1518. Kenyon, W.E., (1997):Petrophysical principles of applications of NMR logging, Log Anal. V. 38 (3), p. 21–43. Mao, Z.Q., C. Zhang, and L. Xiao (2010): A NMR-based porosity calculation method for low porosity and low permeability gas reservoir, Oil GeophysProspect. V. 45, no. 1, p. 105109. Mohamed Nashaat, YassinSallam and Ahmed Elsherif Utilizing Magnetic, (2001): Utilizing magnetic resonance logging for improved formation evaluation in the Mediterranean thinly laminated gas bearing formations: A Case Study, Society of Petroleum Engineers. Raiga-Clemenceau, J., J.P. Martine, and S. Nicoletis (1988): The concept of acoustic formation factor for more accurate porosity determination from sonic transit time data, The Log Analyst. V. 29, no. 1, p. 5460. Wyllie, M.R.J., A.R. Gregory, and L.W. Gardner (1956): Elastic wave velocities in heterogeneousand porous media, Geophysics.V. 21, no.1, p. 4170. Xiao, L.Z. (1998):Magnetic resonance imaging logging and rock nuclear magnetic resonance and its application, Science Press, Beijing (in Chinese). Xiao, L., Zhi-qiang Mao, Gao-ren L. and Yan Jin, (2012): Calculation of porosity from Neuclear Magnetic Resonance and conventional logs in gas-bearing reservoir, ActaGeophysica, v. 60, n. 4, p. 10301042, Yong, S.H., C.M. Zhang, and Z.Y. Liu (1996): Well log data processing and comprehensiveinterpretation, China University of Petroleum Press, Dongyin (in Chinese).
NAME: AHMED ZAKARIA NOAH
EDUCATION: Associate.Prof at TheAmerican University in cairo PhD. in Petrophysics. Waseda and Menofia University, 2003. ACADEMIC EXPERIENCE: Faculty of Science and Engineering, The AmericanUniversity in Cairo (12010/9/ – Now, full time Ass.Prof of drilling, completion and workover). -Faculty of Petroleum Engineering, The BritishUniversity in Egypt (212010/9/1 – 2008/12/, full time lecturer and Ass. prof), Undergraduate Level: Oil well drilling, Advanced drilling Engineering, Horizontal drilling, Drilling fluids, Principles of Petroleum Geology, Well logging, core analysis, Development Geology, Completion and workover, Reservoir Rock properties, Reservoir Engineering. -Petroleum Research Institute, Cairo (Full time Researcher : (12008/12/-21 2005/12/) Faculty of Science, Menofia University, Egypt : (20032008-), Graduate Level:Method of Prospecting. And Well Logging
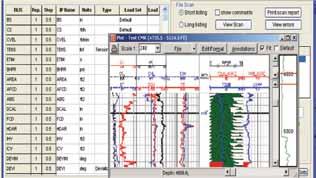
Fig. (1) Shows step of Interactive Petrophysics Software
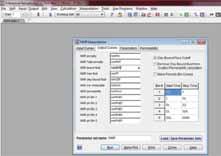
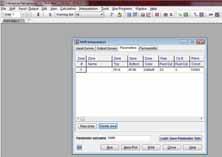
Fig. (2) Shows uploading data
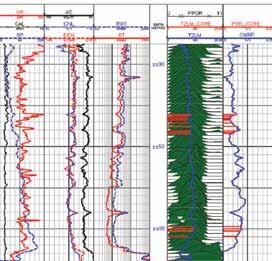
Fig. (3) Shows the output logs.
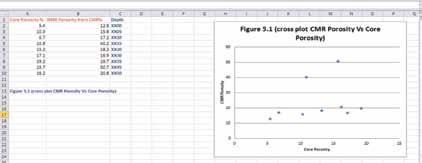
Fig. (4) Illustrates the cross plot of the NMR and core porosity in the target interval.
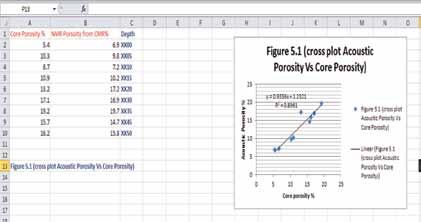
Fig. (5) Shows the cross plot of the acoustic and core porosity in the target interval.
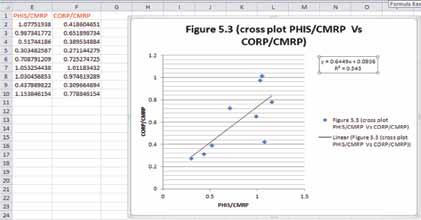
Fig. (6) (cross plot Φs/CMRP VsΦC/CMRP)