
35 minute read
FOREST HEALTH RESEARCH PROGRAM

from Vegetation Trends and Cycles in the Fire-prone Landscapes of Lake, Napa, and Sonoma Counties
by Pepperwood

Final Technical Report
Vegetation Trends and Cycles in the Fire-Prone Landscapes of Lake, Napa, and Sonoma Counties
Advertisement
Author 1 Arthur Dawson
Historical Ecologist, Baseline Consulting
Author 2 Tosha Comendant
Conservation Science Director, Pepperwood

Author 3 Kai Henifin
Climate and Fire Resilience Coordinator, Pepperwood
Author 4 Lisa Micheli President & CEO, Pepperwood
Author 5 James Thorne
Research Scientist, Department of Environmental Science and Policy, UC Davis
Author 6 Mark Tukman
Principal, Tukman Geospatial, LLC
April 2023
Territorial Acknowledgement

Pepperwood Reserve sits within the traditional homeland of the Wappo people. We respect and honor past, present, and future generations of Wappo and their continued connection to this land. We are grateful for the opportunity to gather in this beautiful place and we give our respect to its first inhabitants.
Authored by Clint McKay (Dry Creek Pomo, Wappo, Wintun)
Suggested citation: Dawson, A. D., Comendant, T. Henifen, K., Thorne, J. H., Tuckman, M. & Micheli, L. 2023. Vegetation Trends and Cycles in the Fire-Prone Landscapes of Lake, Napa, and Sonoma Counties. Pepperwood Preserve, CA.
Table Of Contents
Sonoma-Napa Study Area, maps, pie charts, and tables
Sonoma West Study Area, maps, pie charts, and tables
Lake Study Area, maps, pie charts, and tables
Napa East Study Area, maps, pie charts, and tables
Fire and Vegetation Under Indigenous Stewardship
Regional Fire Patterns: 1870-2020
Landscape Variables: Distance Inland, Slope Aspect, Slope Steepness
Frequent and Rare Burn Zones
Regional Vegetation Patterns: 1870-2020
Shrubland Decline
Woodland Expansion: Douglas Fir Expansion, California Bay Expansion
Black Oak Decline
Vegetation Response to Fire: Fire-Shrub-Woodland-Fire Cycle
Vegetation Response to Timber Harvest
Vegetation in the Absence of Fire: Rare Burn Zones
Grassland
Emissions and Sequestration
Vegetation Trends and Cycles in Fire Prone Landscapes of Lake, Napa East and Sonoma Counties
Clint Mckay, (Wappo, Pomo, Wintun) Indigenous Elder
Table A-1: GLO Survey to Modern Vegetation Crosswalk
Table A-2. Woodland Calculations from General Land Office Survey Data
CA Fish and Wildlife: WILDLIFE HABITAT RELATIONSHIP Designations
Table A-3. Confidence Levels for Mapped Accuracy of Historical Fire Perimeters From Narrative
SONOMA WEST: Map, Overview, Vegetation and Fire Tables, Narrative Timeline
SONOMA-NAPA: Map, Overview, Vegetation and Fire Tables
LAKE: Map, Overview, Vegetation and Fire Tables
NAPA EAST: Map, Overview, Vegetation and Fire Tables
Vegetation Trends and Cycles in Fire Prone Landscapes of Lake, Napa East and Sonoma Counties
List Of Figures
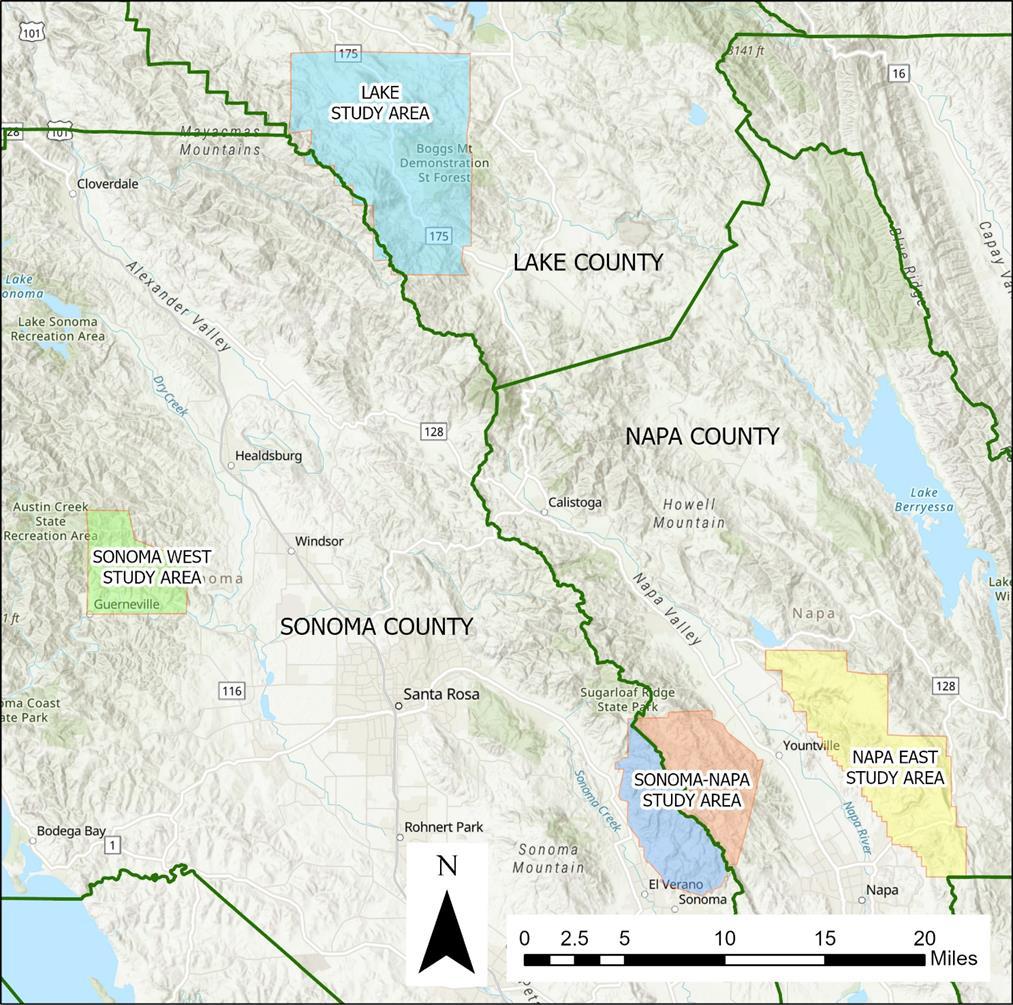
Figure 1. Study Area Regional Map
Figure 2. Sonoma-Napa Study Area, Vegetation Lifeforms, 1872 - 2016
Figure 3. Sonoma-Napa Study Area, Lifeform Comparison by County 1867 - 2016
Figure 4. Sonoma-Napa Study Area, Fire History 1870 - 2020
Figure 5. Sonoma-Napa Study Area, Frequent Burn Zone (FBZ) Lifeforms 1877 - 2013
Figure 6. Sonoma-Napa Study Area, Rare Burn Zone Lifeforms (RBZ) 1867 - 2016
Figure 7. Sonoma West Study Area, Vegetation Lifeforms—1867 - 2013
Figure 8. Sonoma West Study Area Fire History: Documented Fires 1902 – 2020
Figure 9. Sonoma West Study Area, Frequent Burn Zone (FBZ) Lifeforms 1867 - 2013
Figure 10. Sonoma West Timber Harvest Zone (THZ): Intensive Logging, c. 1875 - 1915
Figure 11. Sonoma West Timber Harvest Zone (THZ) Lifeforms 1867 - 2013
Figure 12. Lake Study Area, Vegetation Lifeforms, 1873 - 1993
Figure 13. Lake Study Area, Fire History: Documented Fires – 1874 - 2020
Figure 14. Lake Study Area, Frequent Burn Zone (FBZ) Lifeforms –-1873 – 1993
Figure 15. Lake Study Area, Frequent Burn Zone (FBZ) Post fire Shrub Transitions—1950-1993
Figure 16. Lake Study Area, Rare Burn Zone (RBZ) Lifeforms 1866 – 1993
Figure 17. Napa East Study Area, Vegetation Lifeforms, 1863 - 2016
Figure 18. Napa East Study Area, Fire History: Documented Fires – 1874 – 2020
Figure 19. Napa East Study Area, Frequent Burn Zone (FBZ) Lifeforms –-1863 – 2016
Figure 20. Napa East Study Area, Rare Burn Zone (RBZ) Lifeforms 1876-2016
Figure 21. Average # Fires by Study Area
Figure 22. Average # Fires vs. Distance Inland
Figure 23. Average # Fires vs. Slope Aspect
Figure 24. Average # Fire in Frequent Burn Zones and Study Areas
Figure 25. Sonoma West, % Woodland Cover 1867-2013
Figure 26. Sonoma-Napa, % Woodland Cover 1871-2015
Figure 27. Lake, % Woodland Cover 1871-2015
Figure 28. Napa East, % Woodland Cover 1863-2016
Figure 29. Change in Douglas Fir Cover
Vegetation Trends and Cycles in Fire Prone Landscapes of Lake, Napa East and Sonoma Counties
Pepperwood, Baseline Consulting, Tukman Geospatial, Thorne Environmental Landscape Analysis
Figure 30. Douglas Fir Elevation Shift, Sonoma-Napa 1870 – 2013
Figure 31. Douglas Fir Elevation Shift, Sonoma West 1870 – 2013
Figure 32. Douglas Fir Elevation Shift, Lake 1870 – 2013
Figure 33. Sonoma-Napa FBZ Lifeform Transitions, 9-49 Years Post Fire
Figure 34. Sonoma West FBZ Lifeform Transitions, 6-54 Years Post Fire
Figure 35. Lake Lifeform FBZ Transitions, 6-49 Years Post Fire
Figure 36. Sonoma-Napa Fire Extent, 1870 – 2020 (as % of Study Area)
Figure 37. Sonoma West Fire Extent, 1916 – 2020 (as % of Study Area)
Figure 38. Lake Fire Extent 1874 - 2020 (as % of Study Area)
Figure 39. Napa East Fire Extent, 1870 – 2020 (as % of Study Area)
Figure 40. Windspeed and Fire Spread, Tubbs and Nunns Fires, October 2017.
Figure 41. Woodland Cover vs. Fire Size (>500 acres) Sonoma-Napa, 1936 – 2017
Figure 42. Woodland Cover vs. Fire Size (>2000 acres) Lake, 1939-2015
Figure 43. Woodland Cover vs. Fire Size (>300 acres) Sonoma West, 1929-2020
Figure 44. Woodland Cover vs. Fire Size (>500 acres) Napa East
List Of Tables
Table 1. Study Area Summary Characteristics
Table 2. Vegetation Categories applicable to all data
Table 3. Mapping Resolution of Vegetation Data
Table 4. Sonoma-Napa FBZ, Lifeform Cover by Date and Rate of Change
Table 5. Sonoma-Napa RBZ, Lifeform Cover by Date and Rate of Change
Table 6. Sonoma West FBZ, Lifeform Cover by Date and Rate of Change
Table 7. Sonoma West THZ, Lifeform Cover by Date and Rate of Change
Table 8. Lake FBZ, Post fire Shrub Transitions, Lifeform by Data and Rate of Change
Table 9. Lake RBZ, Lifeform Cover by Date and Rate of Change
Table 10. Napa East FBZ, Lifeform Cover by Date and Rate of Change
Table 11. Napa East RBZ, Lifeform Cover by Date and Rate of Change
Table 10. Wind-driven vs. Fuel-driven Phases. Sonoma Complex Fires. October 2017
Table 11. Woodland Cover within 2015-2020 Fire Perimeters
Vegetation Trends and Cycles in Fire Prone Landscapes of Lake, Napa East and Sonoma Counties
Pepperwood, Baseline Consulting, Tukman Geospatial, Thorne Environmental Landscape Analysis
ABBREVIATIONS and TERMS
FBZ: Frequent Burn Zone
GLO: General Land Office surveys, late 19th century
Napa Veg map: Napa Vegetation Map, 2016
Nunns: Nuns [Fire]. Nunns is the original spelling and refers to an early setter.
RBZ: Rare Burn Zone
Soil-Veg maps: Soil-Vegetation maps, 1950 - 1965
Sonoma Veg map: Sonoma Vegetation Map, 2013
THZ: Timber Harvest Zone
VTM: Vegetation Type Maps, 1928-1932. (aka ’Wieslander’)
WHR: Wildlife Habitat Relationship maps
Keywords
Vegetation Response to Fire
Vegetation Trends
Vegetation Cycles
Fire-prone Landscapes
Wildfire Patterns
Prescribed burning
Cultural burning
Fire History
Vegetation History
Northern California
Acknowledgements
The assistance and support of many people was essential to completing this project. We are especially grateful to: Amber Manfree; Ben Nichols, CAL FIRE; Carolyn Ruttan, Clear Lake Environmental Center; Chris Carlson, Sonoma Land Trust; Christopher Kam; David Ackerly, UC Berkeley; David Conklin, Bureau of Land Management; Jill Dawson; Kim Batchelder, Sonoma County Agricultural and Open Space District (Ag & Open Space); Lakeport Library staff; Michelle Halbur, Pepperwood; Monica Delmartini, Ag & Open Space; Morgan Gray, Pepperwood; Penny Sirota; Ryan Ferrell, Pepperwood; Michael Gillogly, Pepperwood; and the members of the Sonoma County Forest Conservation Working Group
Vegetation Trends and Cycles in Fire Prone Landscapes of Lake, Napa East and Sonoma Counties
Pepperwood, Baseline Consulting, Tukman Geospatial, Thorne Environmental Landscape Analysis
This study builds on research conducted in the region over the last two decades, funded by a number of agencies and non-profits, including Audubon Canyon Ranch, Pepperwood, Sonoma County Agricultural and Open Space District, Sonoma Land Trust, Golden Gate National Parks Conservancy, Sonoma Land Trust, and Sonoma Ecology Center.
Funding
Funding for this project was provided by the CAL FIRE Forest Health Research Program, Grant 8GG19813. The Forest Health Research Program is part of California Climate Investments, a statewide initiative that puts billions of Cap-and-Trade dollars to work reducing greenhouse gas emissions, strengthening the economy, and improving public health and the environment particularly in disadvantaged communities.
Abstract
Between 2015 and 2020, some of the most destructive and deadly wildfires in California history occurred in Lake, Napa, and Sonoma counties. A long-term understanding of fire and vegetation patterns is needed to inform hazard reduction and forest resilience strategies, and to advance the public awareness needed for improved fire readiness across the region. Four study areas, covering about 200 sq mi. and identified by CAL FIRE as places where communities and the environment are at elevated risk from wildfire, were chosen: one each in Lake, Napa and Sonoma Counties and one straddling the ridge between Napa and Sonoma. Three were in the Mayacamas Range, 30-40 miles inland, and one along the Russian River, about ten miles inland. Indigenous elders provided long-term data for fire and vegetation patterns within a context where cultural burning was regularly practiced. Historical vegetation change over the last 150 years was assessed with a suite of historical surveys and vegetation maps, covering the period from 1870 – 2020. To compare time periods, vegetation data was sorted into broad Lifeform and Forest Type categories. Fire history was assessed using CAL FIRE-mapped perimeters dating to the 1940s and narrative sources (e.g., newspapers) to extend and other narrative sources, earlier fires were mapped to the late 19th century, thus creating a fire record that coincided with the vegetation record. Frequent Burn Zones (FBZs), Rare Burn Zones (RBZs) and Timber Harvest Zones (THZ) were identified and analyzed for vegetation changes and post-fire recovery. Results showed an overall decline in shrublands and an increase in woodlands during the study period. The most fire-prone places were the places where the most dynamic vegetation change occurred. In as little as three decades, places that were exclusively shrublands (100%) in the aftermath of fire, became primarily woodland (65%). Catastrophic fires appear to show a correlation with woodland cover >60%. This has implications for developing a univariate ‘fire exposure metric’ for guiding cultural and prescribed burning and other fuel reduction strategies.
Vegetation Trends and Cycles in Fire Prone Landscapes of Lake, Napa East and Sonoma Counties
Pepperwood, Baseline Consulting, Tukman Geospatial, Thorne Environmental Landscape Analysis
Within the last ten years, some of the most destructive and deadly wildfires in California history have occurred in Lake, Napa and Sonoma counties. Dozens of people died in these fires, hundreds of thousands evacuated, and nearly 10,000 homes and structures were destroyed. The goal of this project is to better characterize long-term fire and vegetation patterns to inform hazard reduction and forest resilience strategies, and to advance the public awareness needed for improved fire readiness across the region.
In facing the current situation, firefighters, land stewards and the public are realizing that our long-established practices no longer serve us well. There is a recognition that fundamental changes are needed. Most of us are relative newcomers to this land, with roots going back a few generations at most. To thrive here in the long run, or even just survive, we need a deeper understanding of this place. Part of that understanding will be built from scientific studies of vegetation, fire, climate and related disciplines Such knowledge is valuable and useful, but it can perpetuate the illusion that, with enough data, control is possible, and that fire is an adversary to be fought. Effectively reimagining our role as human beings in the landscape and changing our relationships with fire and vegetation is going to require a much broader vision.
As part of that reimagining, this study took an interdisciplinary approach. We incorporated an array of historical and scientific sources and gave equal weight to the perspectives and traditional wisdom of our local Indigenous community. Several people with first-hand experience of cultural burning, as well as knowledge passed down from past generations, shared their knowledge with us. For this gift we are extremely grateful. This Indigenous wisdom (aka Traditional Ecological Knowledge) is a slender thread going from the present all the way back to the beginnings of human time in our region. Clint McKay (Dry Creek Pomo, Wappo, Wintun), Chair of Pepperwood’s Native Advisory Council, shared that he can’t identify his earliest memories of cultural burning it’s part of a cultural tradition extending back to before he was born. Personal memories are less important than the combined memories and experiences of those who came before. As a foundation for responsible stewardship, that knowledge is a form of generational wealth.
Another holder of Indigenous wisdom contacted during this study was Redbird (Pomo, Paiute, Wintu and Wailaki), Stewardship Coordinator at Heron Shadow, a ‘Biocultural Oasis’ in Graton, owned and stewarded by the Cultural Conservancy. On seeing vegetation maps created for this project, he observed that they show ‘what happens when the land is not being tended properly.’ Considering how long his people and their neighbors have cared for this place, that idea makes an appropriate framework for reflecting on the 150 years of vegetation and fire history collected here. If fire can be considered a member of the community, as Heron Shadow’s director Sara Moncada puts it, then the recent catastrophic fires highlight the consequences of ignoring that community member, or thinking we can banish them entirely.
The bulk of this report covers what has happened over the 150-plus years since Indigenous stewardship has been excluded from the landscape. Historical data, including fire and vegetation maps, was collected and created within areas defined as ‘high fire risk’ by CAL FIRE. As a set of ‘natural experiments’ over a long period of time, it evaluates the influence of various factors on local fire history including vegetation changes over that period. No modeling was done for this study, though several landscape and ecological parameters, such as slope aspect and vegetation type, used in fire modeling, were analyzed.
Within the four study areas in Lake, Napa, and Sonoma counties, modern fire suppression began in the 1930s or 1940s. Thus, about half the record documented in this report occurred prior to suppression and half later, giving something of a ‘before and after’ picture of conditions. The earliest ‘mappable’ data used in this study was collected by surveyors working for the General Land Office, primarily in the 1860s and ‘70s. These 19th-century surveys can be challenging to interpret. Nevertheless, they offer an extremely fine-grained picture of the land and the vegetation on it as it existed just a few years after Indigenous stewardship had ended or gone into steep decline.
Fire regimes in California are highly variable. To be effective, vegetation and land stewardship must account for this variability (Stephens et al 2014). In contrast to southern California (Syphard et al 2019), this study demonstrates that post-fire vegetation recovery in more northern counties can be rapid and dynamic. In many of the most fire-prone areas covered in this study, shrublands (mapped at 100%) converted to woodlands (65% or more) in just three decades. A decade or two later, after the next wildfire comes through, shrublands return and the cycle begins again. Forest recovery after timber harvest occurs almost as quickly with ‘barren’ land returning to 59% forest in about four decades. Within these landscapes are places where no fires or major disturbance have been recorded in the last 150 years.
The Napa East study area illustrates this landscape variability well, with vegetation patterns in sharp contrast to the other study areas. Though it is the most fire-prone of our study areas, it does not follow the pattern mentioned above vegetation change in the wake of fire proceeds so slowly as to be nearly undetectable. Whether this is due to a difference in soils, precipitation or some other factor is unknown at this point.
Mapping and describing the changes in vegetation patterns and fire over the last 150 years is inherently challenging. As described in the Methods section, it requires distilling vegetation data down to its ‘least common denominator.’ What this approach lacks in precision it makes up for in a longer time scale and expanse of landscapes. This lens makes visible the broad outlines of vegetation change over a century and a half and allows us to put present conditions in context. Some line descriptions in the 19th-century surveys are challenging to interpret. Others, like “mostly only chaparral,” provide a sharp and undeniable contrast in places now heavily forested.
Landscapes reflect the practices and preferences of the people living in them, according to the amount of care and attention they receive, or the lack of it. The only known factor which can account for the prevalence of chaparral in the 19th-century surveys is a widespread tradition of cultural burning. As a way of “proper tending,” cultural burning was done in many kinds of habitats. The incidence of chaparral in the surveys is just the most visible marker in the historical record.
It is well known that human actions can harm the natural world. But things are also thrown out of balance by a lack of engagement and stewardship. Recent catastrophic wildfires indicate that this lack of human involvement not only threatens natural systems but puts us in danger as well. It’s impossible to say what our landscapes, with proper tending, could look like in another 150 years. By looking back a century and a half, this report offers a foundation for such long-term thinking through the following lines of inquiry:
1. How has the relationship between vegetation, fire, and people changed over time?
2. What is the relationship between fire frequency, vegetation trends and cycles, landscape variables, and post-disturbance regeneration?
3. Do vegetation patterns, or other landscape factors suggest a tipping point for large or catastrophic fires? How do these compare with other possible tipping points such as temperature, humidity and wind speed?
4. What is the most effective point in the fire/revegetation cycle for fuel reduction efforts to minimize wildfire emissions and threats to communities and ecosystem services, while also maximizing carbon sequestration for a given location?
5. How might we use fire as a stewardship tool to improve the ecological health of the land?
These questions will be referred to in the ‘Methods’, ‘Results,’ and ‘Discussion’ sections that follow, using these abbreviated phrases:
1. Relationship of vegetation, fire, and people
2. Fire frequency, vegetation patterns and landscape variables
3. Minimizing emissions, maximizing sequestration
4. Tipping points for catastrophic fire
5. Fire as a stewardship tool
Vegetation Trends and Cycles in Fire Prone Landscapes of Lake, Napa East and Sonoma Counties
Pepperwood, Baseline Consulting, Tukman Geospatial, Thorne Environmental Landscape Analysis
Setting
The Study areas (Fig. 1) were chosen according to two criteria:
• Places where communities and/or natural resources are at risk from wildfire.
• Places where long-term vegetation records are available
A comparative summary of the characteristics of each study area is included in Table 1 below. A map showing the locations of the four study areas is shown in Figure 1. on the following page Individual maps of each study appear in both the ‘Selected Results’ section and the ‘Comprehensive Results by Study Area’ section of the Appendix.
Table 1. Study Area Summary Characteristics
Vegetation Trends and Cycles in Fire Prone Landscapes of Lake, Napa East and Sonoma Counties
Pepperwood, Baseline Consulting, Tukman Geospatial, Thorne Environmental Landscape Analysis
METHODS and MATERIALS
The landscape covered in this report was identified as a high priority by CAL FIRE and defined as “places in which specific actions can be taken to reduce risk to a forest asset.” Those actions include: Reducing Wildfire Risks to Ecosystem Services; Restoring Fire Damaged Areas; and Reducing Wildfire Threat to Communities. This study highlights areas at particular risk of wildfire but is not intended to be a definitive study of vegetation and wildfire for the region. By the same token, even within the relatively limited area of this study (about 5% of Lake, Napa and Sonoma Counties) there are significant differences between study areas.
INDIGENOUS WISDOM (Traditional Ecological Knowledge)
Applies to: 1) Relationship of vegetation, fire, and people; 2) Fire frequency and vegetation patterns;
5) Fire as a stewardship tool
Clint McKay (Dry Creek Pomo, Wappo, Wintun) spent several hours at Pepperwood recounting his knowledge of cultural burning. A relative of well-known culture keepers Mabel McKay (Cache Creek Pomo) and Laura Somersal (Wappo, Dry Creek Pomo), Clint’s knowledge of cultural burning practices extends in an unbroken lineage all the way back to pre-European settlement days. His experiences growing up on the Dry Creek Rancheria near Healdsburg included direct, first-hand experience with cultural burning. With his multi-tribal background, Clint’s ancestry extends to three of the study areas: Napa East, Sonoma-Napa and Sonoma West.
Another source of Indigenous knowledge was Edward Redbird Willie (Pomo, Paiute, Wintu and Wailaki), Stewardship Coordinator at Heron Shadow, a ‘Biocultural Oasis’ near Graton owned and tended by the Cultural Conservancy. During an on-site tour, Redbird shared his perspective on cultural burning and directed me to several online videos in which he spoke about cultural burning. The Director of Heron Shadow, Sara Moncada (Yaqui/Irish), also contributed her thoughts and perspectives during the on-site tour including the ongoing story of how Heron Shadow has been working with their neighbors to bring cultural burning back to the land.
Several attempts were made to contact an elder at the Middletown Rancheria (Pomo), whose people’s ancestral homelands include the Lake study area. Unfortunately, these were unsuccessful as of the close of the project. As cultural burning practices were somewhat varied from place to place, it should be acknowledged that the information in this report is in no way complete for the region, and the lack of contact with the Middletown Rancheria is a potentially significant gap.
An observation by Clint McKay regarding Douglas fir distribution was corroborated with changes recorded in the historical data. These results are included in a section of the Discussion.
Historical Record
Applies to: 1) Relationship of vegetation, fire, and people; 2) Fire frequency and vegetation patterns; 3) Minimizing emissions, maximizing sequestration; 4) Tipping points for catastrophic fire;
5) Fire as a stewardship tool
Past efforts which informed this project include: the Sonoma Veg Map (Sonoma County 2017); the Napa Veg Map (Napa County 2016); Marin County Historical Wildfire Mapping Project (Dawson 2022); Historical Fire, Vegetation & Change Analysis Project, Bouverie Preserve (Dawson 2019); Estimating Vegetation Reference Conditions by Combining Historical Source Analysis and Soil Phytolith Analysis at Bouverie Preserve (Evett et. al. 2012. Published in Restoration Ecology); Historical Vegetation Upland Pilot Project (Dawson 2014a); and others in the region.
Vegetation Trends and Cycles in Fire Prone Landscapes of Lake, Napa East and Sonoma Counties
Pepperwood, Baseline Consulting, Tukman Geospatial, Thorne Environmental Landscape Analysis
The approaches used in this study to characterize historical vegetation, map wildfire perimeters in the pre-CAL FIRE era, and to integrate vegetation and fire patterns were largely developed during the efforts mentioned above. This study extends that work by covering a broader geographical area, tapping into the Indigenous wisdom (Traditional Ecological Knowledge) of local tribes, utilizing previously unused sources (such as the SoilVeg maps), and developing trajectories for timber harvest recovery to compare with recovery from wildfire.
Data was collected from a variety of online and physical archives These historical data sources were digitized and mapped using Geographic Information Systems. Quantitative results and summaries are provided in tabular (see ‘Selected Results’ and ‘Appendices’).
MAPPING and MEASURING VEGETATION CHANGE
Applies to: 1) Relationship of vegetation, fire, and people; 2) Fire frequency and vegetation patterns;
3) Minimizing emissions, maximizing sequestration; 4) Tipping points for catastrophic fire;
5) Fire as a stewardship tool
Tracking vegetation changes over long periods of time requires “translating” data collected using different methods and for various purposes into common categories to create a consistent and transparent basis for comparing change over time. Vegetation data sources include:
• General Land Office surveys (predominantly 1860s/70s)
• Vegetation Type Maps or VTMs (1928, 1932. aka ‘Wieslander maps’)
• Soil-Vegetation Maps (1950s/60s)
• Wildlife Habitat Relationship Maps (1993) CA Dept of Fish and Wildlife
• Sonoma County Vegetation Map (2013)
• Napa County Vegetation Map (2016)
(Note that these dates refer to when the data was collected, not necessarily when it was released. This is important for calculating rates of change following a disturbance occurring at a specific point in time.)
Developing a consistent and transparent approach for comparing these half-dozen data sets required distilling the data through the following two filters:
1) Sort the data into five main categories. Because vegetation in all eras was recorded ‘in order of predominance,’ (quote from the 1858 survey manual) it can be sorted into the Lifeform groups herbaceous, shrublands and woodlands used in the Manual of California Vegetation (MCV; CNPS 2007)Or, where those fall short, the addition of ‘Human’ and ‘Other’ covers all the data collected throughout the study period.
2) Where possible, sort the data further into forest types identifiable in all eras (see MCV 2009 and ‘Vegetation Crosswalk’ in Appendix for more detail)
All the data collected over the study period was sorted into these categories, as shown and described in Table 1 on the following page, which provided the primary framework for analyzing vegetation patterns and change over time. These large categories minimize error when comparing vegetation over a long timespan. It is assumed that the data collectors in all time periods could distinguish between these main categories. Identifying vegetation alliances and associations from the historical data is much more uncertain and thus more prone to error and misinterpretation.
Vegetation Trends and Cycles in Fire Prone Landscapes of Lake, Napa East and Sonoma Counties Pepperwood,
TABLE 2. Vegetation Categories applicable to all data
MAIN CATEGORIES SUBCATEGORIES MCV DEFINITIONS (CNPS 2009; pgs.51-55) EXAMPLES
WOODLANDS “Trees evenly distributed and conspicuous” (MCV category I)
SHRUBLANDS
HERBACEOUS
HUMAN
OTHER
Conifers “Dominated by conifers” (MCV sub-category 4’. 8’)
Oak, Madrone, Alder
Douglas fir; Knobcone Pine Hardwoods “Dominated by evergreen or winter deciduous hardwood trees, or conifers may be associated with them and co-dominant.” (MCV sub-category 4’. 8.)
“Woody shrubs or sub-shrubs conspicuous” (MCV category II)
“Non-woody herbaceous vegetation dominant” (MCV category III)
Human footprint dominant (no MCV definition)
Lack of vegetation dominant (no MCV definition)
Chamise; Manzanita
Native and nonnative grassland, e.g. bunchgrass, Avena spp.
Vineyards, Orchards, roads, structures
Water, rocks, or ‘no data’
Vegetation data for 1993 to the present (WHR, Sonoma Veg Map, Napa Veg Map) was readily available in GIS as polygon shapefiles. Likewise, the Wieslander Vegetation Type Maps (VTM) had already been digitized and brought into GIS with original attributes as well as Wildlife-Habitat Relationship maps (WHR) and MCV classifications. Processing the Soil-Veg maps and the General Land Office surveys (GLO) required laborious ‘heads up’ digitizing drawing the polygons by hand on screen (or lines and points for the surveys) and attributing each feature with the original data.
Once the vegetation record for each study area was brought into GIS, the data was made into maps (see ‘Selected Results’) as well as tables. The ‘Create Report’ feature in GIS was an essential tool for compiling all the data into a form that could be easily input into the tables.
The most current vegetation maps were all produced before the most recent catastrophic fires. In Sonoma county, these maps pre-date the Nunns and Walbridge Fires by 4-7 years respectively; in Napa East, the Atlas Fire by just 1 year; and in Lake county, the Valley Fire by 22 years. We don’t yet have an overview of how the land has and will respond in present time. An update of the Sonoma Veg map is underway, which will provide a look at about 5-7 years of recovery.
The name of trees and shrubs vary somewhat over the study period, with the most variation being in the early surveys. Discrepancies could usually be resolved by researching historical names (e.g. ‘Chemizal’ for Chemisal or Adenostoma fasciculatum, or Madroño for Madrone. see Vegetation Crosswalk in Appendix). Cases which could not be resolved to the species level could still be slotted into lifeform categories or better, allowing changes to be detected at a coarser level.
Mapping resolution varies widely over the study period (Table 3) and was accounted for during the change analysis. The intent of this study was to identify the most significant shifts in vegetation, while conserving as
Vegetation Trends and Cycles in Fire Prone Landscapes of Lake, Napa East and Sonoma Counties
Pepperwood, Baseline Consulting, Tukman Geospatial, Thorne Environmental Landscape Analysis much detail as possible. To avoid creating the impression of a higher degree of accuracy than actually exists, percentages of vegetation cover were rounded to the nearest whole number.
TABLE 3. Vegetation Data Mapping Resolution
Mapping Resolution
Average acres/polygon
*GLO: = Total Acres/#Survey points + Line Descriptions =acres per data ‘bit’
The uncertainties associated with the 19th-century survey data (GLO) present a unique challenge that has been addressed in previous work (Dawson 2014a). Mapping vegetation from the survey record requires accounting for the known biases in the choice of bearing trees (hardwoods over conifers); the unbiased but less precise line descriptions, while also accounting for the proportion of actual bearing trees to the number that would have been marked if they had been available. Every mile of survey line was supposed to have 6 trees marked (four at the section corner and two at the quarter-section corner), if possible. Sometimes only one or two trees were marked and in many cases the surveyors had to build a cairn instead of marking a tree. The lack of bearing trees was interpreted to indicate shrub or grass at those sites rather than woodland (or ‘rock’ or ‘barren’ if warranted by nearby data). Sites that were consistently recorded as shrublands in later years were assumed to be the same for the early surveys. The percentage of marked trees to the total number possible was considered the most accurate measure of woodland cover in the GLO data. Trees <8” diameter marked along survey lines described as shrublands were designated as shrubs.
Figures for the resolution of the GLO surveys may not be directly comparable to the other periods, due to the way this data was collected and recorded. However, it does indicate the level of detail with which the land was surveyed. Accounting for the accuracy of these surveys (see Evett et. al. 2012 and Dawson 2014a), and the distances bearing trees were located from survey points (in both cases < 3 chains = 60 m or ~200 feet), we roughly estimate that the 19th century surveys recorded about 25% of the landscape at some level of detail. Little or no detail should be assumed for the remaining 75%.
For an extensive discussion about using the data from the GLO surveys, see the “Historical Vegetation Mapping Upland Pilot Project” (Dawson 2014a). Available at https://sonomaopenspace. egnyte.com/dl/fNMHZANzqD
It is widely held that the State of California planted Knobcone pines, Harding grass and perhaps other species as a way of reducing erosion and reseeding forestlands after the 1964 Nunns, Hanley, and probably other fires. Some of this is said to have been done by broadcasting seeds from airplanes. While there is no reason to doubt this, and it seems quite plausible, no primary historical records have been located to support this. Botanical
Vegetation Trends and Cycles in Fire Prone Landscapes of Lake, Napa East and Sonoma Counties
Pepperwood, Baseline Consulting, Tukman Geospatial, Thorne Environmental Landscape Analysis records going back to the early 20th century show Knobcone pine within the 1964 Nunns’ perimeter decades before that fire
It also seems quite likely that commercial species of conifer, particularly Ponderosa pine and Douglas fir, would have been planted after timber harvest occurred in Lake and perhaps in Sonoma-West as well. Boggs State Forest is currently restoring forest that was burned in the 2015 Valley fire by planting these species (CAL FIRE 2023). This effort is not reflected in the vegetation data used in this study because the most recent vegetation map for the area was made in 1993.
MAPPING HISTORICAL FIRE EXTENT and FREQUENCY
Applies to:
1) Relationship of vegetation, fire, and people; 2) Fire frequency and vegetation patterns; 3) Minimizing emissions, maximizing sequestration; 4) Tipping points for catastrophic fire; 5) Fire as a stewardship tool
Highly accurate CAL FIRE perimeters going back to the 1940s were used for the latter part of the historical record. Drawing perimeters for fires preceding the CAL FIRE era required using the data from narrative accounts in newspapers and other sources. With the exception of the Lake study area, such accounts were accessed online from the California Digital Newspaper Collection at www.cdnc.ucr.edu/
As historical newspapers for Lake county are not yet digitized, data development required visually scanning microfilm at the Lakeport Library. Because headlines were not used for Lake County newspapers before 1900, locating early fire data required visually scanning large blocks of text. The large volume of newspaper data combined with poor image quality, made it important to prioritize time periods. Consequently, most of the pre1900 period was skipped. With a few exceptions, the Lake county fire record begins in 1909.
Historical maps were essential to georeferencing early fire perimeters because old ranch names, bridge crossings and place names from the newspaper reports could be located and used for mapping on contemporary maps. Fire characteristics, including location and extent, were tabulated. A rubric for assigning confidence levels for location and extent (high, medium and low) to these historical fire polygons was developed and applied as an attribute to each perimeter (see Appendix). Each fire was also entered in a table for each study area with columns for extent, date, weather conditions (if known), and the dates of previous fires within the perimeter
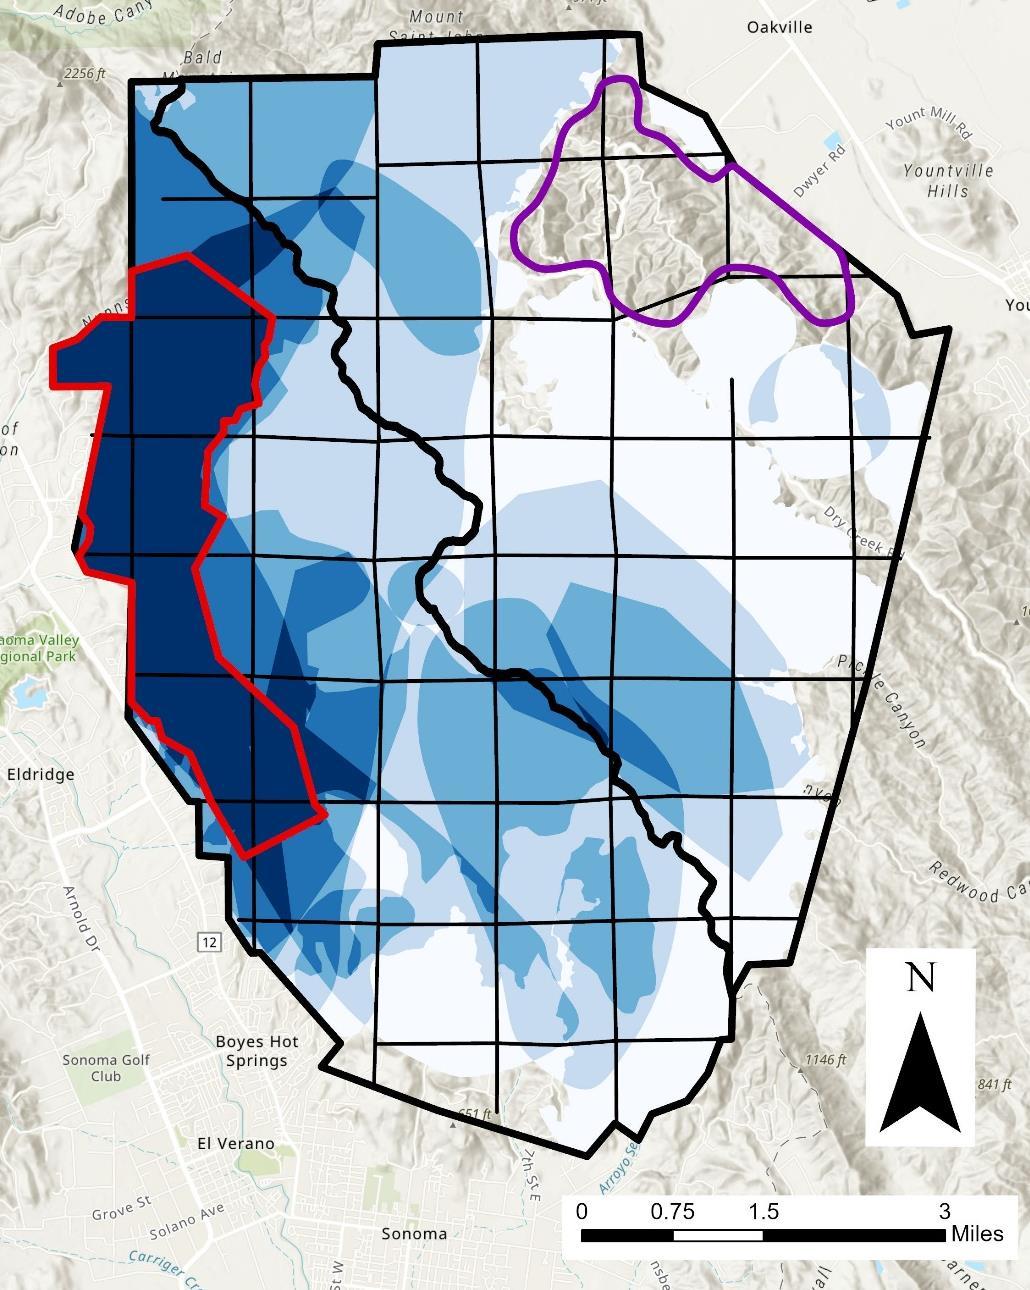
The ‘Overlay’ tool in GIS was used to create shapefiles that divided up each study area into polygons drawn according to how many times each area had burned (see ‘Fire History’ maps in ‘Selected Results’). This made the following features visible, which were classified into the following categories (one per study area):
‘Frequent Burn Zones’ (FBZs), defined and delineated according to three criteria:
1) An area that had burned substantially more often than other parts of the study area.
2) Was a single, contiguous polygon not a scattering of polygons. This allowed FBZs to be evaluated as a single landscape unit.
3) Had at least one discrete date when the whole FBZ burned, which could be used to track post-fire vegetation change over time.
‘Rare Burn Zones’(RBZs), which were delineated according to two criteria:
1) Areas that had burned less often than elsewhere in the study area (usually never).
2) Were contiguous, allowing them to be evaluated as single landscape units.
Up through the mid-20th century, ranchers sometimes burned rangeland, woodland and chapparal to clear brush and create forage for livestock (Sampson 1944). These fires were almost always undocumented unless they
Vegetation Trends and Cycles in Fire Prone Landscapes of Lake, Napa East and Sonoma Counties
Pepperwood, Baseline Consulting, Tukman Geospatial, Thorne Environmental Landscape Analysis escaped and burned a neighbor’s property. While these fires undoubtedly had some effect on the overall fire history, not enough is known to assess the effect.
Mapping Historical Timber Harvest Extent
Applies as an alternative disturbance for comparison to: 2) Fire frequency and vegetation patterns
The discovery of a 1926 map of ‘Cut-over Redwood Lands’ (Weber 1926), along with additional historical background, allowed a ‘Timber Harvest Zone’(THZ) to be delineated in the Sonoma West study area and evaluated as a separate landscape unit. The mapping of ‘Barren’ vegetation units in the Lake study area in 1950, just after a large commercial logging operation finished, suggested that this was also a ‘Timber Harvest Zone.’
MAPPING and QUANTIFYING VEGETATION RESPONSE TO FIRE and DISTURBANCE
Applies to: 1) Relationship of vegetation, fire, and people; 2) Fire frequency and vegetation patterns; 3) Minimizing emissions, maximizing sequestration; 4) Tipping points for catastrophic fire; 5) Fire as a stewardship tool
Once all the vegetation, fire, and logging data had been brought into GIS, they were integrated by using the FBZ, RBZ and THZ polygons to clip the vegetation record for each area and trace changes over time. The ‘Create Report’ tool in GIS was used to inventory these landscapes by choosing an attribute, such as vegetation alliance or similar, and directing the tool to calculate the total acreage (e.g. ‘Douglas fir Woodland, 1023 acres’ etc.). This compiled data was used to complete tables and track the changes for each study area, FBZ or other sub area (see Appendix).
Each study area and individual zone was also characterized with the ‘Summarize Elevation’ tool in GIS, which also produced measurements for slope aspect and steepness. Distance from the coast was measured from the centroid for each polygon to the nearest point on the coast. The Sonoma-Napa study area was evaluated as a whole and, for some analyses, divided into the Sonoma-Napa (Napa portion) east of the county line and the Sonoma-Napa (Sonoma portion) west of the line (the county line is on the ridge divide)
EMISSIONS and SEQUESTRATION
Applies to: 3) Minimizing emissions, maximizing sequestration
Emissions and sequestration were investigated through an extensive literature search and communications with experts in the field. Estimates were attempted based on calculated post-fire rates of vegetation change, for above and below ground biomass at various points in the fire cycle, but a lack of data prevented these from being finalized. However, the information collected suggested a general approach and qualitative answer to this question.
TIPPING POINTS FOR CATASTROPHIC FIRE (ADDENDUM)
Applies to: 4. Tipping points for catastrophic fire
As this was not included in the original research plan, we combined additional Methods as well as Results and Discussion in a separate addendum.
Despite the large number of recent catastrophic fires in Lake, Napa, and Sonoma counties, the historical fire record indicated that such fires could be expected to recur in the same places only about once every 40 - 100 years. This suggested creating criteria for ‘catastrophic fires’ based on their unusual size (‘catastrophic’ was chosen over ‘large’ to acknowledge the human impact of these conflagrations) and investigating whether one or more tipping points for these events could be identified
Vegetation Trends and Cycles in Fire Prone Landscapes of Lake, Napa East and Sonoma Counties
Pepperwood, Baseline Consulting, Tukman Geospatial, Thorne Environmental Landscape Analysis
We looked at wind speed, humidity, fuel configuration and temperature as possible tipping points. Wind speed was tracked over the course of the 2017 Nunns and Tubbs fires. Criteria was developed from the literature to identify ‘wind-driven’ fire conditions from ‘fuel-driven’ fire conditions. MODIS heat maps were used to map the fire spread during these events and ‘percent wind-driven vs. percent fuel-driven’ was calculated (below a threshold of 30 kph wind speed, humidity and temperature alone are not considered sufficient to create extreme fire behavior)
The possibility of a tipping point related to fuel configuration was investigated by estimating the percent woodland cover within these fire perimeters, based on recent vegetation maps and established rates of change.
Vegetation Trends and Cycles in Fire Prone Landscapes of Lake, Napa East and Sonoma Counties
Pepperwood, Baseline Consulting, Tukman Geospatial, Thorne Environmental Landscape Analysis
Selected Results
Since Indigenous wisdom (TEK) preserves the knowledge of fire practices and vegetation patterns which preceded modern vegetation patterns and fire regimes, a summary of conversations with Clint McKay (Wappo, Pomo, Wintun), Edward Redbird Willie (Pomo, Paiute, Wintun and Wailaki) and Sara Moncada (Yaqui/Irish) is included at the beginning of this section. It is intended to serve as a framework for considering the results of the historical research. The Appendix contains the complete notes from these contacts.
These conversations particularly inform three lines of inquiry: 1) Relationship of vegetation, fire, and people; 2) Fire frequency and vegetation patterns; 5) Fire as a stewardship tool
The maps, pie charts and tables that follow (pages 23-48), which were developed from the historical record, are arranged by study area. They provide an overview of vegetation, fire, and timber harvest patterns during the study period (c. 1870 – 2020) and primarily apply to: 1) Relationship of vegetation, fire, and people; 2) Fire frequency and vegetation patterns; 4) Tipping points for catastrophic fire.
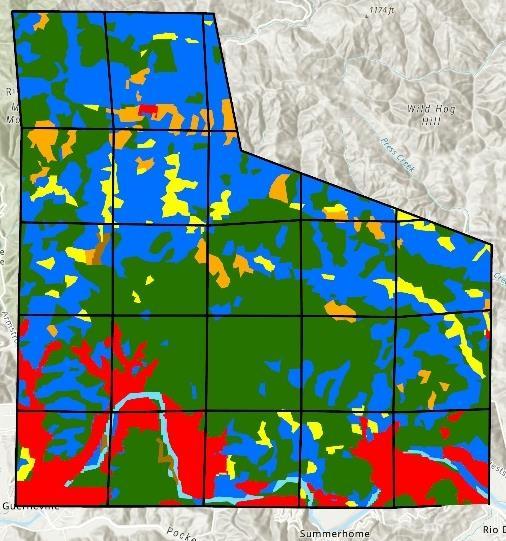
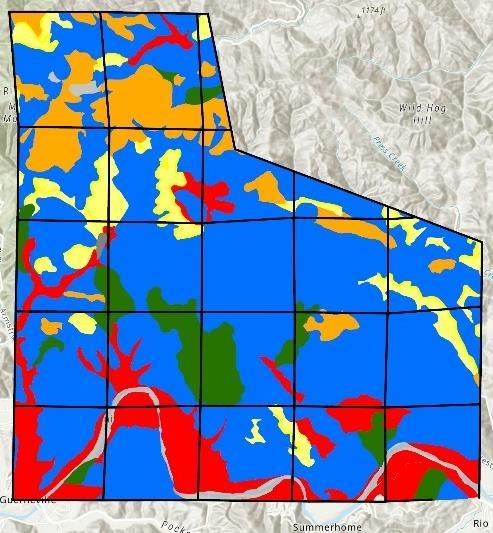
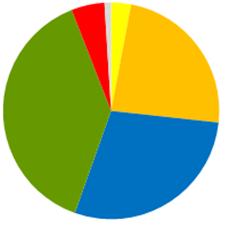
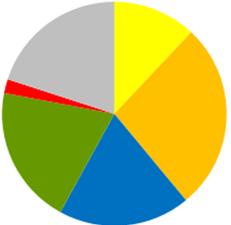
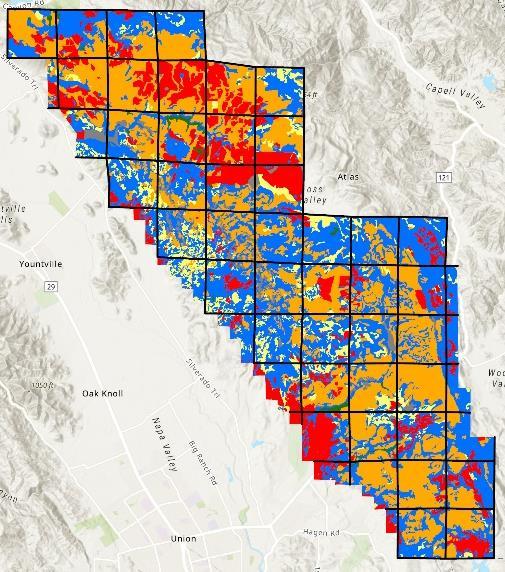
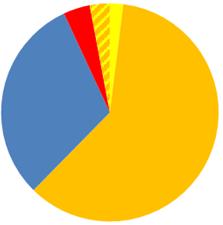
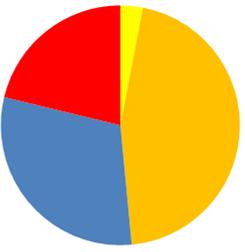
The vegetation maps are presented as four ‘snapshots,’ roughly corresponding to:
▪ Late 19th century
▪ Early to mid-20th century
▪ Late 20th century
▪ Early 21st century
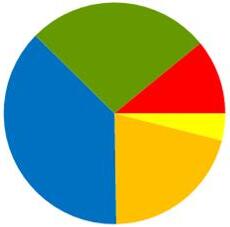
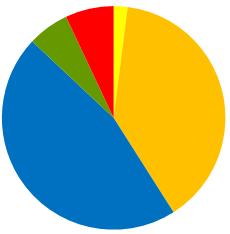
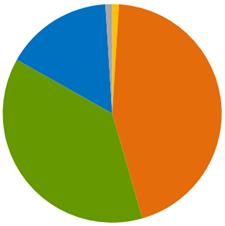
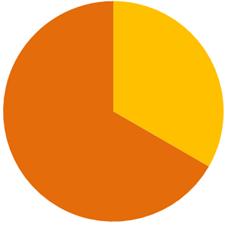
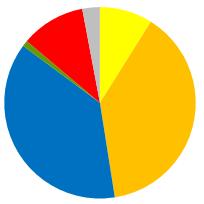
The precise years vary according to the available data. Pie charts are included to facilitate visualization of the changes and for ready comparison across time periods and between study areas.
Fire history is combined into a single map for each study area, delineating zones of different fire frequencies. Frequent Burn Zones (FBZs) and Rare Burn Zones (RBZs) are highlighted in these maps.
Timber Harvest Zones (THZs) were mapped from available sources and shown for the Lake and Sonoma West study areas.
Integrated fire and vegetation history are tracked with maps, pie charts and tables for each FBZ and RBZ. These follow the same timeline as the vegetation ‘snapshots’ mentioned above. Vegetation changes within the THZs are covered in the same way.
Calculated rates of vegetation change in response to fire and timber harvest, or in the absence of these disturbances accompany the relevant maps.
Results for the distribution of certain species, which are not covered the Selected Results, are included in the relevant Discussion sections. These species include Douglas fir, California Bay, and California Black oak.
A lack of quantitative data to fully address: “#3) Minimizing emissions, maximizing sequestration” led to it being left out of the quantitative results. However, this line of inquiry, viewed against the background of vegetation change, suggests interesting possibilities and avenues for further research.
Complete tabulated results can be found in the Appendix.
Vegetation Trends and Cycles in Fire Prone Landscapes of Lake, Napa East and Sonoma Counties
Pepperwood, Baseline Consulting, Tukman Geospatial, Thorne Environmental Landscape Analysis
Indigenous Wisdom
Key points from conversations with Clint McKay, Sara Moncada and Edward “Redbird” Willie:
• Current conditions of vegetation and catastrophic fire are the result of the land not being cared for properly.
• In Indigenous culture, fire is considered a member of the community, far older and wiser than we are.
• Cultural burning was intended to benefit all forms of life.
• Burning was a community activity.
• Burning was done for basket materials, for food and to create travel corridors between villages.
• There was no burning calendar. Close observance of the landscape indicated when to burn.
• Redbud and elderberry were burned every three or four years, after annual harvest.
• The area under a black oak might be burned every couple of years, around late Aug. This makes the acorns easier to gather when they fall, and fire also knocks back acorn worms.
• Burning encouraged the growth of plants and also kept the ground clean.
• Chaparral was tended to especially benefit deer, which use it for forage and cover. Once it gets to be six or eight feet high, it’s harder for the deer to reach the new growth, so it’s burned at that point.
• There were no particular ‘fire specialists.’ Everyone tended the resources they were going to use. Basket weavers burned willows and sedges. Hunters burned chaparral, particularly chamise and leather oak, to provide forage for the deer they were going to hunt.
• The landscape was tended on a small scale. A couple people could handle a burn under a Black oak when conditions were right. An August burn required waiting for a morning with “a little mist, a little dew on the leaves.”
• Larger areas of up to a couple hundred acres were also burned. Travel corridors exceeded this size.
• Cultural burns were started at the bottom of hills and burned toward the top. Ridgetops make a natural fire break. CAL FIRE’s controlled burns are the opposite and backlit downhill.
• The way Traditional Ecological Knowledge looks on the ground may sometimes feel at odds with how it seems when it’s more hypothetical.
• Before contact, there were more oak woodlands and savannah. Douglas fir were on the peaks and ridges. California Bays were in the low places, not canyons exactly, but little drainages that were a little cooler than the surrounding area.
• The decline of cultural burning happened seven generations back counting from the current younger generation.
Complete notes in the Appendix.
Vegetation Trends and Cycles in Fire Prone Landscapes of Lake, Napa East and Sonoma Counties
Pepperwood, Baseline Consulting, Tukman Geospatial, Thorne Environmental Landscape Analysis
Historical Record
Selected results from the historical research, including maps, pie charts and tables are shown on the following pages (23-48). The map below is identical to the one on page 12 and is included here for ease of reference.
Vegetation Trends and Cycles in Fire Prone Landscapes of Lake, Napa East and Sonoma Counties
Pepperwood, Baseline Consulting, Tukman Geospatial, Thorne Environmental Landscape Analysis
Vegetation Trends and Cycles in Fire Prone Landscapes of Lake, Napa East and Sonoma Counties

Pepperwood, Baseline Consulting, Tukman Geospatial, Thorne Environmental Landscape Analysis


Vegetation Trends and Cycles in Fire Prone Landscapes of Lake, Napa East and Sonoma Counties


Pepperwood, Baseline Consulting, Tukman Geospatial, Thorne Environmental Landscape Analysis

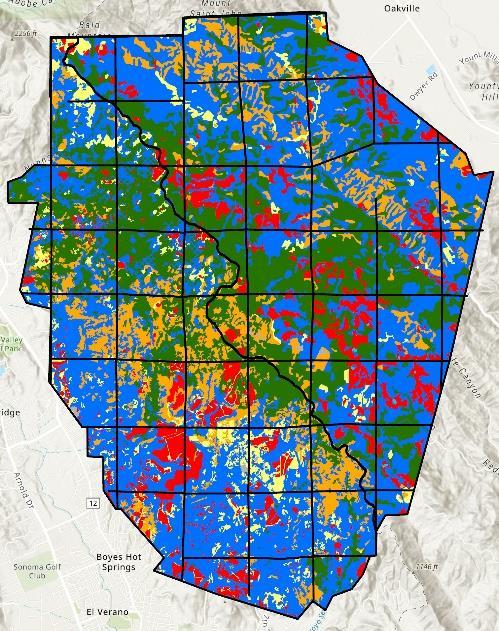
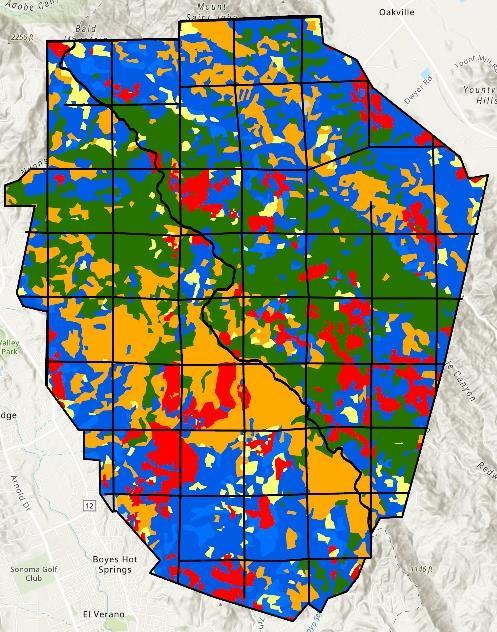
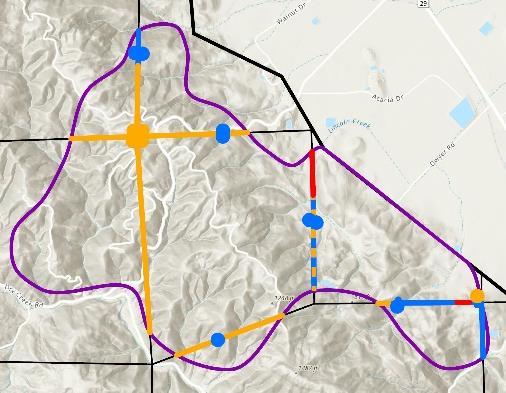
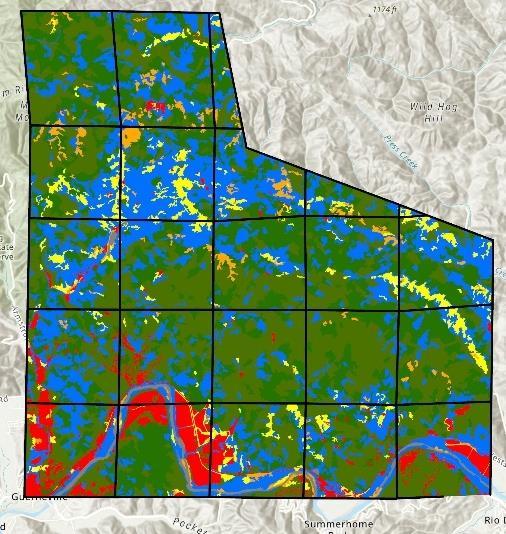
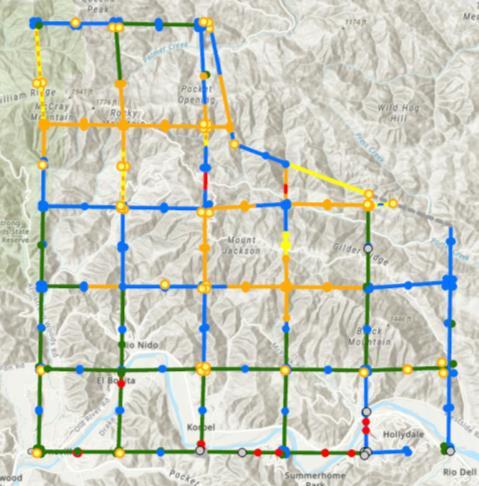
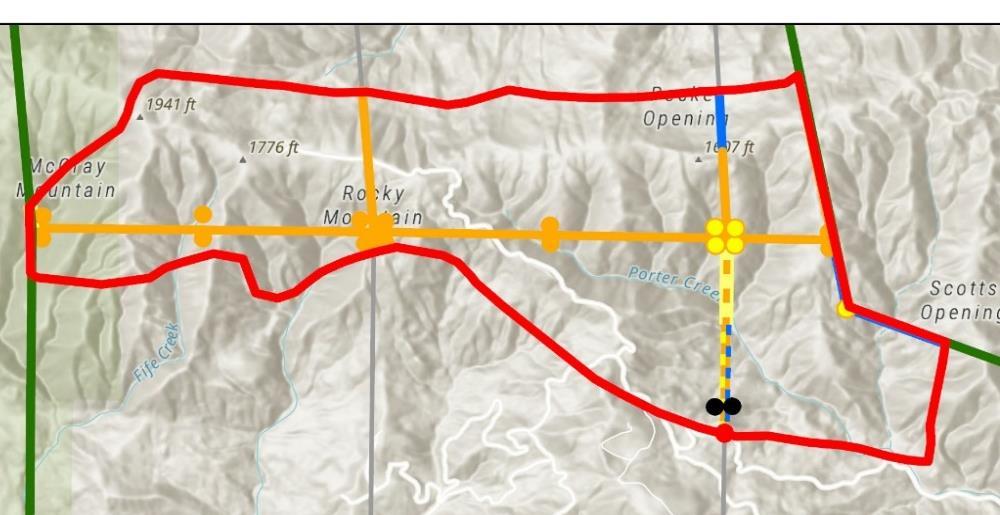
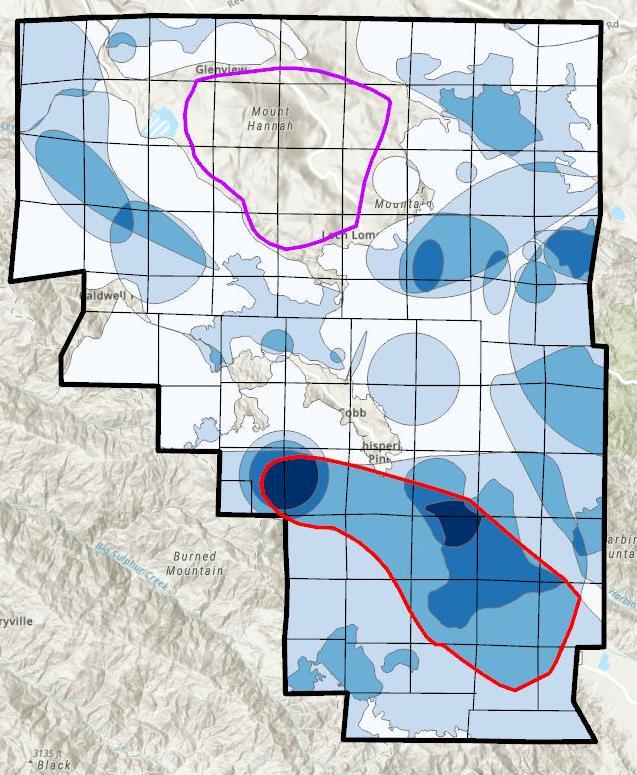
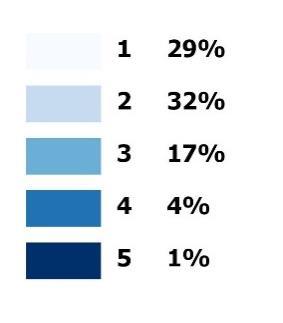
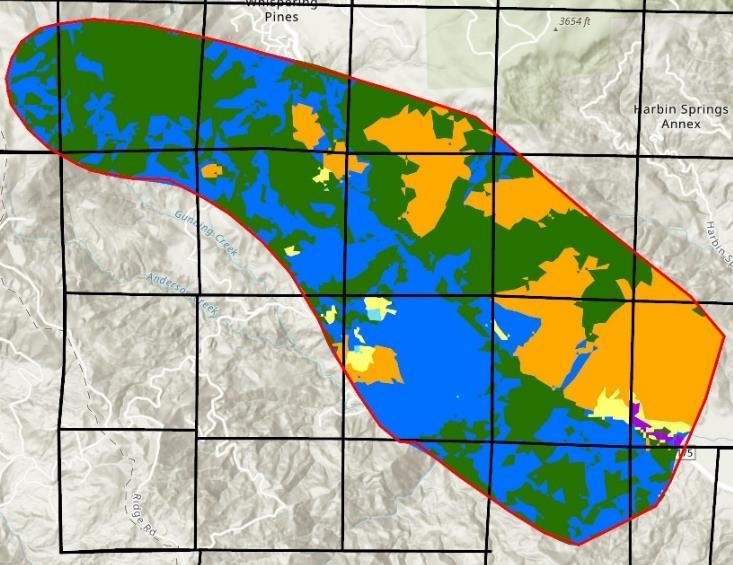
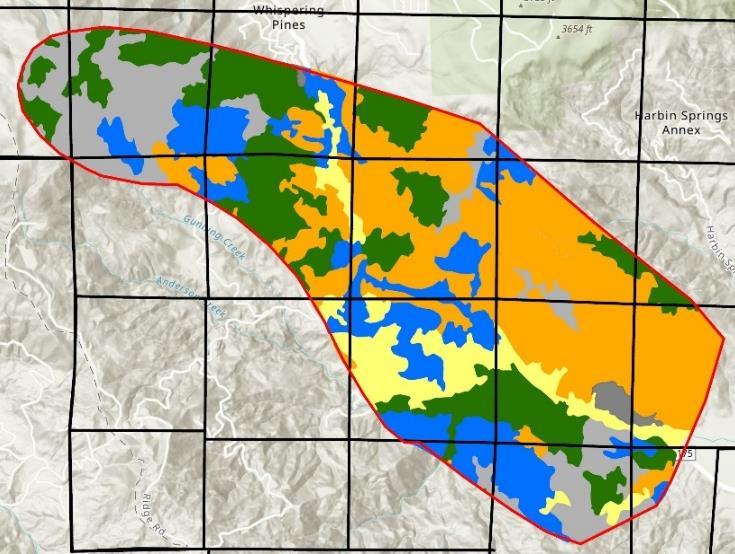
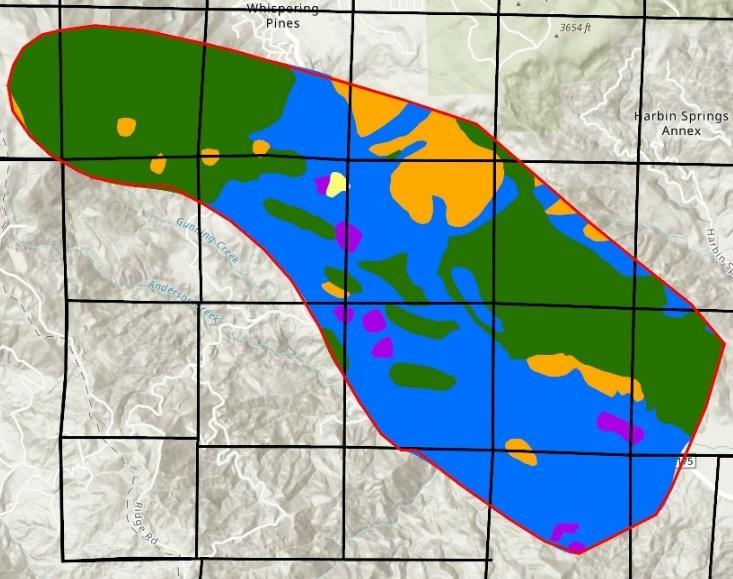
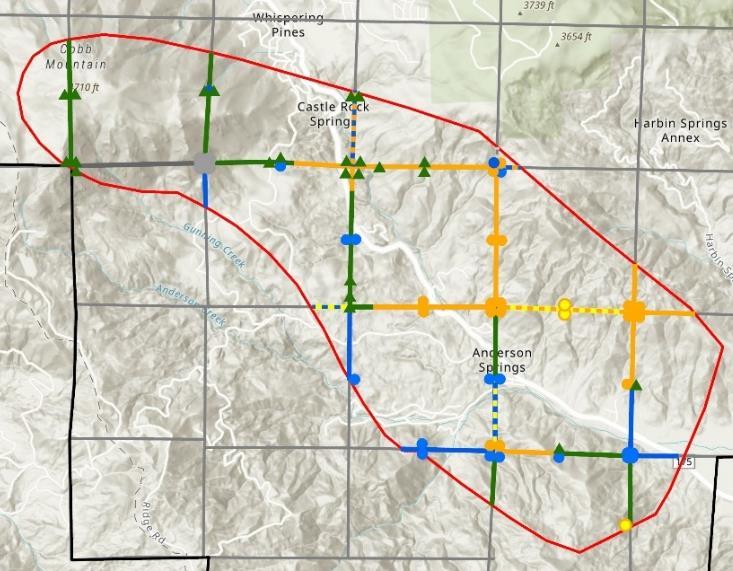
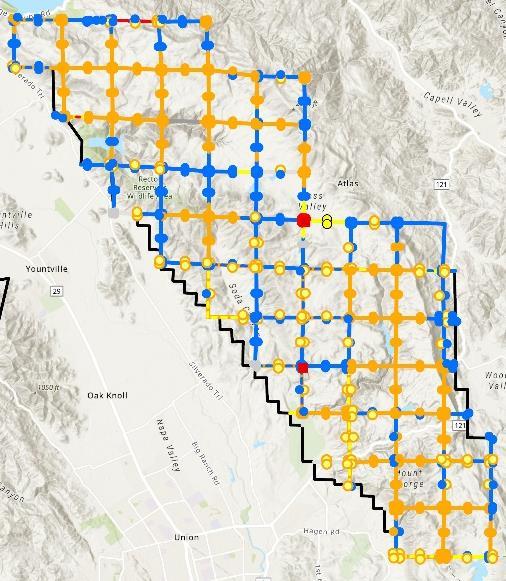
Figure 4. Sonoma-Napa Study Area, Fire History:
Documented Fires—1870 - 2020
Average Fire Return Intervals within known fire perimeters (areas without documented fires not included in calculations)
Whole Study Area: 52.9 years, median = 42.0 years
1-2 fires average
Frequent Burn Zone: 28.6 years, median = 28.0 years
4-5 fires average
Napa County: 53.4 years, median = 35.0 years
1-2 fires average
Sonoma County: 55.1 years, median = 44.0 years
2-3 fires average
Township & Range Lines: 1 mile x 1 mile grid
Vegetation Trends and Cycles in Fire Prone Landscapes of Lake, Napa East and Sonoma Counties
Pepperwood, Baseline Consulting, Tukman Geospatial, Thorne Environmental Landscape Analysis
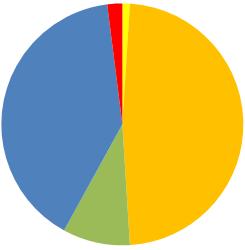
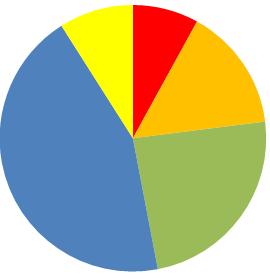
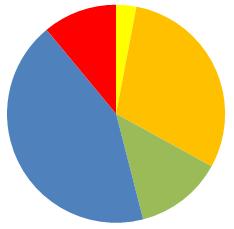
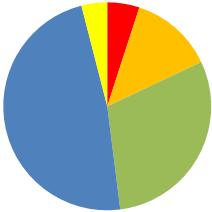
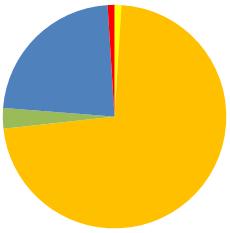
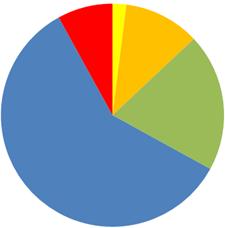
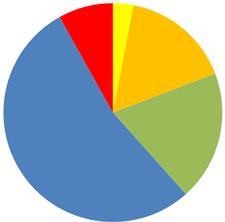
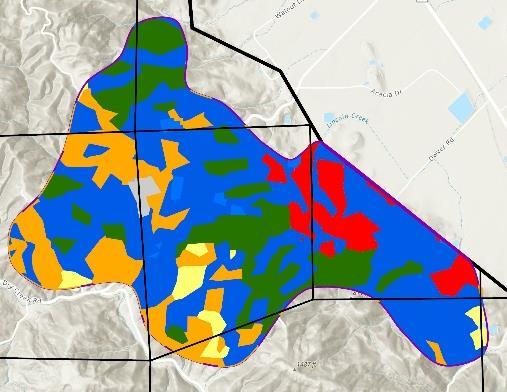
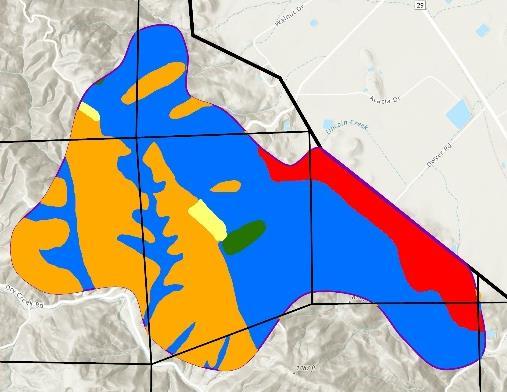
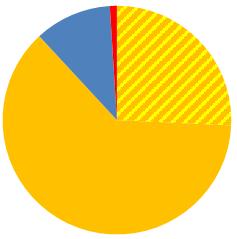
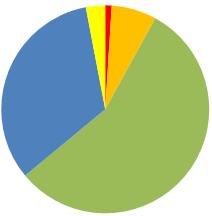
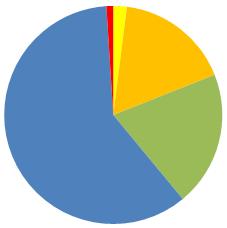
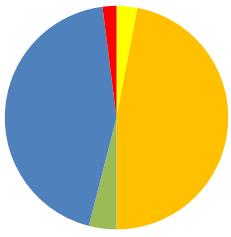
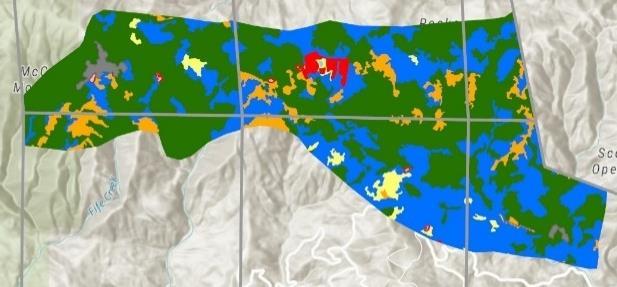
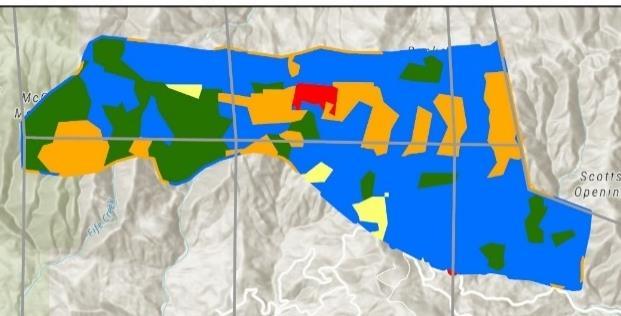
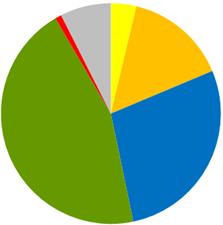
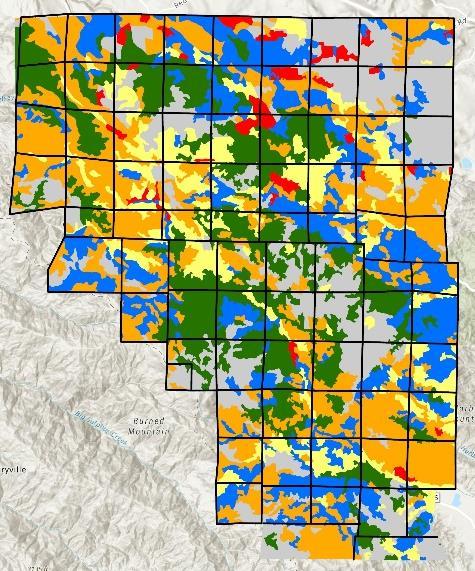
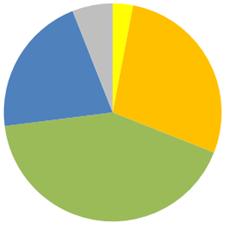
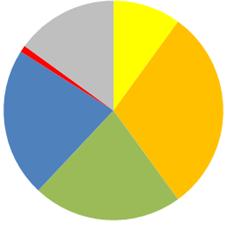
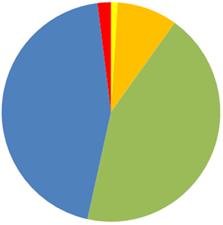
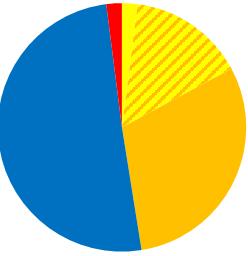
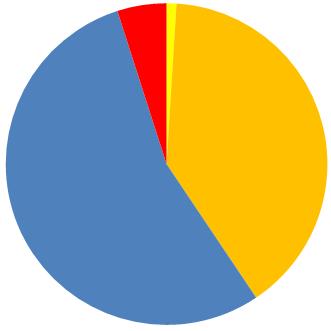
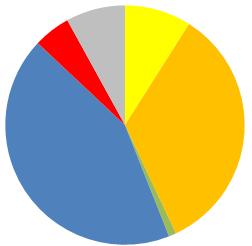
Herbaceous Shrub Hardwood Conifer Human c. 1877: Fire history unknown
1932: 9 years post fire
1993: 29 years post fire
2013: 49 years post fire
DATES OF LARGE FIRES: RED = 100% FBZ burned. * only 20 acres were in the FBZ


Vegetation Trends and Cycles in Fire Prone Landscapes of Lake, Napa East and Sonoma Counties

Pepperwood, Baseline Consulting, Tukman Geospatial, Thorne Environmental Landscape Analysis

Vegetation Trends and Cycles in Fire Prone Landscapes of Lake, Napa East and Sonoma Counties
Pepperwood, Baseline Consulting, Tukman Geospatial, Thorne Environmental Landscape Analysis
Vegetation Trends and Cycles in Fire Prone Landscapes of Lake, Napa East and Sonoma Counties

Pepperwood, Baseline Consulting, Tukman Geospatial, Thorne Environmental Landscape Analysis

Vegetation Trends and Cycles in Fire Prone Landscapes of Lake, Napa East and Sonoma Counties
Pepperwood, Baseline Consulting, Tukman Geospatial, Thorne Environmental Landscape Analysis
Vegetation Trends and Cycles in Fire Prone Landscapes of Lake, Napa East and Sonoma Counties


Pepperwood, Baseline Consulting, Tukman Geospatial, Thorne Environmental Landscape Analysis
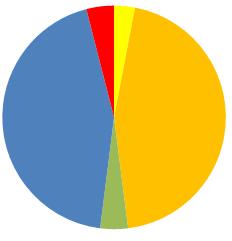
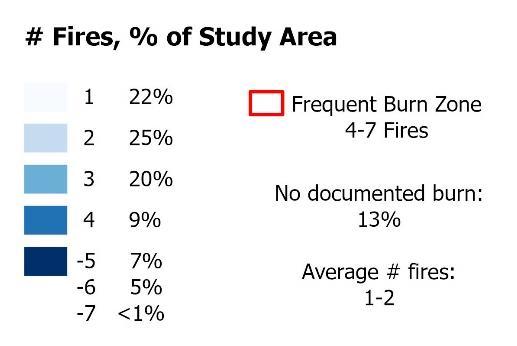
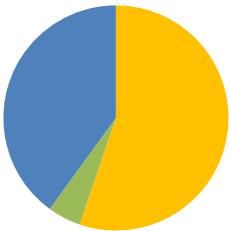
# Fires, % of Study Area
Average Fire Return Intervals within known fire perimeters (areas without documented fires not included in calculations)
Whole Study Area: 36.4 years, median = 27.0 years
1-2 fires average
Frequent Burn Zone: 26.4 years, median = 43.5 years
3-4 fires average
Timber Harvest Zone 50.0 years, median = 45.0 years
<1 fire average
Vegetation Trends and Cycles in Fire Prone Landscapes of Lake, Napa East and Sonoma Counties
Pepperwood, Baseline Consulting, Tukman Geospatial, Thorne Environmental Landscape Analysis
Vegetation Trends and Cycles in Fire Prone Landscapes of Lake, Napa East and Sonoma Counties
Pepperwood, Baseline Consulting, Tukman Geospatial, Thorne Environmental Landscape Analysis

Vegetation Trends and Cycles in Fire Prone Landscapes of Lake, Napa East and Sonoma Counties
Pepperwood, Baseline Consulting, Tukman Geospatial, Thorne Environmental Landscape Analysis
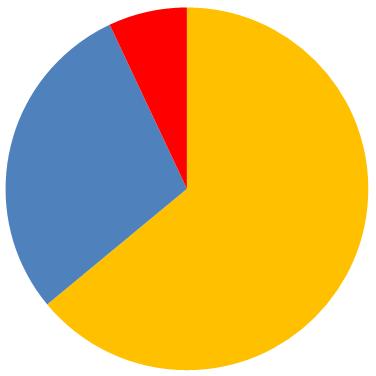
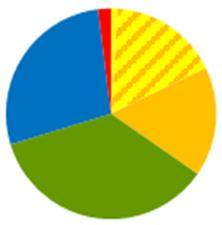
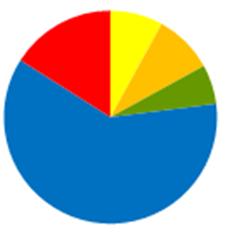
Figure 10. Sonoma West Timber Harvest Zone (THZ): Intensive Logging, c. 1875 – 1915
Note: this zone includes the Rare Burn Zone for the Sonoma West study area. Because timber harvest was a significant disturbance, this zone is being evaluated through that lens rather than as a Rare Burn Zone (RBZ).


Vegetation Trends and Cycles in Fire Prone Landscapes of Lake, Napa East and Sonoma Counties
Pepperwood, Baseline Consulting, Tukman Geospatial, Thorne Environmental Landscape Analysis c.
Pre-intensive harvest
1993: 80 – 120 Years post harvest
Intensive Logging c.
50-90 Years post harvest
2013: 100 – 140 Years post harvest
Vegetation Trends and Cycles in Fire Prone Landscapes of Lake, Napa East and Sonoma Counties

Pepperwood, Baseline Consulting, Tukman Geospatial, Thorne Environmental Landscape Analysis
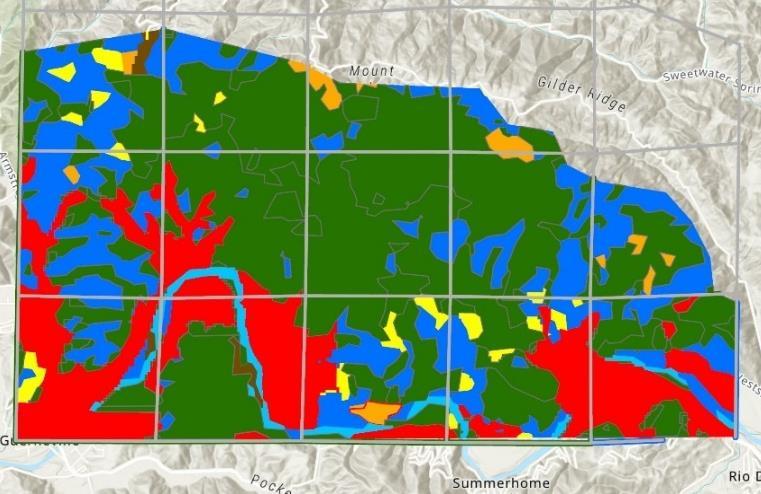
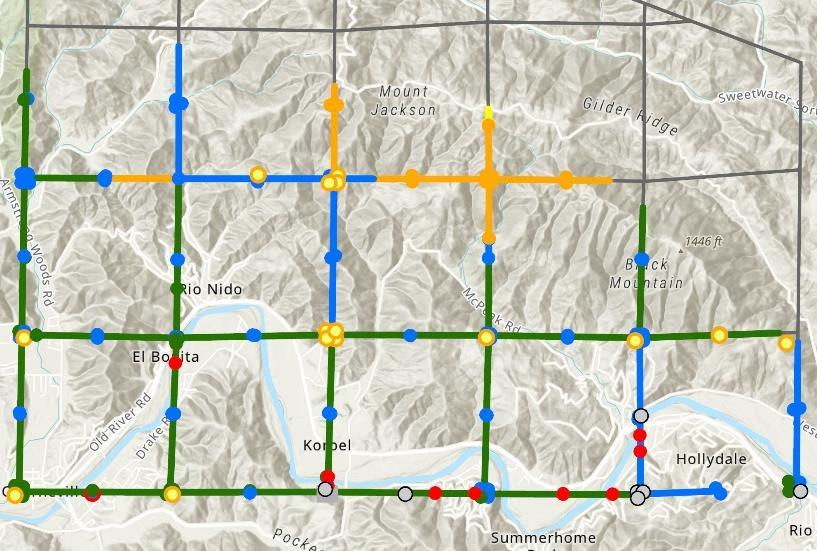
Table 7. Sonoma West, THZ, Lifeform Cover by Date and Rate of Change
Vegetation Trends and Cycles in Fire Prone Landscapes of Lake, Napa East and Sonoma Counties
Pepperwood, Baseline
Tukman Geospatial, Thorne Environmental Landscape Analysis
Vegetation Trends and Cycles in Fire Prone Landscapes of Lake, Napa East and Sonoma Counties


Pepperwood, Baseline Consulting, Tukman Geospatial, Thorne Environmental Landscape Analysis


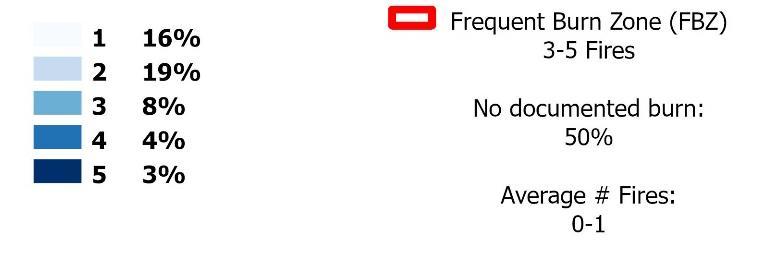
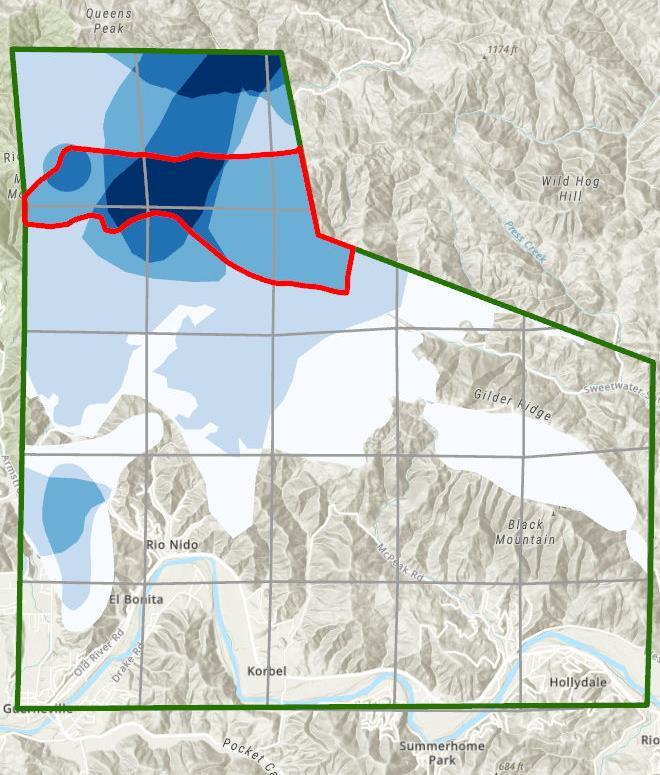
Frequent Burn Zone (FBZ) 3-5 Fires
No documented burn: 16%
Average # fires: 2-3
Rare Burn Zone (RBZ) 0 fires
Average Fire Return Intervals within known fire perimeters
(areas without documented fires not included in calculations)
Whole Study Area: 39.0 years, median = 29.0 years
1-2 fires average
Frequent Burn Zone: 26.4 years, median = 26.0 years
3-4 fires average
Vegetation Trends and Cycles in Fire Prone Landscapes of Lake, Napa East and Sonoma Counties
Pepperwood, Baseline Consulting, Tukman Geospatial, Thorne Environmental Landscape Analysis
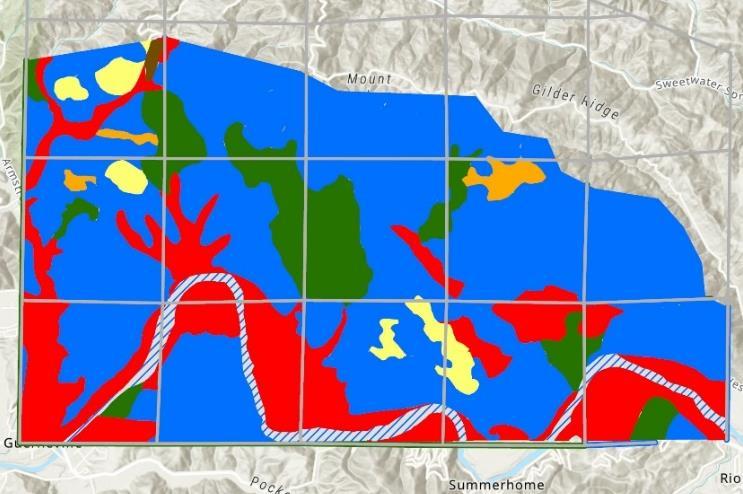
MAJOR FIRES in: 1874, 1909, 1915, 1922, 1944, 1951, 2015 (Red = 100% FBZ burned)
No data, Barren or Other c. 1873: fire history unknown c.1950: 6 years post fire

Vegetation Trends and Cycles in Fire Prone Landscapes of Lake, Napa East and Sonoma Counties
Pepperwood, Baseline Consulting, Tukman Geospatial, Thorne Environmental Landscape Analysis
Township & Range Lines 1 mile x 1 mile grid
1928: 19 years post fire c.1873: Fire
History unknown
1928: 19 years post fire
1993: 49 years post fire
Vegetation Trends and Cycles in Fire Prone Landscapes of Lake, Napa East and Sonoma Counties
Pepperwood, Baseline Consulting, Tukman Geospatial, Thorne Environmental Landscape Analysis

Vegetation Trends and Cycles in Fire Prone Landscapes of Lake, Napa East and Sonoma Counties

Pepperwood, Baseline Consulting, Tukman Geospatial, Thorne Environmental Landscape Analysis

Table 9. Lake Study Area, RBZ, Lifeform Cover by Date and Rate of Change
Vegetation Trends and Cycles in Fire Prone Landscapes of Lake, Napa East and Sonoma Counties
Pepperwood, Baseline Consulting, Tukman Geospatial, Thorne Environmental Landscape Analysis
Herbaceous or Shrub (uncertain)
17. Napa
Study Area, Vegetation Lifeforms, 1863-2016
No data, Barren or Other


Township & Range Lines 1 mile x 1 mile grid
Vegetation Trends and Cycles in Fire Prone Landscapes of Lake, Napa East and Sonoma Counties
Pepperwood, Baseline Consulting, Tukman Geospatial, Thorne Environmental Landscape Analysis


Documented Fires: 1879-2020
Average Fire Return Intervals within known fire perimeters (areas without documented fires not included in calculations)
Whole Study Area: 38.6 years, median = 38.0 years
2-3 fires average
Frequent Burn Zone: 26.8 years, median = 24 years

4-5 fires average
Rare Burn Zone: 68 years, median = 68 years
1-2 documented fires
Vegetation Trends and Cycles in Fire Prone Landscapes of Lake, Napa East and Sonoma Counties
Pepperwood, Baseline Consulting, Tukman Geospatial, Thorne Environmental Landscape Analysis

Vegetation Trends and Cycles in Fire Prone Landscapes of Lake, Napa East and Sonoma Counties
Pepperwood, Baseline Consulting, Tukman Geospatial, Thorne Environmental Landscape Analysis
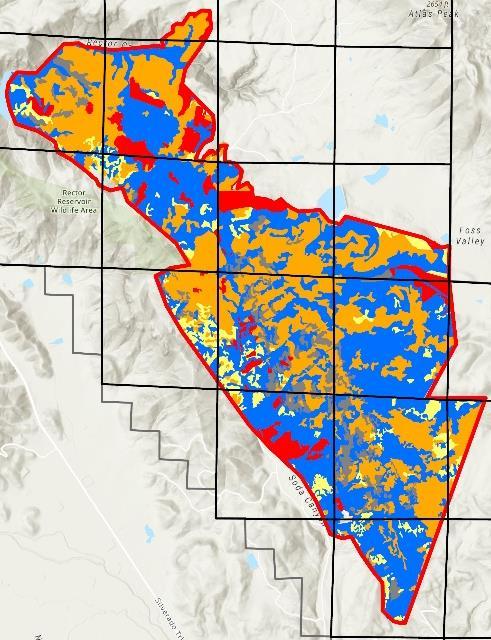
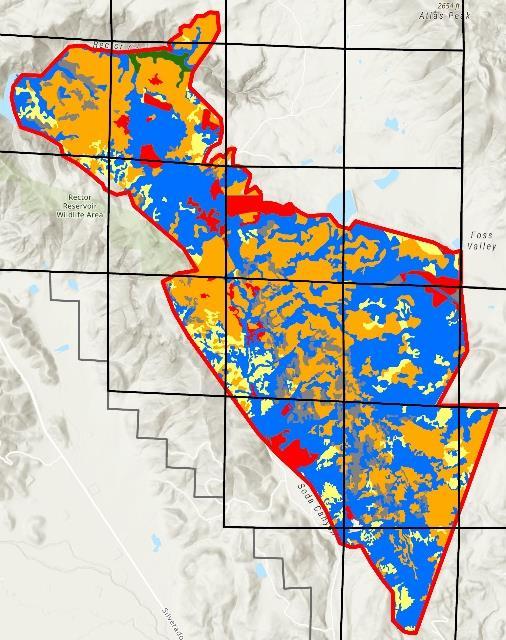
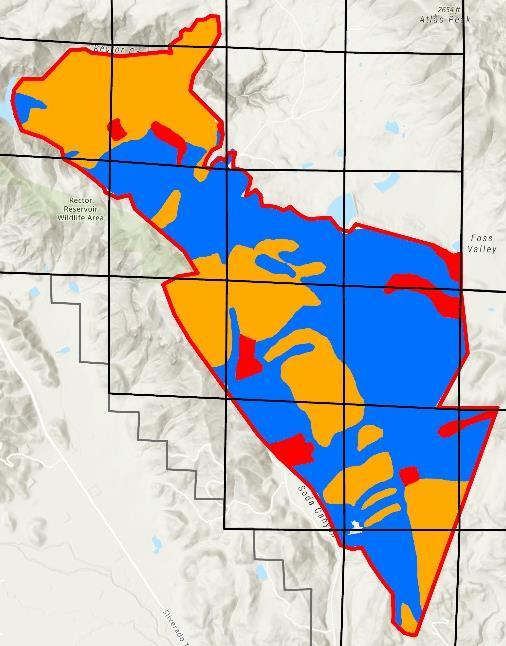

Table 10. Napa East, FBZ, Lifeform Cover by Date and Rate of Change
Vegetation Trends and Cycles in Fire Prone Landscapes of Lake, Napa East and Sonoma Counties
Pepperwood, Baseline Consulting, Tukman Geospatial, Thorne Environmental Landscape Analysis
Vegetation Trends and Cycles in Fire Prone Landscapes of Lake, Napa East and Sonoma Counties


Pepperwood, Baseline Consulting, Tukman Geospatial, Thorne Environmental Landscape Analysis

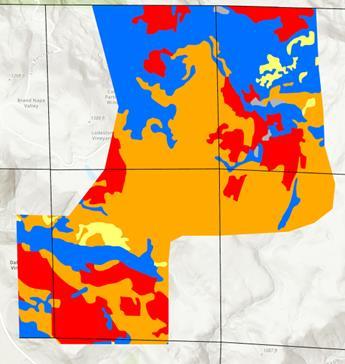
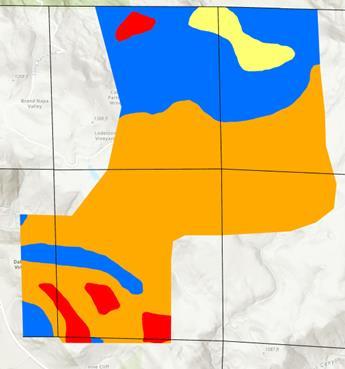
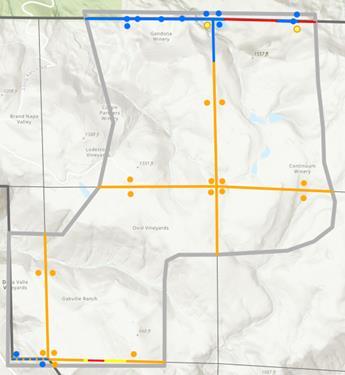
Table 11. Napa East, RBZ, Lifeform Cover by Date and Rate of Change
Vegetation Trends and Cycles in Fire Prone Landscapes of Lake, Napa East and Sonoma Counties
Pepperwood, Baseline Consulting, Tukman Geospatial, Thorne Environmental Landscape Analysis
