ALTERNATIVE VIEWPOINTS ON CALIFORNIA POLICY
Alternate Viewpoints on California Policy is a research initiative of the Pepperdine School of Public Policy in partnership with the respected California-based economic research firm, Beacon Economics. Through the collaboration on a series of white papers, the Beacon Economics’ team and the School of Public Policy’s academic researchers and graduate students will explore vital California policy issues and debates from a different perspective in the hopes of driving balanced debates. The ultimate goal of this research is to steer our common policy narratives towards more data-based understandings, in turn shining light on the kinds of public policies needed to return our state and its many regions to its longstanding position as the nation’s “growth engine.”
Learn more at publicpolicy.pepperdine.edu/institutes-initiatives/alternative-viewpoints-research-initiative.htm
ABOUT BEACON ECONOMICS
Founded in 2006, Beacon Economics, an LLC and certified Small Business Enterprise with the state of California, is an independent research and consulting firm dedicated to delivering accurate, insightful, and objectively based economic analysis. Employing unique proprietary models, vast databases, and sophisticated data processing, the company’s specialized practice areas include sustainable growth and development, real estate market analysis, economic forecasting, industry analysis, economic policy analysis, and economic impact studies. Beacon Economics equips its clients with the data and analysis they need to understand the significance of on-the-ground realities and to make informed business and policy decisions.
Learn more at beaconecon.com
ABOUT THE PEPPERDINE SCHOOL OF PUBLIC POLICY
The Pepperdine School of Public Policy, exists as one of America’s few graduate public policy schools rooted in the protection and promotion of America’s founding principles including free markets, limited and responsive government, and moral civic leadership. The Masters of Public Policy, customizable with five specializations, prepares future policy leaders for influential careers in government, at all levels, as well as the policy-related business and nonprofit sectors. The degree is widely recognized for its distinctive liberal arts curriculum that balances a rigorous study of philosophy and history with cutting edge skills in quantitative economics and policy analysis.
Learn more at publicpolicy.pepperdine.edu
This report was made possible through support from the California Apartment Association.
PROJECT TEAM
Christopher Thornberg, PhD Founding Partner (Project Advisor)
Justin Niakamal Research Manager
Niree Kodaverdian, PhD Research Manager
For further information about this report or to learn more about Alternate Viewpoints on California Policy please contact:
Sherif Hanna Managing Partner sherif@beaconecon.com
Lena Pacifici Director of Marketing and Communications lena.pacifici@pepperdine.edu
Victoria Bond Director of Marketing and Communications victoria@beaconecon.com
Alternate Viewpoints on California Policy shall remain the exclusive owner of any Proprietary Information and all patent, copyright, trade secret, trademark, domain name and other intellectual property contained herein.

Media coverage often paints a grim picture of California’s rental market but is that the full story? This report uses data to take a closer look at how renters across the state are actually doing. We begin with a quick statewide overview of renters and then explore three key areas for 22 counties:
1) State of the Market
2) State of Renters
3) State of the Stock
The State of Renters in California

Renter incomes in California have grown significantly. Even after adjusting for inflation and subtracting rent, household income has increased by 38% over the past decade compared to just 22% for renters nationwide.
Household composition is shifting as well. The share of single-person renter households in California has increased by about 2 percentage points over the past decade, reflecting a broader trend toward smaller household sizes.
Rent burden has remained stable overall. For all renters, the median share of income spent on rent has held steady over the past decade. Among multi-person renter households, rent burden has actually declined slightly from 32% in 2013 to 30% in 2023 pointing to modest improvements in affordability for shared households.
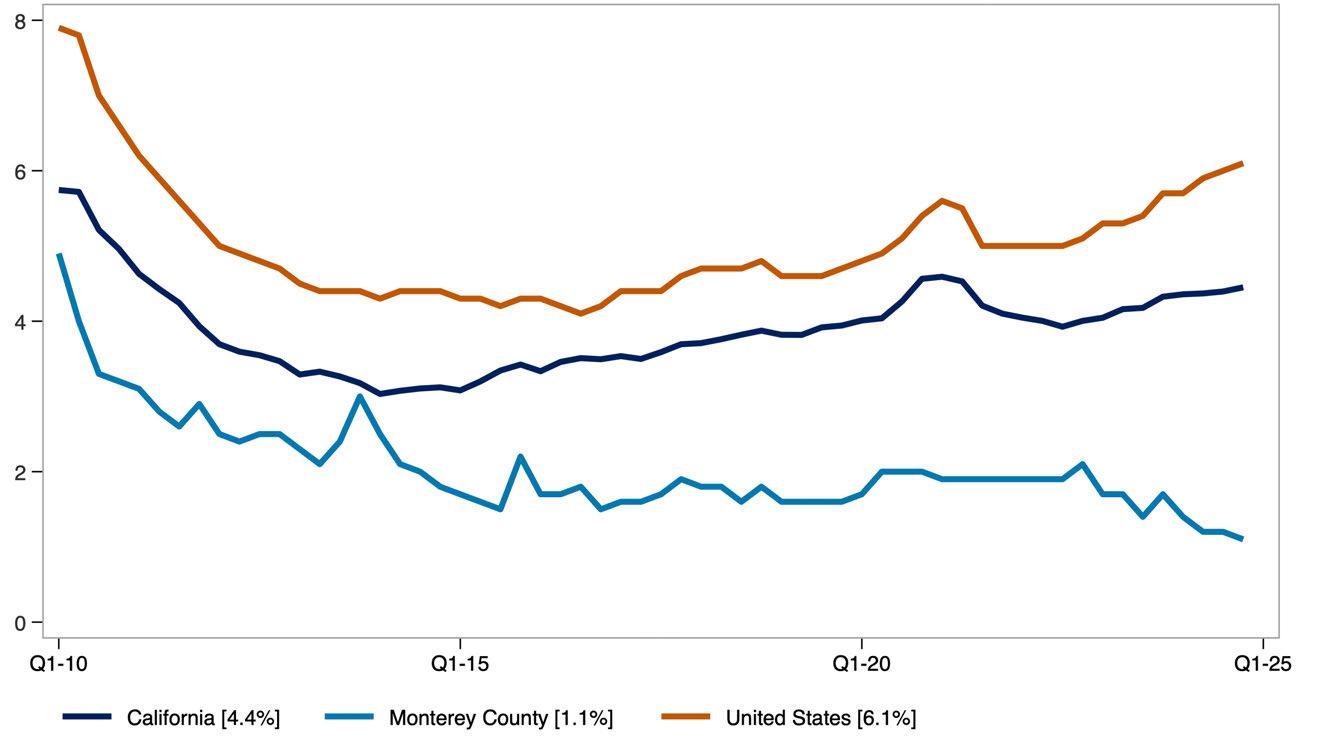
Share of Renters Late on Rent, California and Select Metros
Source: U.S. Census Bureau Household Pulse Survey Data. Analysis by Beacon Economics.
The share of renter households late on rent serves as a key indicator of financial distress over time. In California, this share has steadily declined since 2021—suggesting that, despite high housing costs, more renters are managing to stay current than many might expect.
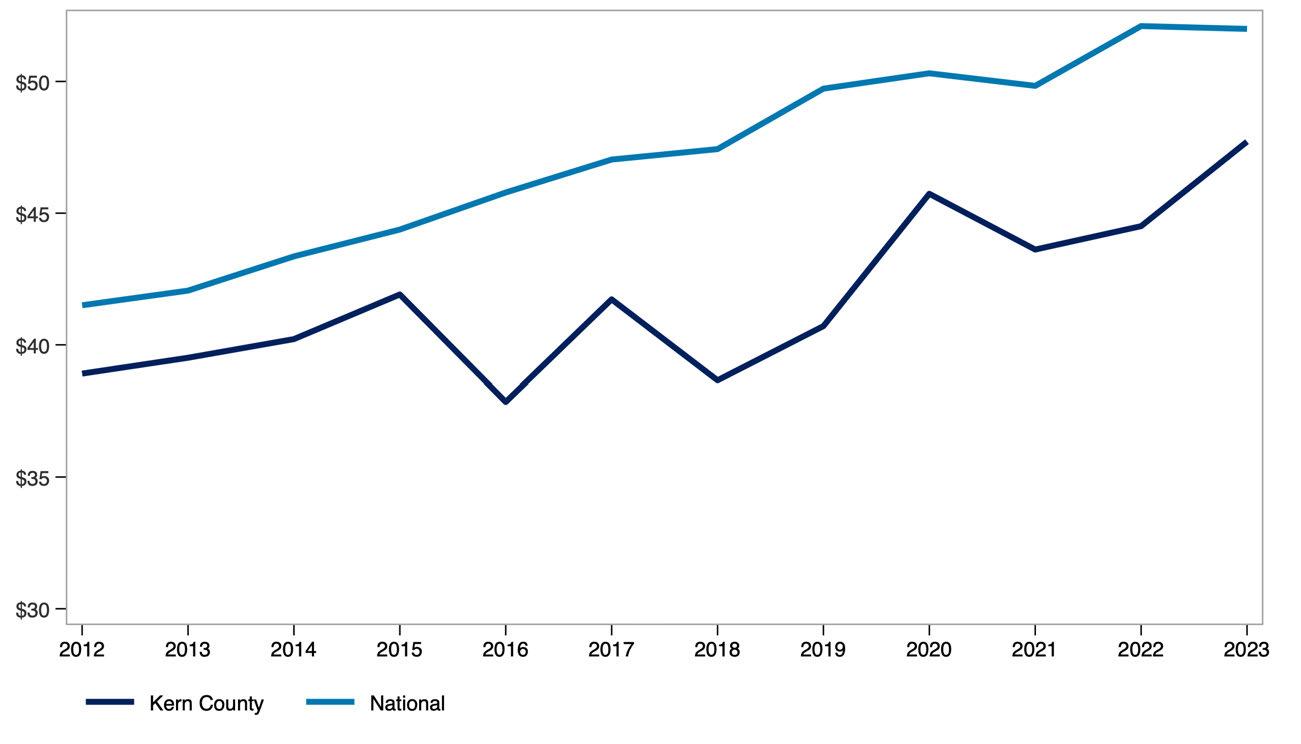
Real median renter household income, adjusted for inflation and indexed to the year 2000, shows how renter incomes have changed in purchasing power over time. In California, renters have seen notable real income growth, with median income reaching 18% above the national average by 2024.
Indexed Real Median Renter Household Income, California
Real post-rent income, adjusted for inflation, captures what renter households have left after paying rent, offering a clearer picture of financial stability than gross income alone.
The rent-to-income ratio shows the degree of rent burden renters face. Between 2018 and 2023, California’s rent-to-income ratio remained relatively stable, while it rose nationally signaling worsening rent burdens across the U.S. overall. However, rental stock in California grew more slowly than the U.S. average over this period.
and Select Metros
Source: U.S. Census Bureau, American Community Survey (ACS) 1-Year Estimates, Public Use Microdata Sample (PUMS). Analysis by Beacon Economics.
Annual rent inflation, measured by the Consumer Price Index (CPI) for rent of primary residence, reflects changes in the cost of renting over time. Both California and the U.S. experienced a surge in rent inflation from 2021 to 2022, but the pace has since moderated. Overall, rent inflation in California has generally tracked with or remained below the national average.
Consumer Price Index: Rent of Primary Residence, California
Source: U.S. Bureau of Labor Statistics. Analysis by Beacon Economics.
Asking rents for multifamily units reflect current market prices, while contract rents capture what tenants are actually paying. When adjusted for inflation measured in real terms both indicators show that California’s rent premium over the national average has narrowed since peaking around 2019. Real asking rents have also declined, signaling some recent softening in market conditions.
Real Average Asking Rents for MF Units
Real Median Contract Rents for All Units
Source: Moody’s Analytics, U.S. Census Bureau, American Community Survey (ACS) 1-Year Estimates (2016–2019, 2021–2023) and 5-Year Estimates (2020). Analysis by Beacon Economics.
Ratio of CA:US
The rental vacancy rate the share of rental units that are unoccupied and available offers insight into housing supply conditions. California’s vacancy rate has remained consistently lower than the national average, indicating tighter housing supply. Low vacancy is a common sign of undersupply and is often linked to upward pressure on rents.
Rental Vacancy Rates, California
Source: U.S. Census Bureau, retrieved from FRED. Analysis by Beacon Economics.
Renter occupancy rates for multifamily and single-family units reflect the share of each housing type occupied by renters. In California, multifamily renter occupancy has remained consistently high, while renter occupancy of single-family homes has declined over time.
Share of Units Occupied by Renters, California
Source: U.S. Census Bureau, American Community Survey (ACS) 1-Year Estimates. Analysis by Beacon Economics.
California’s rental market has shown signs of resilience in recent years: renter incomes are rising faster than the national average, rent burdens have held steady, and fewer renters are falling behind despite tight supply and high costs.
The State of Renters in Alameda County
Renter incomes in Alameda County have grown significantly. Even after adjusting for inflation and subtracting rent, household income has increased by 45.4% over the past decade compared to 21.4% for renters nationwide.
Household composition is shifting as well. The share of single-person renter households in Alameda County has decreased by 0.3 percentage points over the past decade, reflecting a broader trend toward larger household sizes.
Rent burden has remained stable overall. For all renters, the median share of income spent on rent has held steady over the past decade. Among multi-person renter households, rent burden has declined from 26.2% in 2013 to 24.8% in 2023 pointing to modest improvements in affordability for shared households.
STATE OF THE MARKET: COUNTY OF ALAMEDA
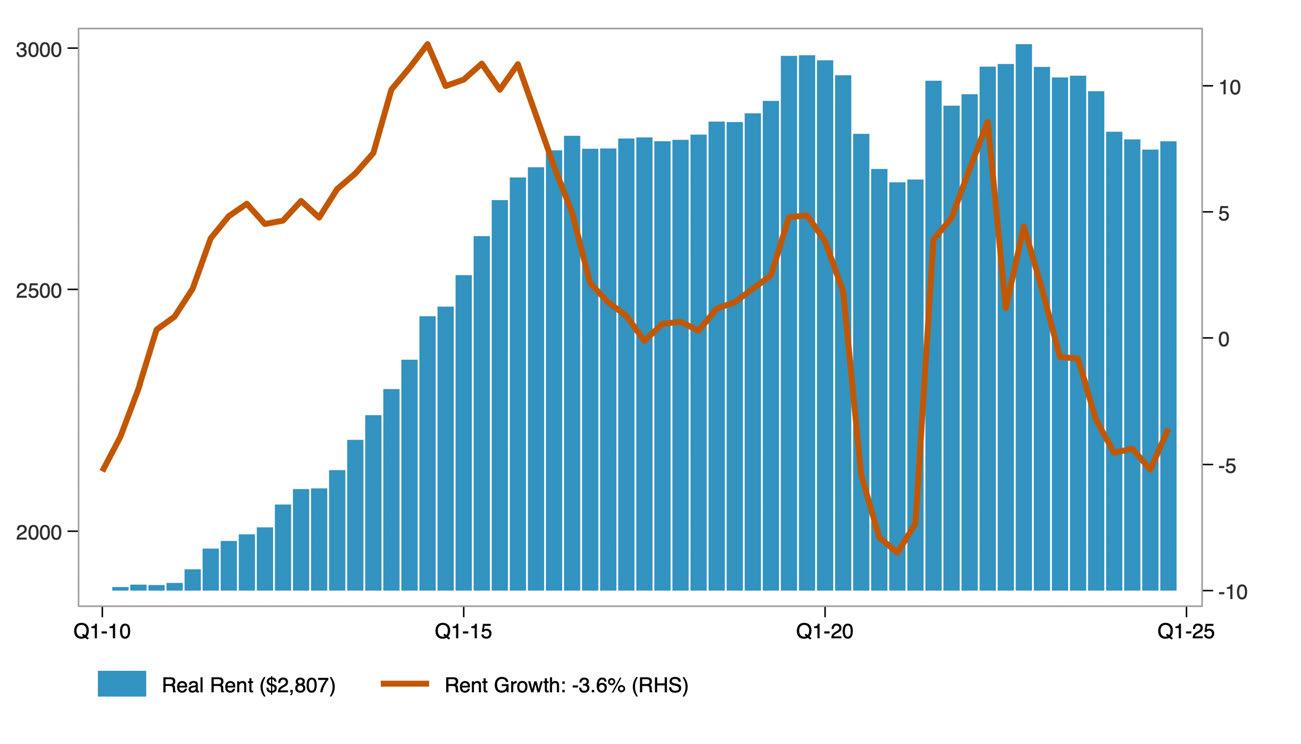
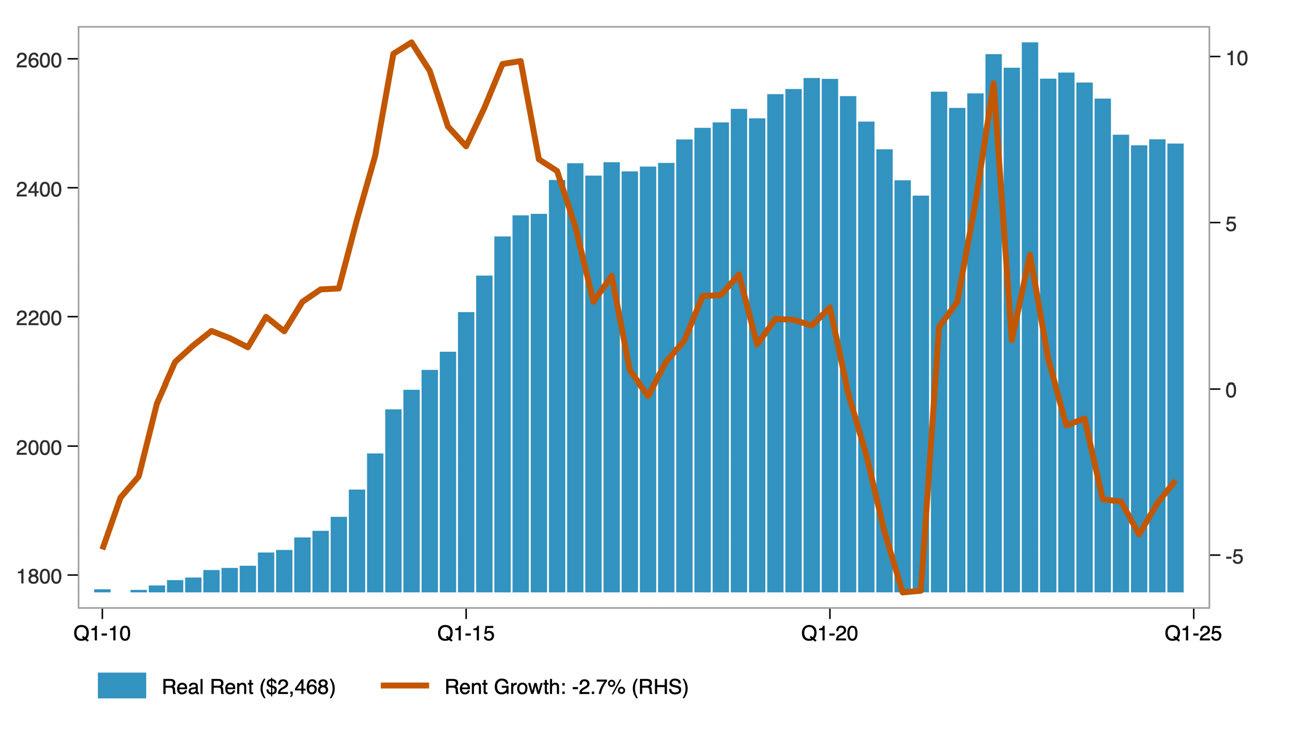
Asking rent represents the price landlords list for vacant units, rather than what current tenants are paying. When adjusted for inflation, it provides insight into how advertised rents have changed in real terms.
The year-over-year rent growth rate captures the pace at which rents are rising or falling. Together, these measures reflect both the level and volatility of rental prices over time.
Real Asking Rents for Apartments in Alameda County ($
Q4-2024)
Source: US Bureau of Labor Statistics. Moody's Analytics. Analysis by Beacon Economics.
The distribution of real asking rents in the county, adjusted for inflation, shows how advertised rental prices have changed across the market over time. The 25th percentile reflects lower-cost rentals, the median represents the typical rental, and the 75th percentile indicates higher-cost rentals. Together, these measures illustrate how asking rents have changed at multiple price points, not just on average, over the past decade.
Distribution of Real Asking Rents in Alameda County
Source: Public Use Microdata Sample (PUMS). US Bureau of Economic Analysis. Analysis by Beacon Economics. Data are in $ 2023.
The distribution of real contract rents in the county, adjusted for inflation, shows how actual rents paid by tenants have changed across the market over the past decade. Unlike asking rents, contract rents reflect what households are currently paying, offering insight into renters’ real housing costs over time.
Distribution of Real Contract Rents in Alameda County
Source: Public Use Microdata Sample (PUMS). US Bureau of Economic Analysis. Analysis by Beacon Economics. Data are in $ 2023.
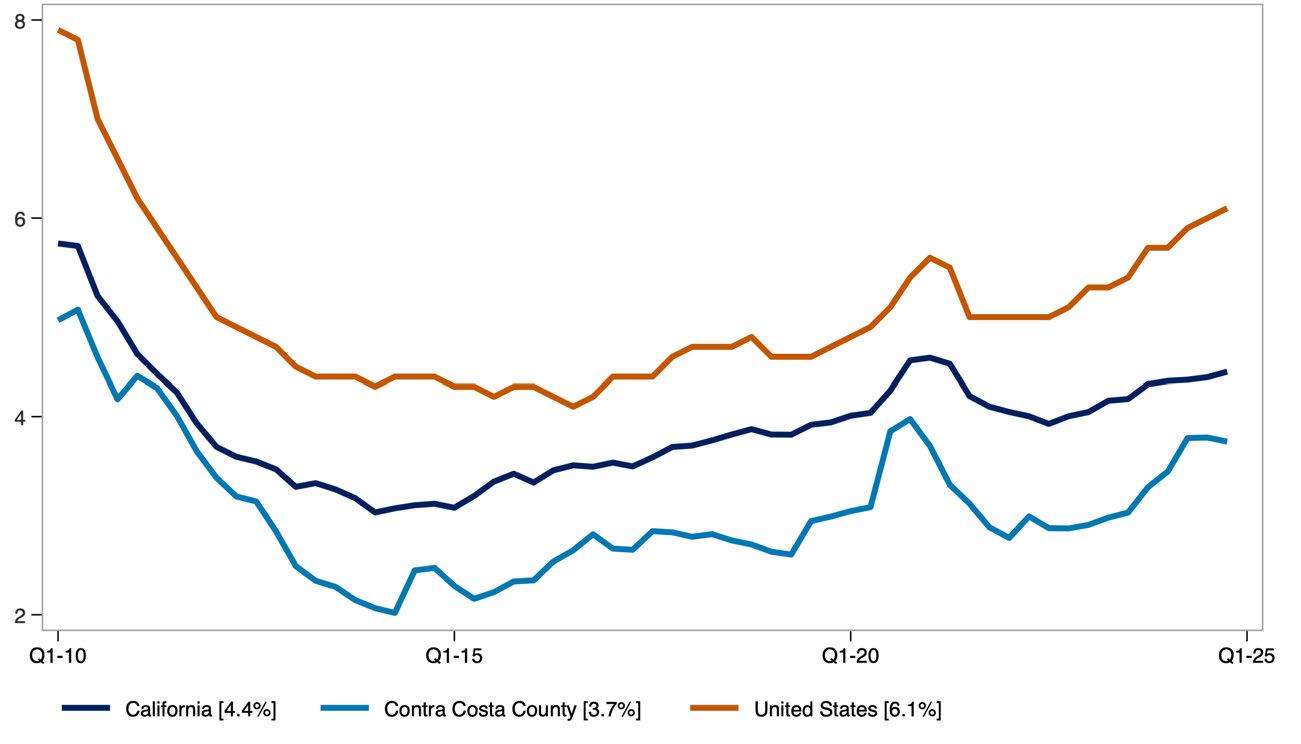
The apartment vacancy rate measures the share of rental units that are unoccupied and available for rent at a given time.
Vacancy Rate for Apartments in Alameda County
Source: Moody's Analytics. Analysis by Beacon Economics.
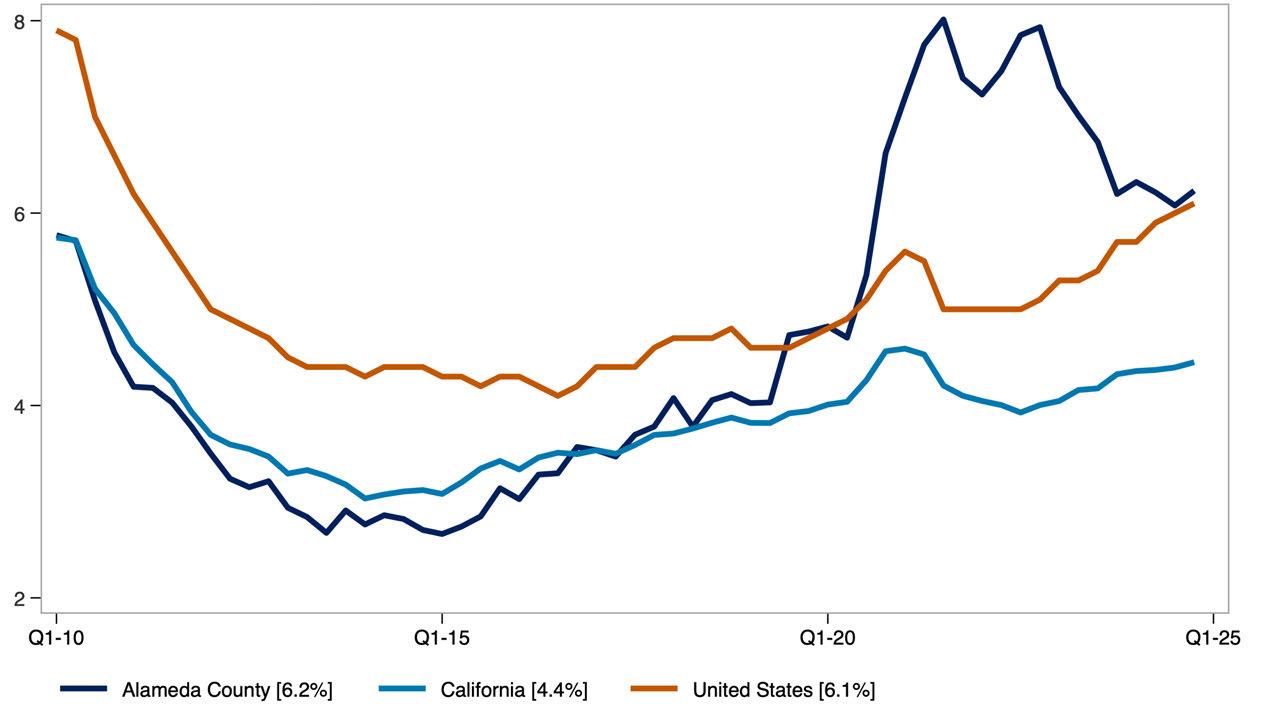
It serves as an indicator of the balance between rental housing supply and demand. Lower vacancy rates typically point to tighter market conditions, while higher rates suggest greater availability.
STATE OF RENTERS: COUNTY OF ALAMEDA
Key demographic and socioeconomic characteristics of renter households include household size, poverty status, income distribution, language access, and household composition. Together, these indicators offer a snapshot of how renter households are structured and how those characteristics have shifted over time. The data combine absolute figures, such as the number of renter households, with percentages that reflect household traits, such as the share with children or seniors.
Demographic Characteristics of Alameda County Renter Households.
Source: American Community Survey Public Use Microdata Sample (PUMS). Analysis by Beacon Economics.
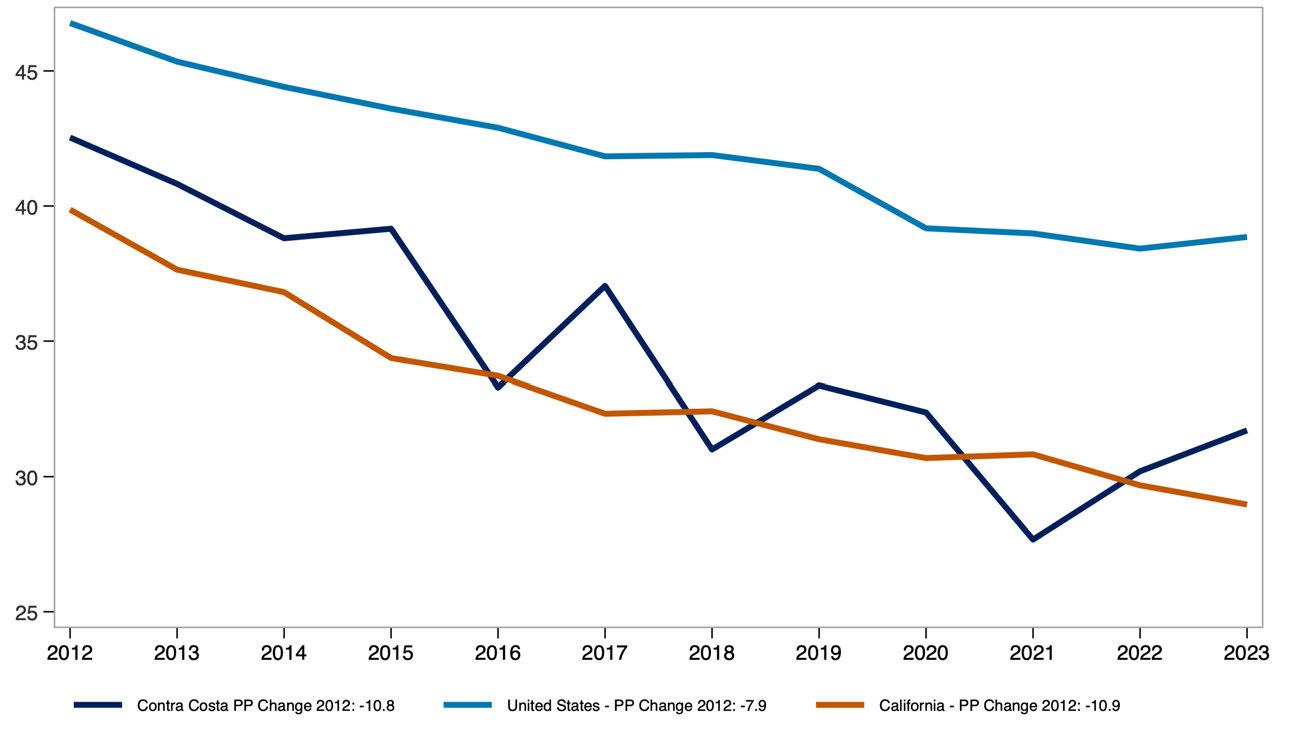
The share of single-person renter households who moved into their current home within the past two years reflects residential mobility among renters living alone.
This measure helps illustrate turnover in the rental market and may indicate trends in housing availability and economic stability for solo renters.
Share of Single-Person Renter Households That Have Moved in Previous 2 Years
Source: American Community Survey, Public Use Microdata Sample (PUMS). Analysis by Beacon Economics.

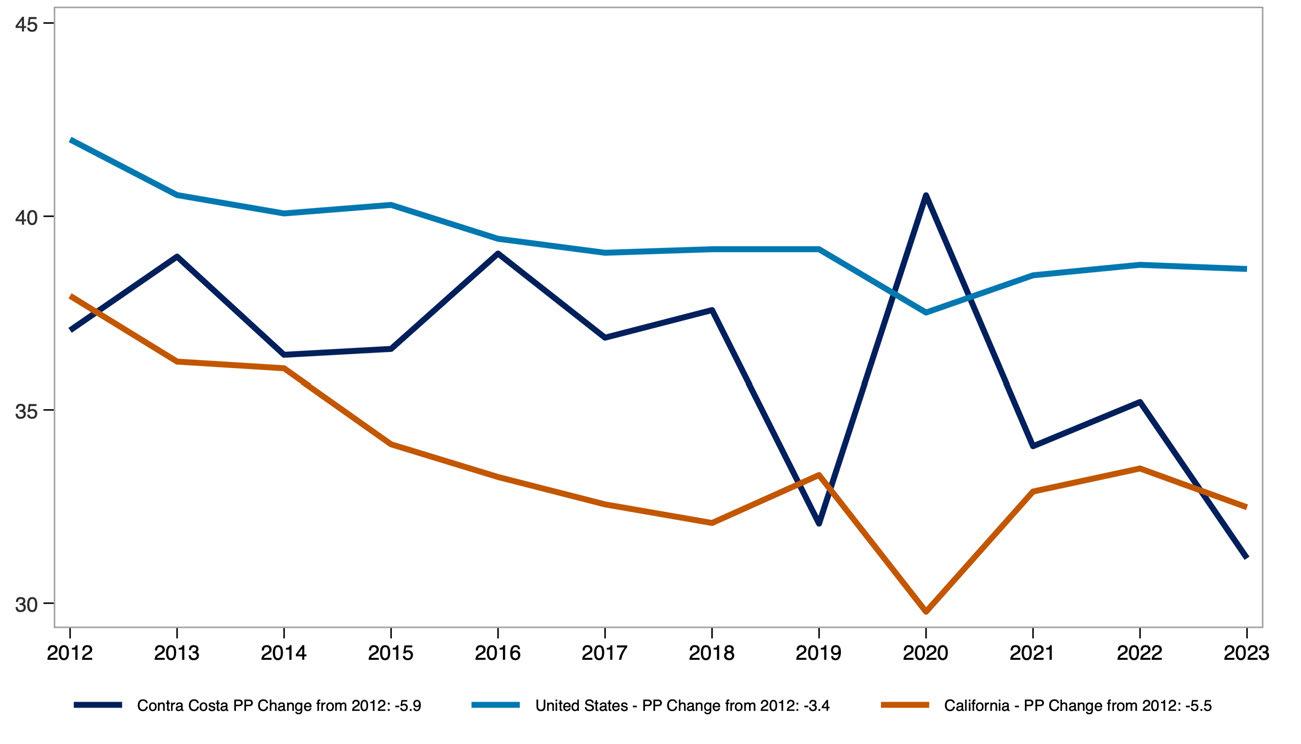
The share of multi-person renter households who moved within the past two years reflects residential mobility among shared or family households.
This measure offers insight into turnover rates and housing stability for renters living with others, whether as families or roommates.
Share of Multi-Person Renter Households That Have Moved in Previous 2 Years
Source: American Community Survey, Public Use Microdata Sample (PUMS). Analysis by Beacon Economics
The share of renter households that are single person versus multi-person provides insight into how household size and composition have shifted over time.
Demographic Characteristics of Alameda County Renter Households.
Source: American Community Survey Public Use Microdata Sample (PUMS). Analysis by Beacon Economics.
Real median pre-tax income of renter households, measured in 2023 dollars, reflects how renter incomes have changed in purchasing power over time.
Comparing the county to the U.S. highlights how local renter income levels have evolved relative to the national average.
Real Median Renter Pre-Tax Income ($ 2023, 000s)
Source: Public Use Microdata Sample (PUMS). Analysis by Beacon Economics.
The share of income spent on rent, broken out by renter household type and income level, shows how rent burden varies across the population. This measure compares single-person and multi-person households at the 25th percentile, median, and 75th percentile of the burden distribution, offering insight into how both household size affects housing affordability.
Share of Income Spent on Rent by Household Type in Alameda County.
Monthly renter household income before and after rent adjusted for inflation, highlights how much income renters have overall and how much remains after covering housing costs. Presented at the 25th percentile, median, and 75th percentile, this measure provides a view of post-rent income across different points in the income distribution.
Real Monthly Pre/Post-Rent Income for Renter Households in Alameda County
Source: Public Use Microdata Sample (PUMS). US Bureau of Economic Analysis. Analysis by Beacon Economics. Data are in $ 2023.
STATE OF THE STOCK: COUNTY OF ALAMEDA
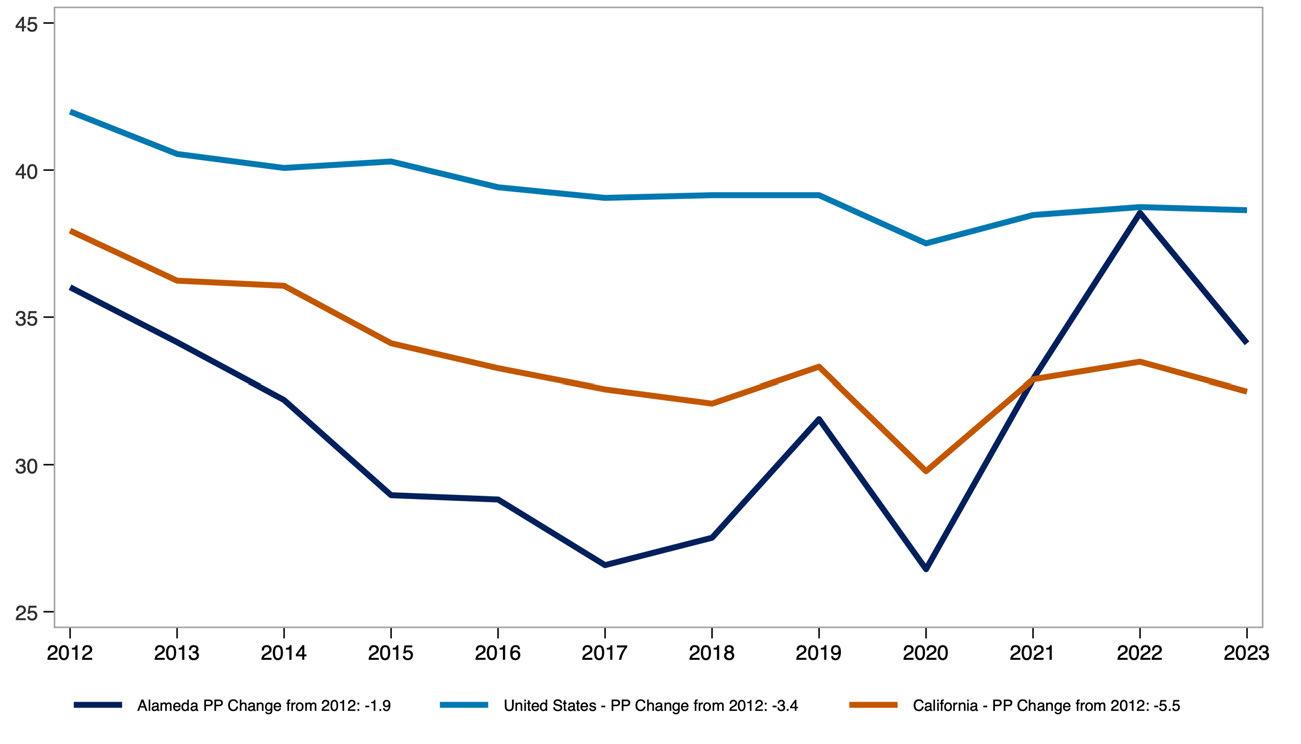
The share of renter-occupied housing units by the year the building was built offers insight into the age of the rental housing stock across the county, California, and the United States.
This measure helps illustrate how recently or how long ago rental units were added to each region’s housing supply.
Renter Occupied Housing by Year Built, Alameda County
Source: 2023 American Community Survey. Analysis by Beacon Economics.

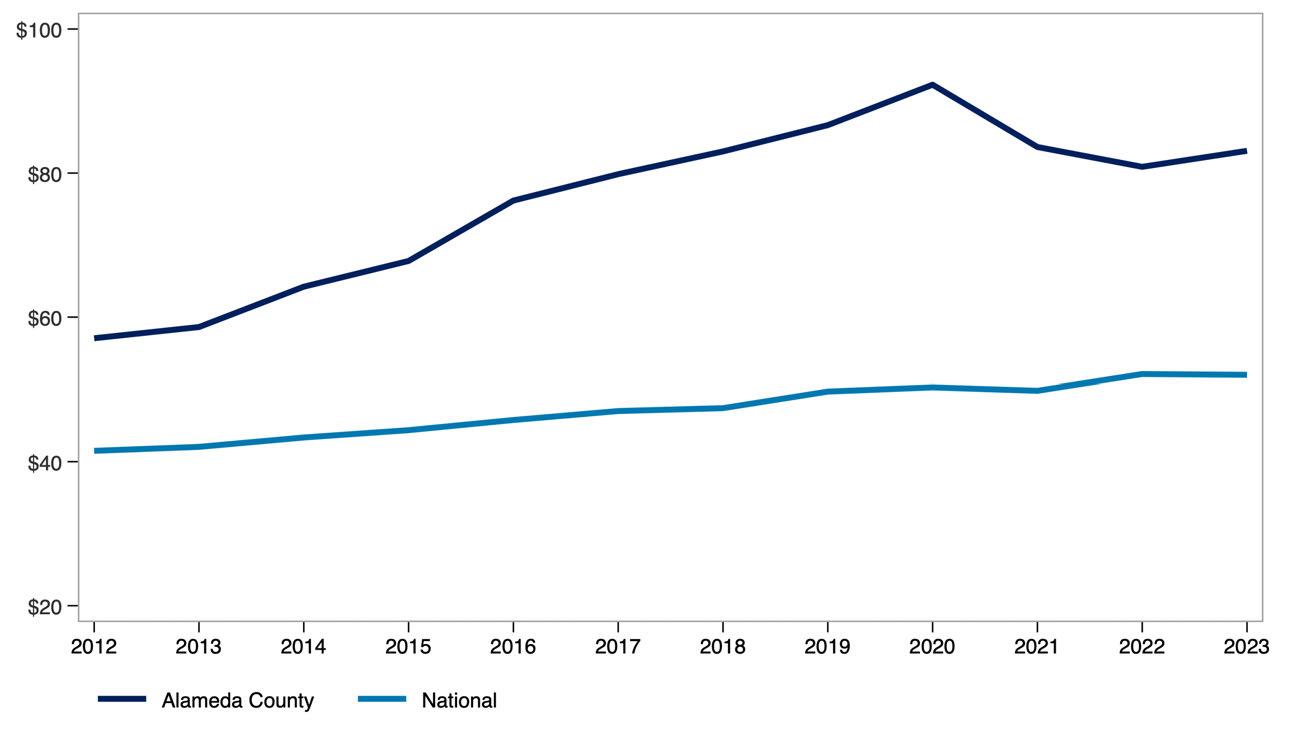
Producer Price Index (PPI) trends for goods and services used in multifamily residential construction reflect how input costs have changed over time. These trends influence the cost and feasibility of developing new rental housing. A broader commodity index is also included to show how construction-specific price movements compare to price trends across all industries.
Producer Price Index by Commodity, United States
Source: U.S. Bureau of Labor Statistics. Analysis by Beacon Economics.
Net Inputs to Multifamily
Residential Construction: Goods, Less Food and Energy
Net Inputs to Multifamily
Residential Construction: Services
All Commodities
Net Inputs to Multifamily
Residential Construction, Excluding Capital Investment, Labor, and Imports
The State of Renters in Contra Costa County
Renter incomes in Contra Costa County have grown significantly. Even after adjusting for inflation and subtracting rent, household income has increased by 34.3% over the past decade compared to 21.4% for renters nationwide.
Household composition is shifting as well. The share of single-person renter households in Contra Costa County has increased by 3.2 percentage points over the past decade, reflecting a broader trend toward smaller household sizes.
Rent burden has remained stable overall. For all renters, the median share of income spent on rent has held steady over the past decade. Among multi-person renter households, rent burden has declined from 27.8% in 2013 to 26.7% in 2023 pointing to modest improvements in affordability for shared households.
STATE OF THE MARKET: COUNTY OF CONTRA COSTA
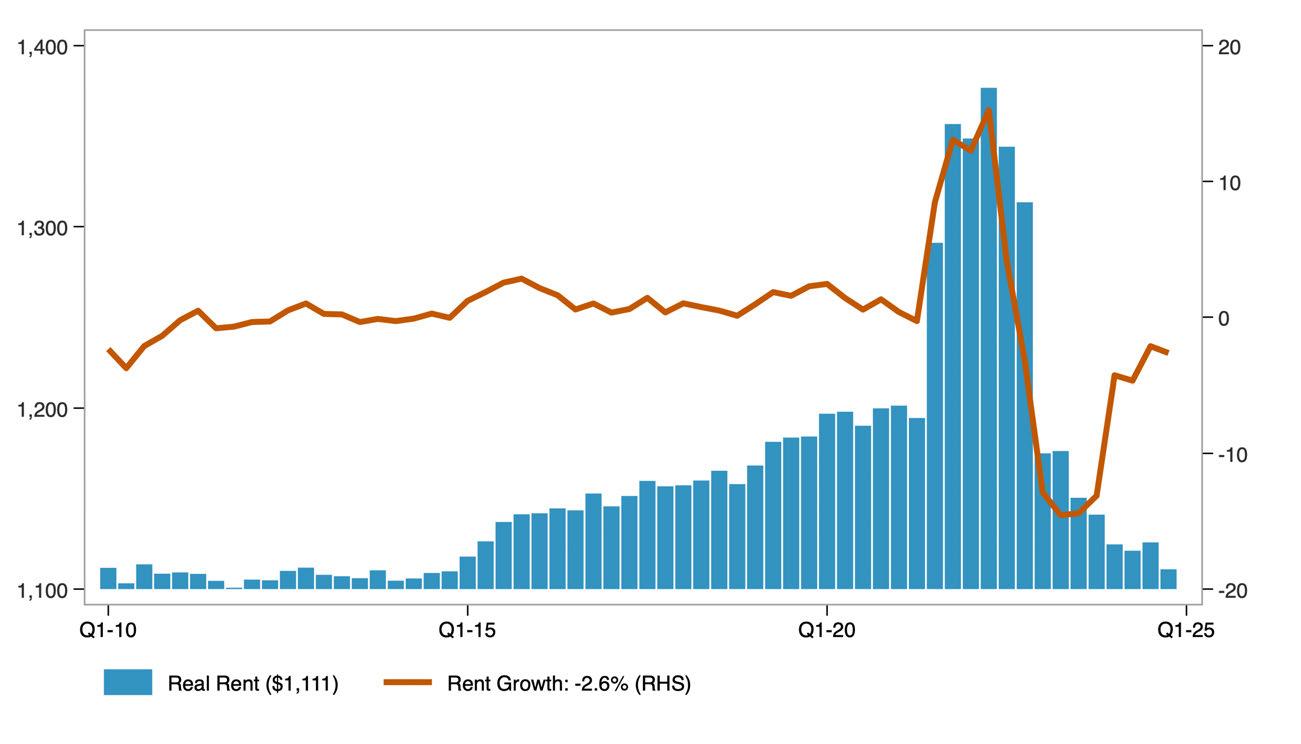
Asking rent represents the price landlords list for vacant units, rather than what current tenants are paying. When adjusted for inflation, it provides insight into how advertised rents have changed in real terms.
The year-over-year rent growth rate captures the pace at which rents are rising or falling. Together, these measures reflect both the level and volatility of rental prices over time.
Real Asking Rents for Apartments in Contra Costa County ($ Q4-2024)
Source: US Bureau of Labor Statistics. Moody's Analytics Analysis by Beacon Economics.
The distribution of real asking rents in the county, adjusted for inflation, shows how advertised rental prices have changed across the market over time. The 25th percentile reflects lower-cost rentals, the median represents the typical rental, and the 75th percentile indicates higher-cost rentals. Together, these measures illustrate how asking rents have changed at multiple price points, not just on average, over the past decade.
Distribution of Real Asking Rents in
Source: Public Use Microdata Sample (PUMS). US Bureau of Economic Analysis. Analysis by Beacon Economics. Data are in $ 2023.
The distribution of real contract rents in the county, adjusted for inflation, shows how actual rents paid by tenants have changed across the market over the past decade. Unlike asking rents, contract rents reflect what households are currently paying, offering insight into renters’ real housing costs over time.
Distribution of Real Contract Rents in Contra
Costa County
Source: Public Use Microdata Sample (PUMS). US Bureau of Economic Analysis. Analysis by Beacon Economics. Data are in $ 2023.
The apartment vacancy rate measures the share of rental units that are unoccupied and available for rent at a given time.
Vacancy Rate for Apartments in Contra Costa County
Source: Moody's Analytics. Analysis by Beacon Economics.
It serves as an indicator of the balance between rental housing supply and demand. Lower vacancy rates typically point to tighter market conditions, while higher rates suggest greater availability.
STATE OF RENTERS: COUNTY OF CONTRA COSTA
Key demographic and socioeconomic characteristics of renter households include household size, poverty status, income distribution, language access, and household composition. Together, these indicators offer a snapshot of how renter households are structured and how those characteristics have shifted over time. The data combine absolute figures, such as the number of renter households, with percentages that reflect household traits, such as the share with children or seniors.
Demographic Characteristics of Contra Costa County Renter Households.
Source: American Community Survey Public Use Microdata Sample (PUMS) Analysis by Beacon Economics.
The share of single-person renter households who moved into their current home within the past two years reflects residential mobility among renters living alone.
This measure helps illustrate turnover in the rental market and may indicate trends in housing availability and economic stability for solo renters.
Share of Single-Person Renter Households That Have Moved in Previous 2 Years
Source: American Community Survey, Public Use Microdata Sample (PUMS). Analysis by Beacon Economics.
The share of multi-person renter households who moved within the past two years reflects residential mobility among shared or family households.
This measure offers insight into turnover rates and housing stability for renters living with others, whether as families or roommates.
Share of Multi-Person Renter Households That Have Moved in Previous 2 Years
Source: American Community Survey, Public Use Microdata Sample (PUMS). Analysis by Beacon Economics
The share of renter households that are single person versus multi-person provides insight into how household size and composition have shifted over time.
Demographic Characteristics of Contra Costa County Renter Households.
Source: American Community Survey Public Use Microdata Sample (PUMS) Analysis by Beacon Economics.
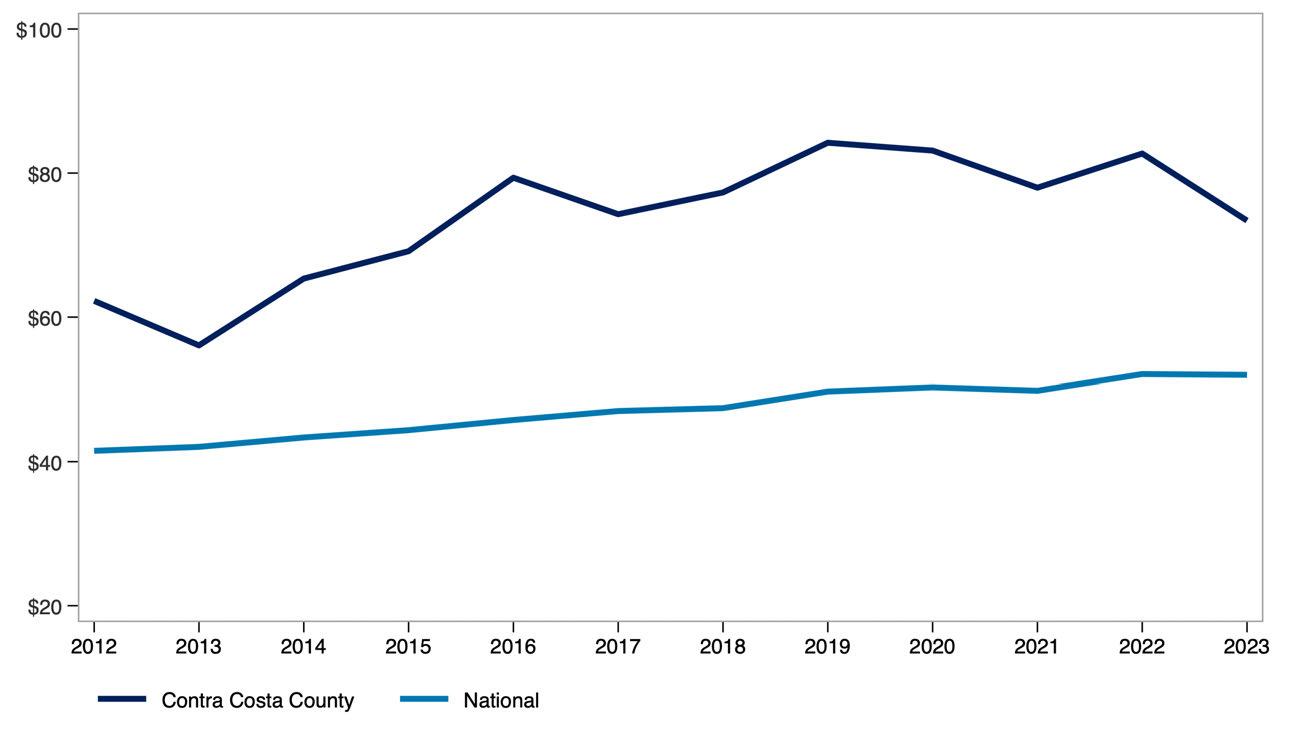
Real median pre-tax income of renter households, measured in 2023 dollars, reflects how renter incomes have changed in purchasing power over time.
Comparing the county to the U.S. highlights how local renter income levels have evolved relative to the national average.
Real Median Renter Pre-Tax Income ($ 2023, 000s)
Source: Public Use Microdata Sample (PUMS) Analysis by Beacon Economics.
The share of income spent on rent, broken out by renter household type and income level, shows how rent burden varies across the population. This measure compares single-person and multi-person households at the 25th percentile, median, and 75th percentile of the burden distribution, offering insight into how both household size affects housing affordability.
Monthly renter household income before and after rent adjusted for inflation, highlights how much income renters have overall and how much remains after covering housing costs. Presented at the 25th percentile, median, and 75th percentile, this measure provides a view of post-rent income across different points in the income distribution.
Real Monthly Pre/Post-Rent Income for Renter Households in Contra Costa County
Source: Public Use Microdata Sample (PUMS). US Bureau of Economic Analysis. Analysis by Beacon Economics. Data are in $ 2023.
STATE OF THE STOCK: COUNTY OF CONTRA COSTA
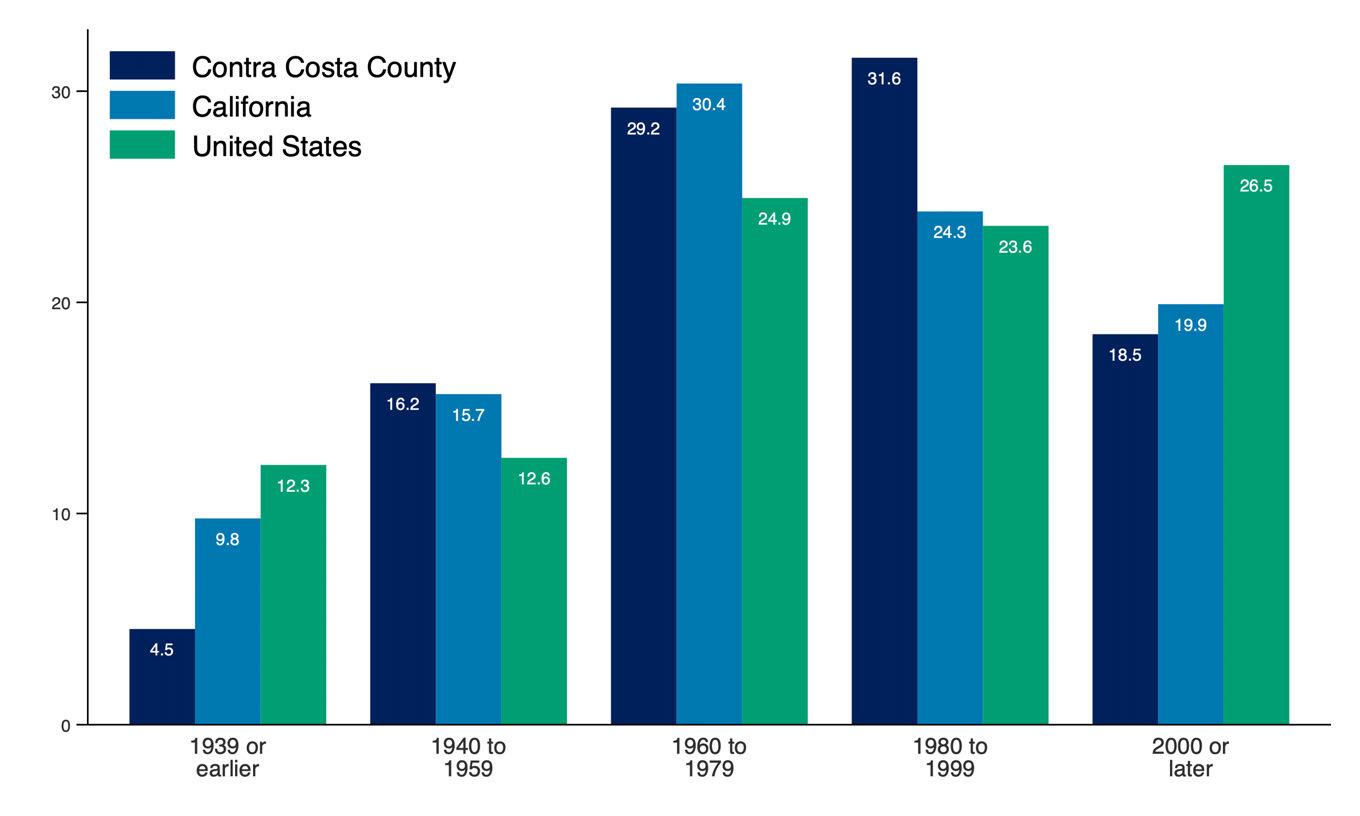
The share of renter-occupied housing units by the year the building was built offers insight into the age of the rental housing stock across the county, California, and the United States.
This measure helps illustrate how recently or how long ago rental units were added to each region’s housing supply.
Renter Occupied Housing by Year Built, Contra Costa County
Source: 2023 American Community Survey. Analysis by Beacon Economics.
Producer Price Index (PPI) trends for goods and services used in multifamily residential construction reflect how input costs have changed over time. These trends influence the cost and feasibility of developing new rental housing. A broader commodity index is also included to show how construction-specific price movements compare to price trends across all industries.
Producer Price Index by Commodity, United States
Source: U.S. Bureau of Labor Statistics. Analysis by Beacon Economics.
Net Inputs to Multifamily
Residential Construction: Goods, Less Food and Energy
Net Inputs to Multifamily
Residential Construction: Services
All Commodities
Net Inputs to Multifamily
Residential Construction, Excluding Capital Investment, Labor, and Imports
The State of Renters in Fresno County
Renter incomes in Fresno County have grown significantly. Even after adjusting for inflation and subtracting rent, household income has increased by 38.2% over the past decade compared to 21.4% for renters nationwide.
Household composition is shifting as well. The share of single-person renter households in Fresno County has increased by 4.7 percentage points over the past decade, reflecting a broader trend toward smaller household sizes.
Rent burden has remained stable overall. For all renters, the median share of income spent on rent has held steady over the past decade. Among multi-person renter households, rent burden has declined from 27.4% in 2013 to 24.8% in 2023 pointing to modest improvements in affordability for shared households.
STATE OF THE MARKET: COUNTY OF FRESNO
Asking rent represents the price landlords list for vacant units, rather than what current tenants are paying. When adjusted for inflation, it provides insight into how advertised rents have changed in real terms.
The year-over-year rent growth rate captures the pace at which rents are rising or falling. Together, these measures reflect both the level and volatility of rental prices over time.
Real Asking Rents for Apartments in Fresno County ($ Q4-2024)
Source: US Bureau of Labor Statistics. Moody's Analytics. Analysis by Beacon Economics.
The distribution of real asking rents in the county, adjusted for inflation, shows how advertised rental prices have changed across the market over time. The 25th percentile reflects lower-cost rentals, the median represents the typical rental, and the 75th percentile indicates higher-cost rentals. Together, these measures illustrate how asking rents have changed at multiple price points, not just on average, over the past decade.
Distribution of Real Asking Rents in Fresno County
Source: Public Use Microdata Sample (PUMS). US Bureau of Economic Analysis. Analysis by Beacon Economics. Data are in $ 2023.
The distribution of real contract rents in the county, adjusted for inflation, shows how actual rents paid by tenants have changed across the market over the past decade. Unlike asking rents, contract rents reflect what households are currently paying, offering insight into renters’ real housing costs over time.
Distribution of Real Contract Rents in Fresno County
Source: Public Use Microdata Sample (PUMS). US Bureau of Economic Analysis. Analysis by Beacon Economics. Data are in $ 2023.
The apartment vacancy rate measures the share of rental units that are unoccupied and available for rent at a given time.
Vacancy Rate for Apartments in Fresno County
Source: Moody's Analytics. Analysis by Beacon Economics.
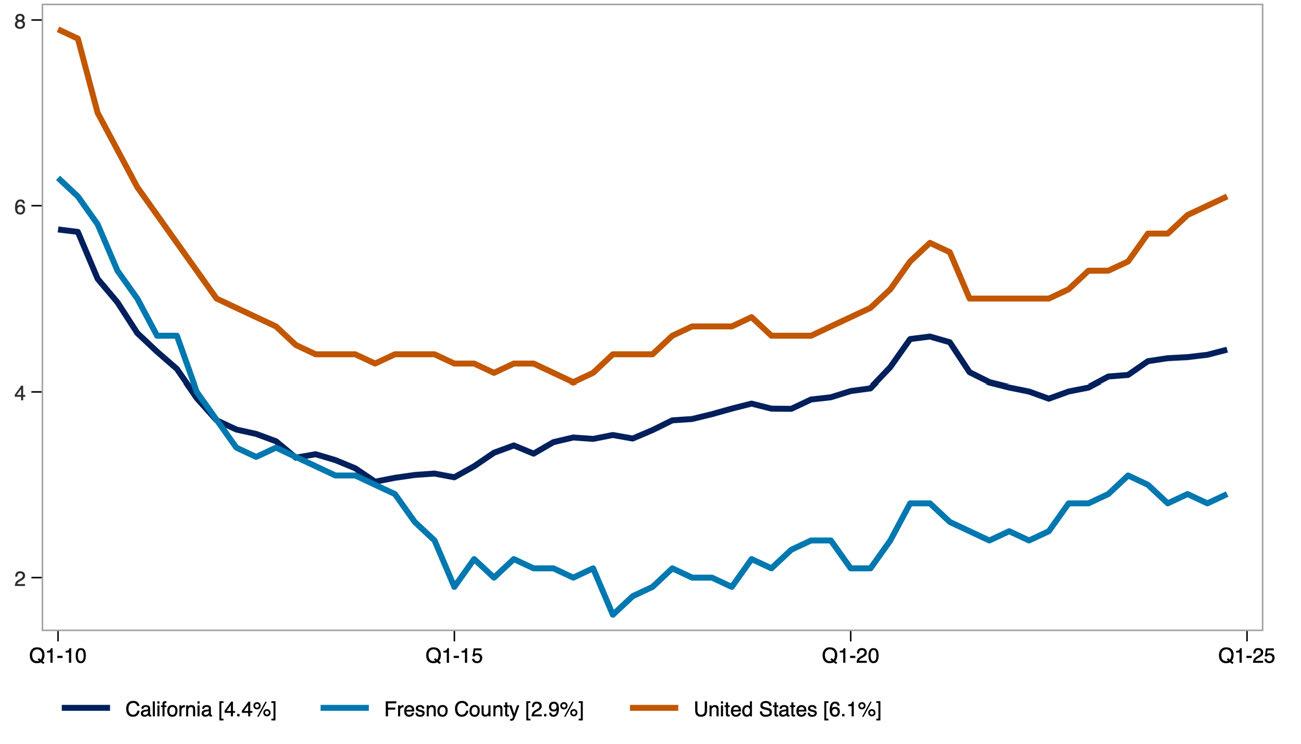
It serves as an indicator of the balance between rental housing supply and demand. Lower vacancy rates typically point to tighter market conditions, while higher rates suggest greater availability.
STATE OF RENTERS: COUNTY OF FRESNO
Key demographic and socioeconomic characteristics of renter households include household size, poverty status, income distribution, language access, and household composition. Together, these indicators offer a snapshot of how renter households are structured and how those characteristics have shifted over time. The data combine absolute figures, such as the number of renter households, with percentages that reflect household traits, such as the share with children or seniors.
Demographic Characteristics of Fresno County Renter Households.
Source: American Community Survey Public Use Microdata Sample (PUMS). Analysis by Beacon Economics.
The share of single-person renter households who moved into their current home within the past two years reflects residential mobility among renters living alone.
This measure helps illustrate turnover in the rental market and may indicate trends in housing availability and economic stability for solo renters.
Share of Single-Person Renter Households That Have Moved in Previous 2 Years
Source: American Community Survey, Public Use Microdata Sample (PUMS). Analysis by Beacon Economics.
The share of multi-person renter households who moved within the past two years reflects residential mobility among shared or family households.
This measure offers insight into turnover rates and housing stability for renters living with others, whether as families or roommates.
Share of Multi-Person Renter Households That Have Moved in Previous 2 Years
Source: American Community Survey, Public Use Microdata Sample (PUMS). Analysis by Beacon Economics
The share of renter households that are single person versus multi-person provides insight into how household size and composition have shifted over time.
Demographic Characteristics of Fresno County Renter Households.
Source: American Community Survey Public Use Microdata Sample (PUMS) Analysis by Beacon Economics
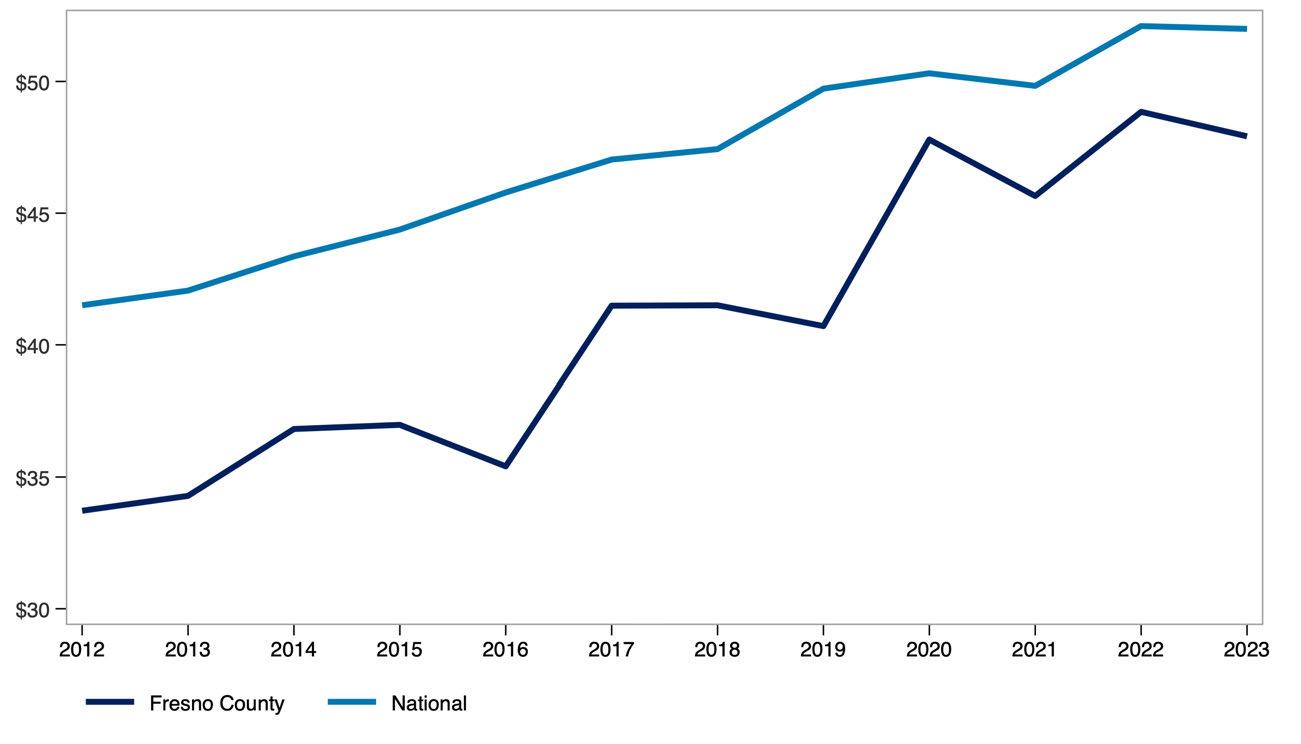
Real median pre-tax income of renter households, measured in 2023 dollars, reflects how renter incomes have changed in purchasing power over time.
Comparing the county to the U.S. highlights how local renter income levels have evolved relative to the national average.
Real Median Renter Pre-Tax Income ($ 2023, 000s)
Source: Public Use Microdata Sample (PUMS). Analysis by Beacon Economics.
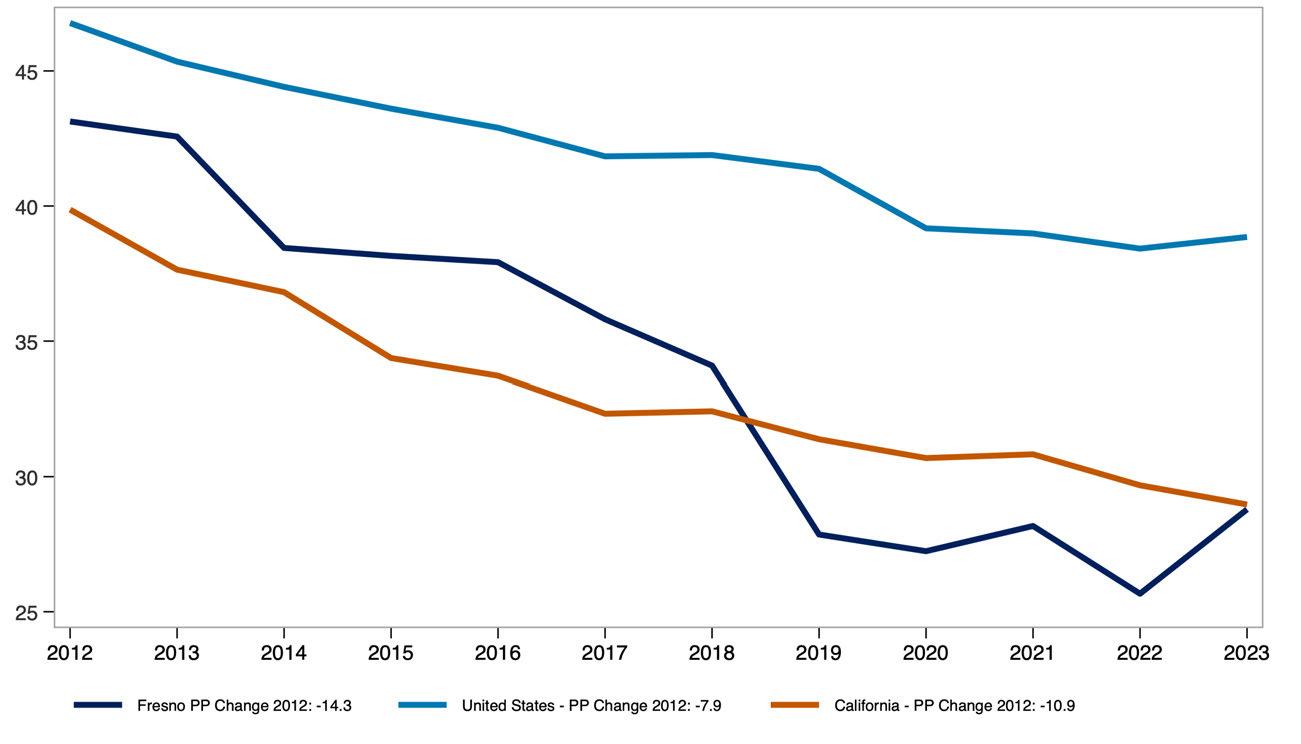
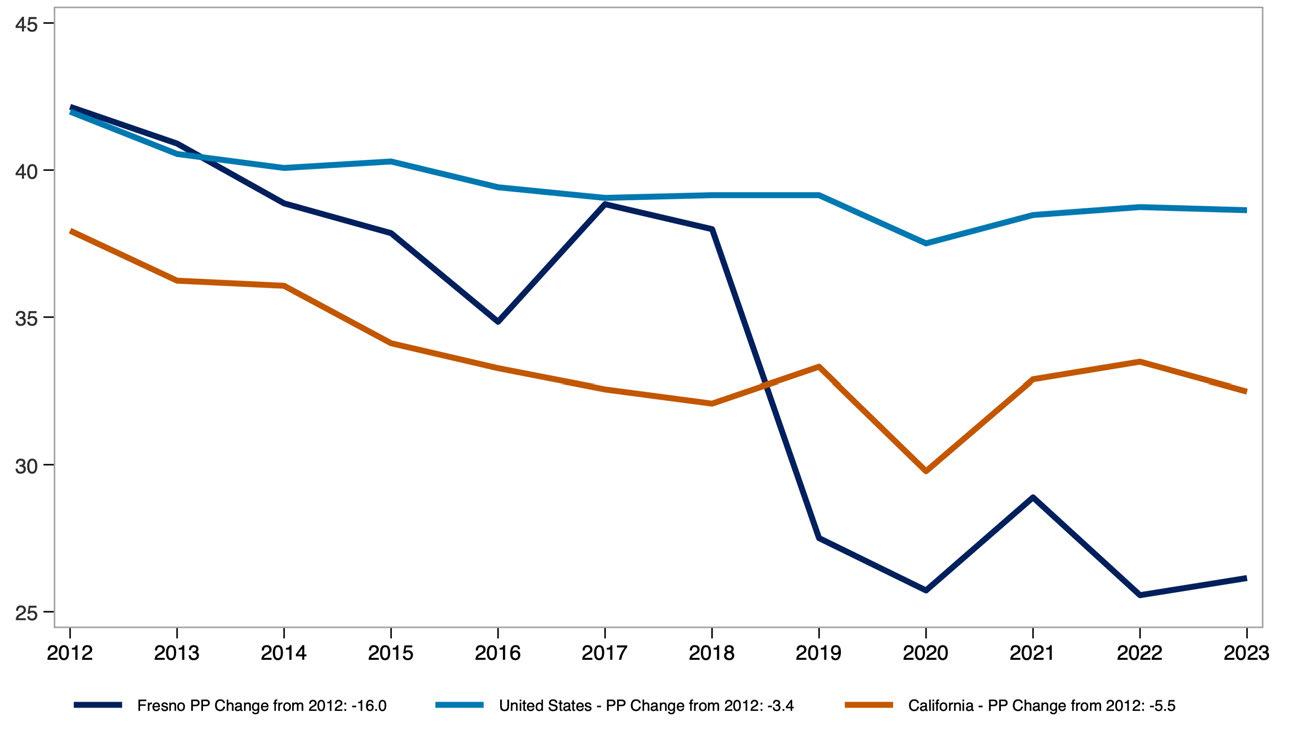
The share of income spent on rent, broken out by renter household type and income level, shows how rent burden varies across the population. This measure compares single-person and multi-person households at the 25th percentile, median, and 75th percentile of the burden distribution, offering insight into how both household size affects housing affordability.
Monthly renter household income before and after rent adjusted for inflation, highlights how much income renters have overall and how much remains after covering housing costs. Presented at the 25th percentile, median, and 75th percentile, this measure provides a view of post-rent income across different points in the income distribution.
Real Monthly Pre/Post-Rent Income for Renter Households in Fresno County
Source: Public Use Microdata Sample (PUMS). US Bureau of Economic Analysis. Analysis by Beacon Economics Data are in $ 2023.
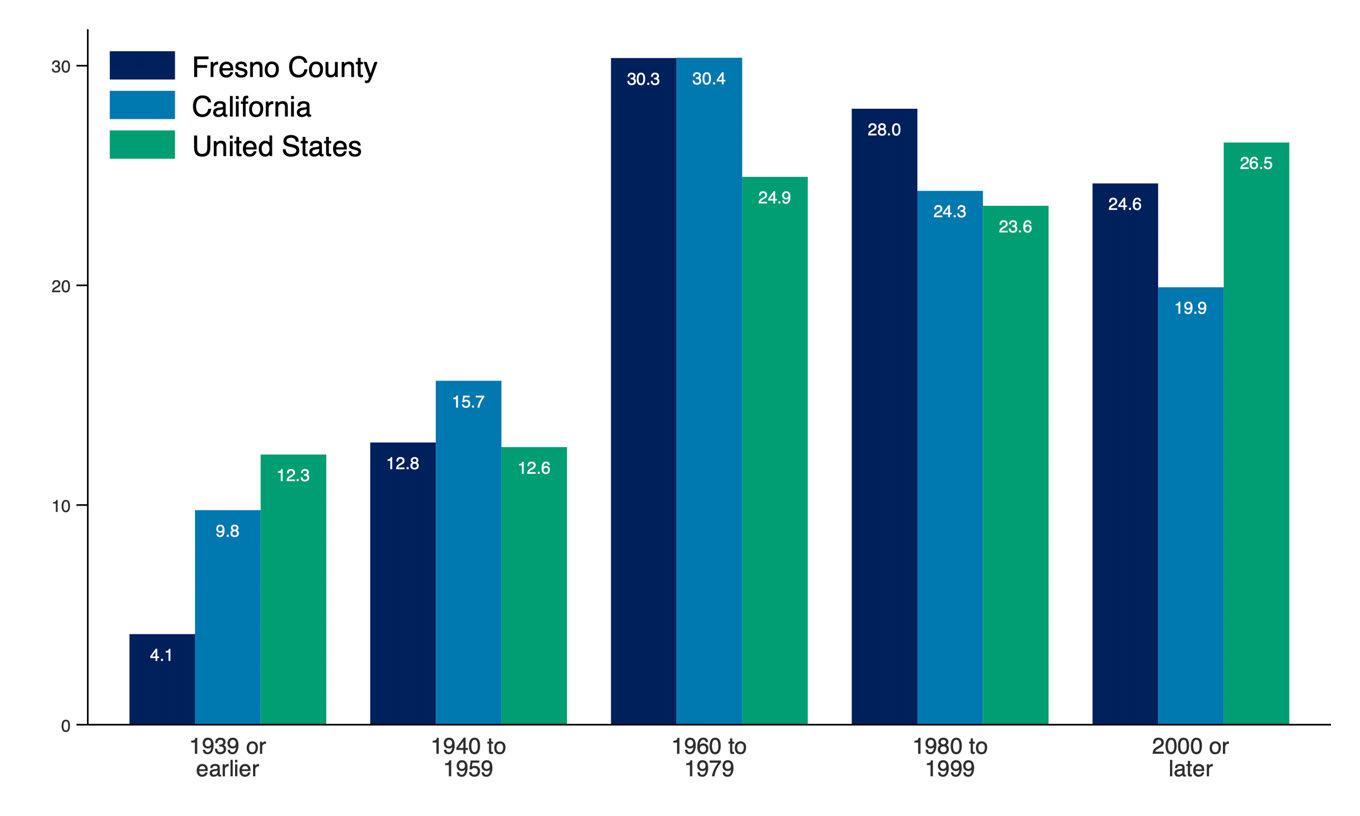
STATE OF THE STOCK: COUNTY OF FRESNO
The share of renter-occupied housing units by the year the building was built offers insight into the age of the rental housing stock across the county, California, and the United States. This measure helps illustrate how recently or how long ago rental units were added to each region’s housing supply.
Renter Occupied Housing by Year Built, Fresno County
Source: 2023 American Community Survey. Analysis by Beacon Economics
Producer Price Index (PPI) trends for goods and services used in multifamily residential construction reflect how input costs have changed over time. These trends influence the cost and feasibility of developing new rental housing. A broader commodity index is also included to show how construction-specific price movements compare to price trends across all industries.
Producer Price Index by Commodity, United States
Source: U.S. Bureau of Labor Statistics. Analysis by Beacon Economics.
Net Inputs to Multifamily
Residential Construction: Goods, Less Food and Energy
Net Inputs to Multifamily
Residential Construction: Services
All Commodities
Net Inputs to Multifamily
Residential Construction, Excluding Capital Investment, Labor, and Imports
The State of Renters in Kern County
Renter incomes in Kern County have grown significantly. Even after adjusting for inflation and subtracting rent, household income has increased by 21.1% over the past decade compared to 21.4% for renters nationwide.
Household composition is shifting as well. The share of single-person renter households in Kern County has increased by 3.9 percentage points over the past decade, reflecting a broader trend toward smaller household sizes.
Rent burden has remained stable overall. For all renters, the median share of income spent on rent has held steady over the past decade. Among multi-person renter households, rent burden has declined from 24.5% in 2013 to 22.9% in 2023 pointing to modest improvements in affordability for shared households.
STATE OF THE MARKET: COUNTY OF KERN
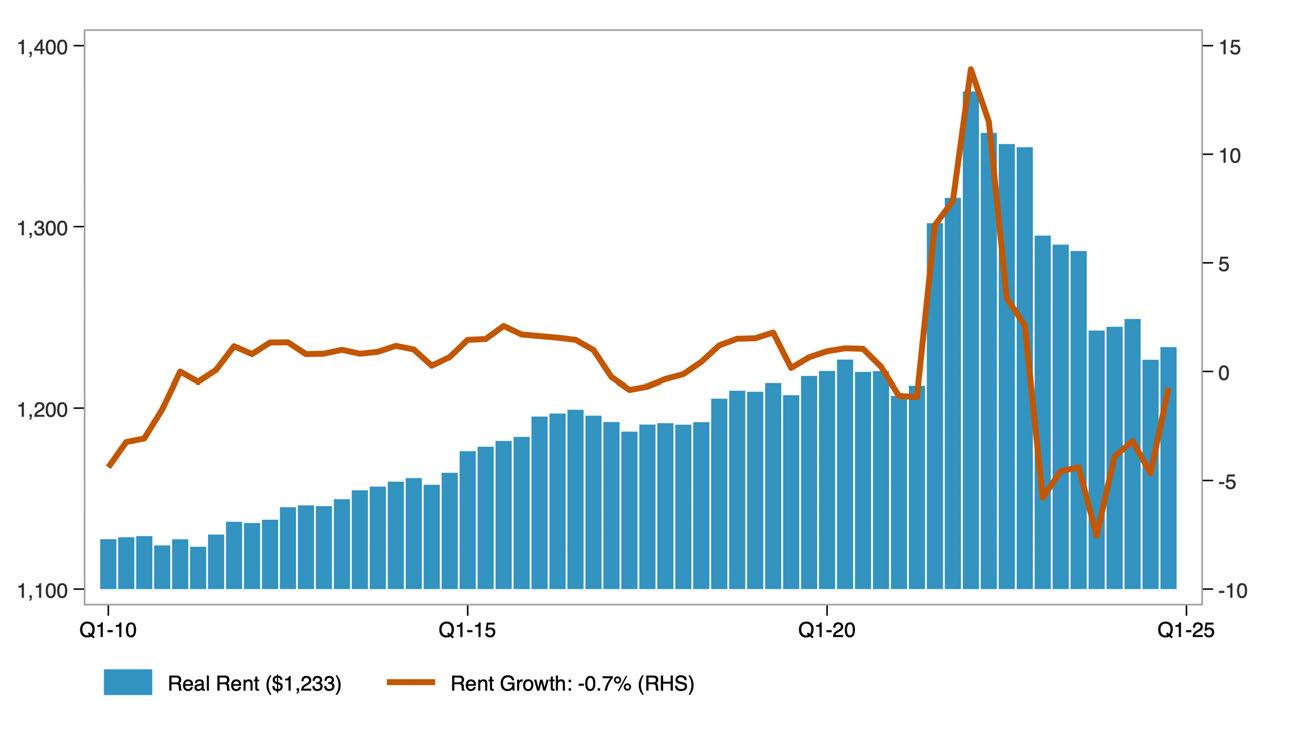
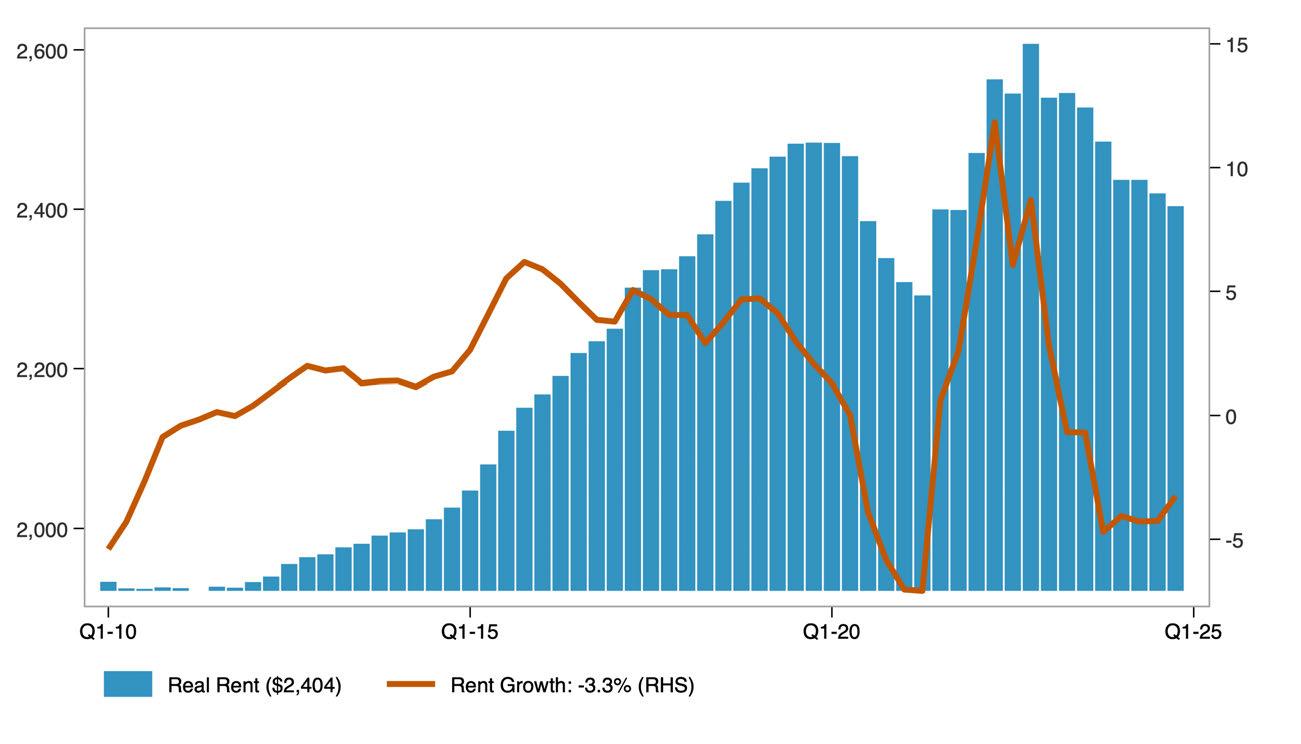
Asking rent represents the price landlords list for vacant units, rather than what current tenants are paying. When adjusted for inflation, it provides insight into how advertised rents have changed in real terms.
The year-over-year rent growth rate captures the pace at which rents are rising or falling. Together, these measures reflect both the level and volatility of rental prices over time.
Real Asking Rents for Apartments in Kern County ($ Q4-2024)
Source: US Bureau of Labor Statistics. Moody's Analytics. Analysis by Beacon Economics.
The distribution of real asking rents in the county, adjusted for inflation, shows how advertised rental prices have changed across the market over time. The 25th percentile reflects lower-cost rentals, the median represents the typical rental, and the 75th percentile indicates higher-cost rentals. Together, these measures illustrate how asking rents have changed at multiple price points, not just on average, over the past decade.
Distribution of Real Asking Rents in Kern County
Source: Public Use Microdata Sample (PUMS). US Bureau of Economic Analysis. Analysis by Beacon Economics. Data are in $ 2023.
The distribution of real contract rents in the county, adjusted for inflation, shows how actual rents paid by tenants have changed across the market over the past decade. Unlike asking rents, contract rents reflect what households are currently paying, offering insight into renters’ real housing costs over time.
Distribution of Real Contract Rents in Kern County
Source: Public Use Microdata Sample (PUMS). US Bureau of Economic Analysis. Analysis by Beacon Economics. Data are in $ 2023.
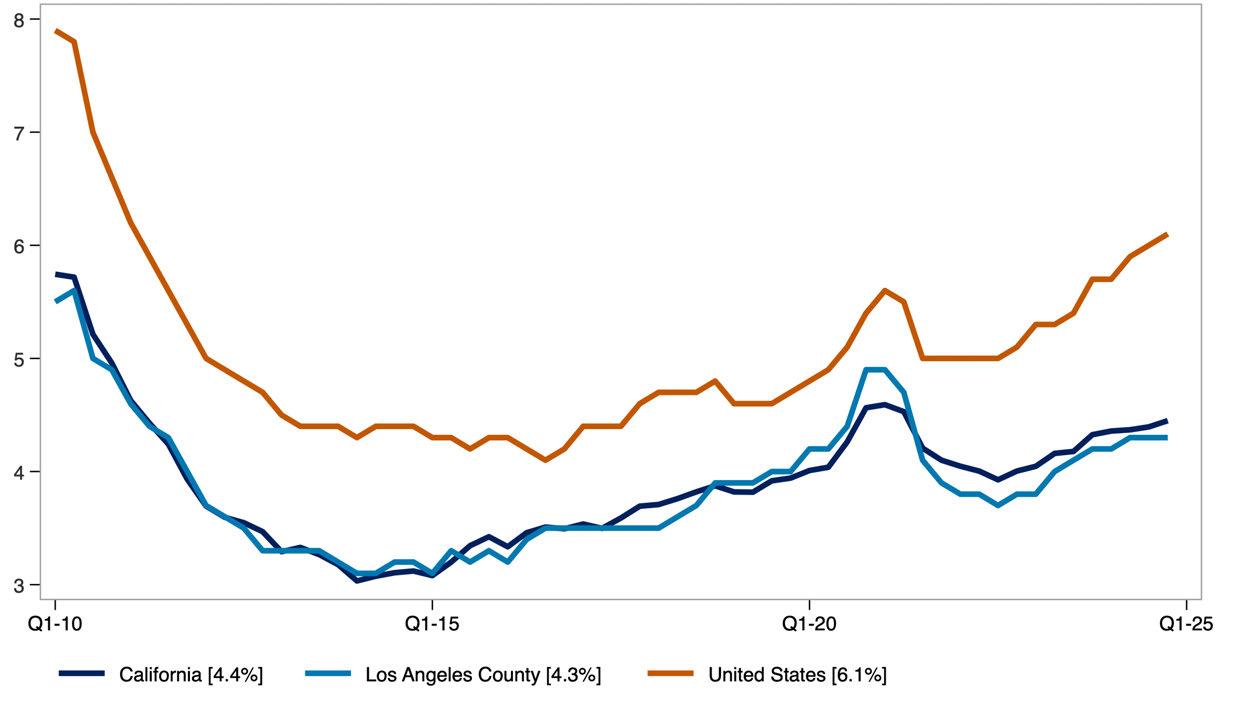
The apartment vacancy rate measures the share of rental units that are unoccupied and available for rent at a given time.
Vacancy Rate for Apartments in Kern County
Source: Moody's Analytics. Analysis by Beacon Economics.
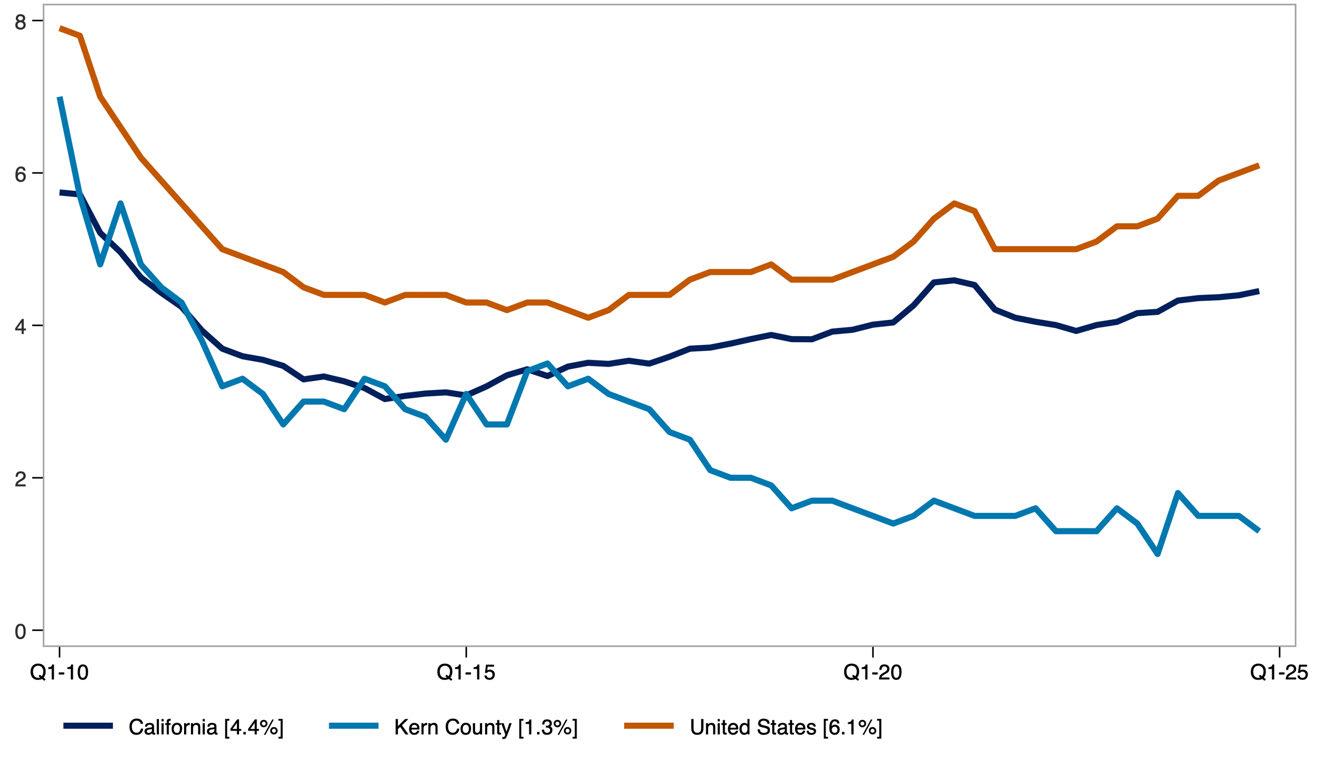
It serves as an indicator of the balance between rental housing supply and demand. Lower vacancy rates typically point to tighter market conditions, while higher rates suggest greater availability.
STATE OF RENTERS: COUNTY OF KERN
Key demographic and socioeconomic characteristics of renter households include household size, poverty status, income distribution, language access, and household composition. Together, these indicators offer a snapshot of how renter households are structured and how those characteristics have shifted over time. The data combine absolute figures, such as the number of renter households, with percentages that reflect household traits, such as the share with children or seniors.
Demographic Characteristics of Kern County Renter Households.
Source: American Community Survey Public Use Microdata Sample (PUMS) Analysis by Beacon Economics.
The share of single-person renter households who moved into their current home within the past two years reflects residential mobility among renters living alone.
This measure helps illustrate turnover in the rental market and may indicate trends in housing availability and economic stability for solo renters.
Share of Single-Person Renter Households That Have Moved in Previous 2 Years
Source: American Community Survey, Public Use Microdata Sample (PUMS). Analysis by Beacon Economics.
The share of multi-person renter households who moved within the past two years reflects residential mobility among shared or family households.
This measure offers insight into turnover rates and housing stability for renters living with others, whether as families or roommates.
Share of Multi-Person Renter Households That Have Moved in Previous 2 Years
Source: American Community Survey, Public Use Microdata Sample (PUMS). Analysis by Beacon Economics.
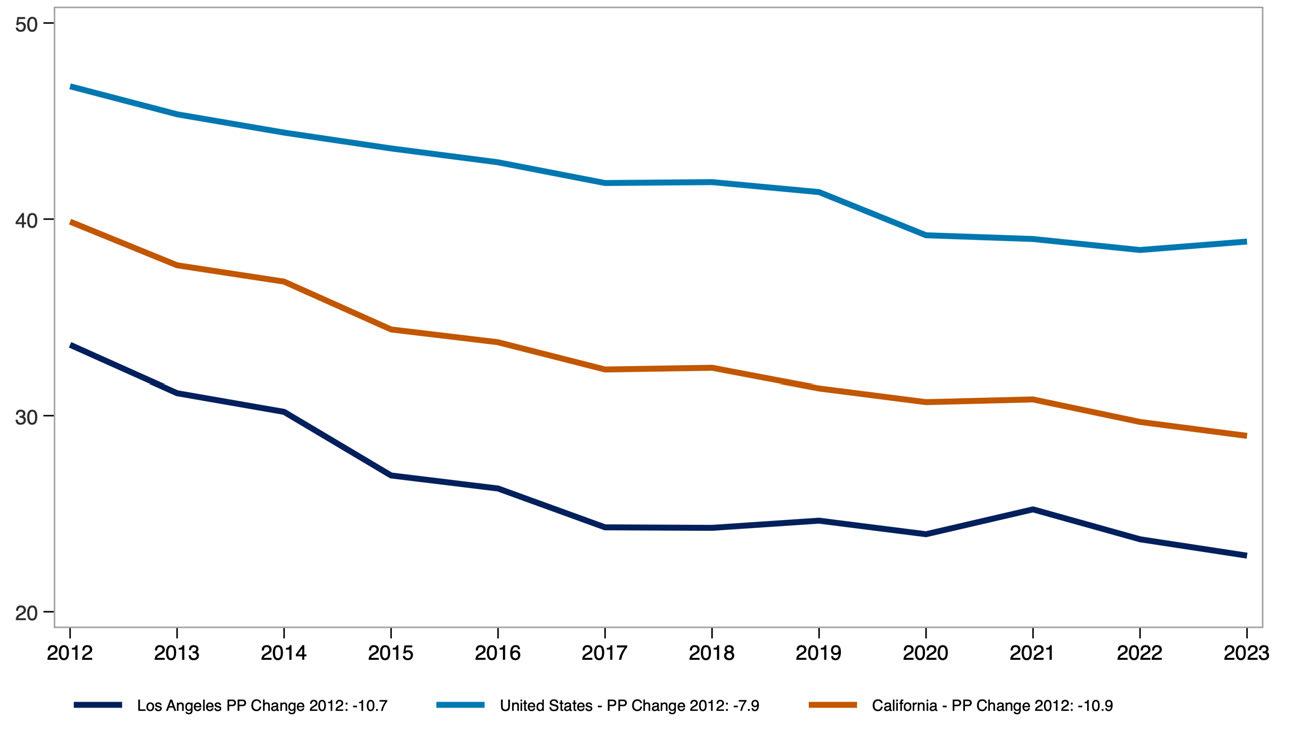
The share of renter households that are single person versus multi-person provides insight into how household size and composition have shifted over time.
Demographic Characteristics of
Source: American Community Survey Public Use Microdata Sample (PUMS)
Real median pre-tax income of renter households, measured in 2023 dollars, reflects how renter incomes have changed in purchasing power over time.
Comparing the county to the U.S. highlights how local renter income levels have evolved relative to the national average.
Real Median Renter Pre-Tax Income ($ 2023, 000s)
Source: Public Use Microdata Sample (PUMS). Analysis by Beacon Economics.
The share of income spent on rent, broken out by renter household type and income level, shows how rent burden varies across the population. This measure compares single-person and multi-person households at the 25th percentile, median, and 75th percentile of the burden distribution, offering insight into how both household size affects housing affordability.
Monthly renter household income before and after rent adjusted for inflation, highlights how much income renters have overall and how much remains after covering housing costs. Presented at the 25th percentile, median, and 75th percentile, this measure provides a view of post-rent income across different points in the income distribution.
Real Monthly Pre/Post-Rent Income for Renter Households in Kern County
Source: Public Use Microdata Sample (PUMS). US Bureau of Economic Analysis. Data are in $ 2023.
STATE OF THE STOCK: COUNTY OF KERN
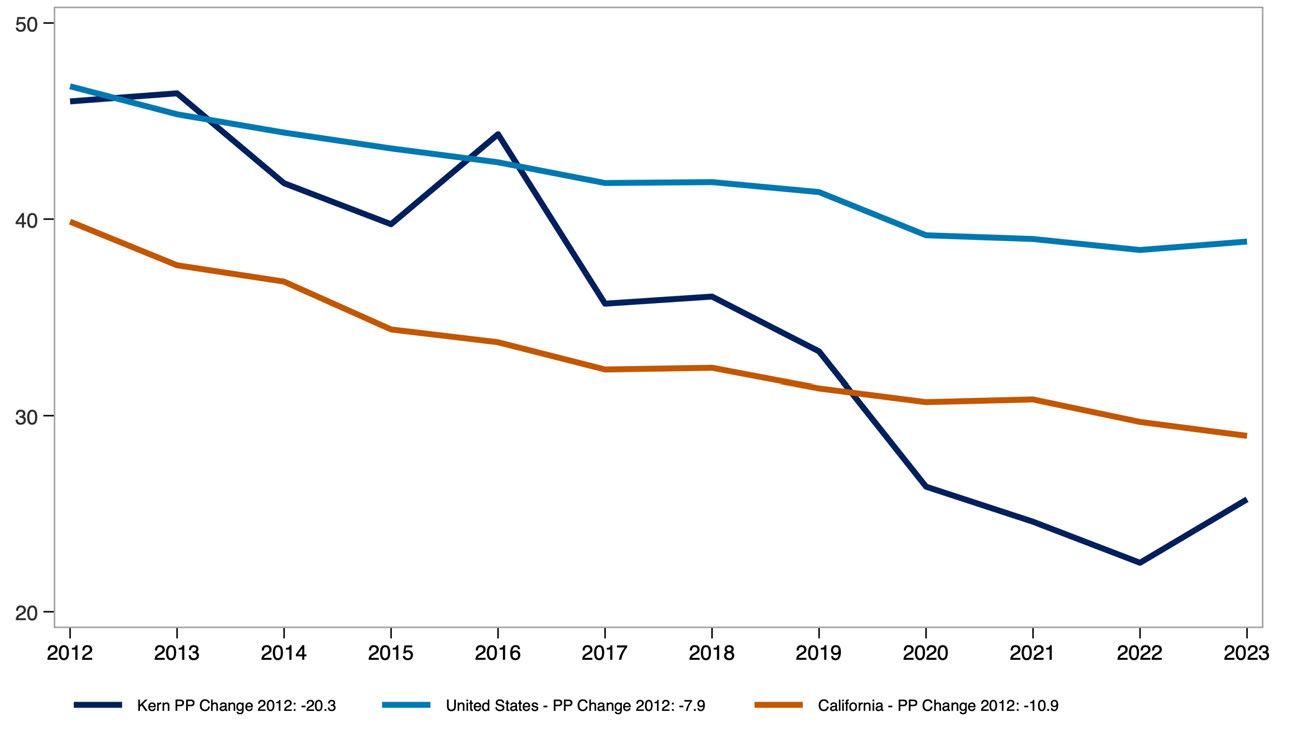
The share of renter-occupied housing units by the year the building was built offers insight into the age of the rental housing stock across the county, California, and the United States.
This measure helps illustrate how recently or how long ago rental units were added to each region’s housing supply.
Renter Occupied Housing by Year Built, Kern County
Source: 2023 American Community Survey. Analysis by Beacon Economics.

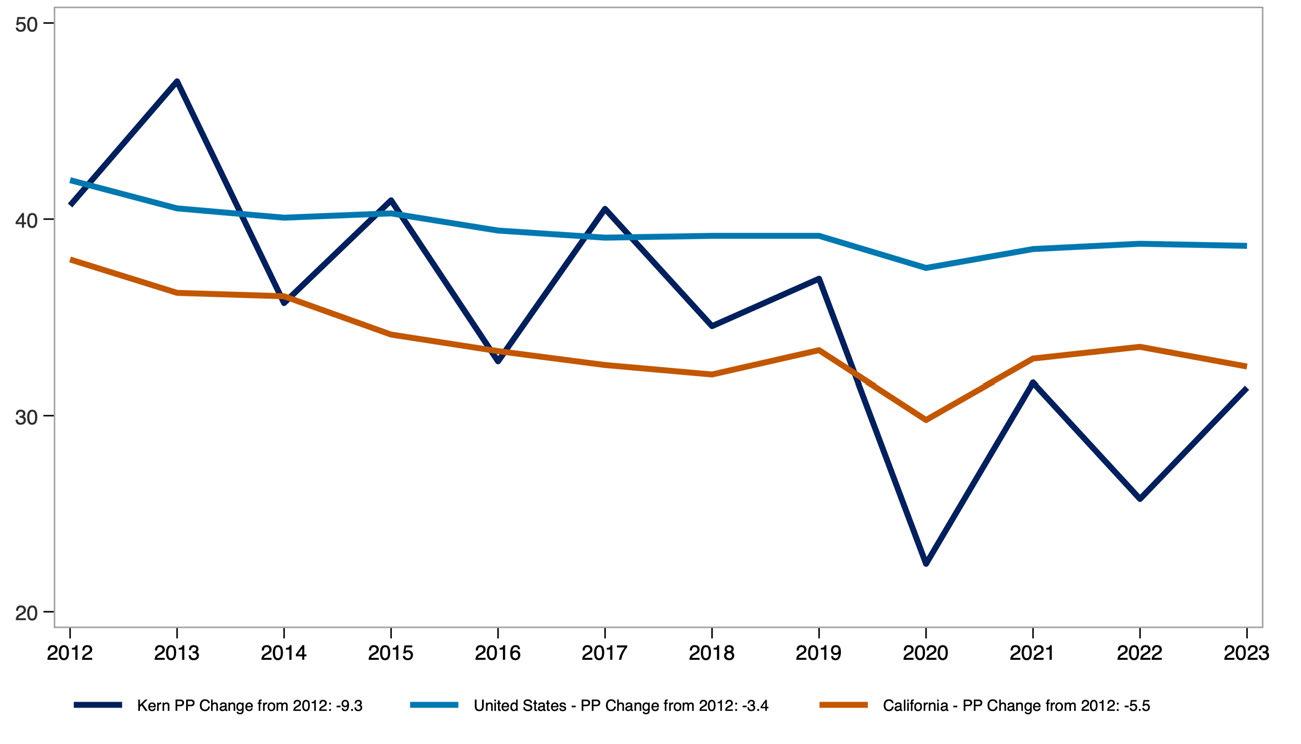
Producer Price Index (PPI) trends for goods and services used in multifamily residential construction reflect how input costs have changed over time. These trends influence the cost and feasibility of developing new rental housing. A broader commodity index is also included to show how construction-specific price movements compare to price trends across all industries.
Producer Price Index by Commodity, United States
Source: U.S. Bureau of Labor Statistics. Analysis by Beacon Economics.
Net Inputs to Multifamily
Residential Construction: Goods, Less Food and Energy
Net Inputs to Multifamily
Residential Construction: Services
All Commodities
Net Inputs to Multifamily
Residential Construction, Excluding Capital Investment, Labor, and Imports
The State of Renters in Los Angeles County
Renter incomes in Los Angeles County have grown significantly. Even after adjusting for inflation and subtracting rent, household income has increased by 37.4% over the past decade compared to 21.4% for renters nationwide.
Household composition is shifting as well. The share of single-person renter households in Los Angeles County has increased by 2.9 percentage points over the past decade, reflecting a broader trend toward smaller household sizes.
Rent burden has remained stable overall. For all renters, the median share of income spent on rent has held steady over the past decade. Among multi-person renter households, rent burden has declined from 30.5% in 2013 to 27.7% in 2023 pointing to modest improvements in affordability for shared households.
STATE OF THE MARKET: COUNTY OF LOS ANGELES
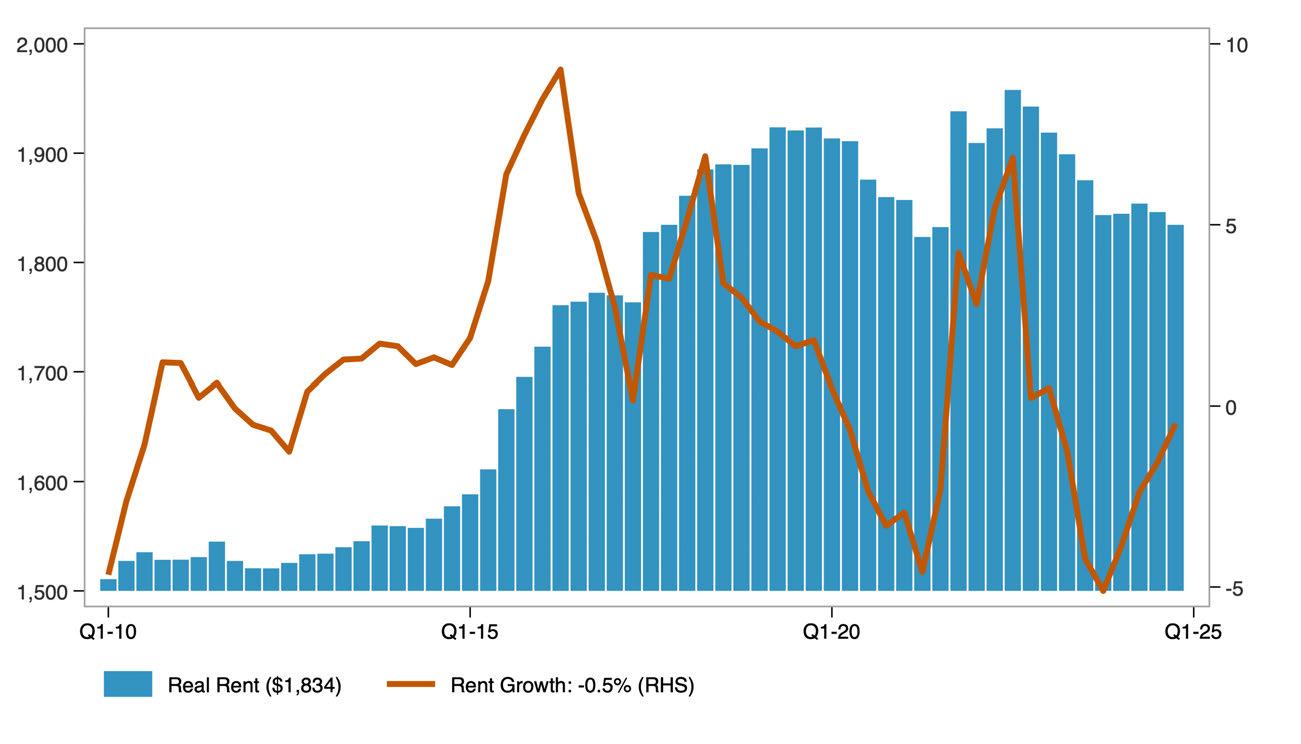
Asking rent represents the price landlords list for vacant units, rather than what current tenants are paying. When adjusted for inflation, it provides insight into how advertised rents have changed in real terms
The year-over-year rent growth rate captures the pace at which rents are rising or falling. Together, these measures reflect both the level and volatility of rental prices over time.
Real Asking Rents for Apartments in Los Angeles County ($ Q4-2024)
Source: US Bureau of Labor Statistics. Moody's Analytics. Analysis by Beacon Economics.
The distribution of real asking rents in the county, adjusted for inflation, shows how advertised rental prices have changed across the market over time. The 25th percentile reflects lower-cost rentals, the median represents the typical rental, and the 75th percentile indicates higher-cost rentals. Together, these measures illustrate how asking rents have changed at multiple price points, not just on average, over the past decade.
Distribution of Real Asking Rents in Los Angeles County
Source: Public Use Microdata Sample (PUMS). US Bureau of Economic Analysis. Analysis by Beacon Economics. Data are in $ 2023.
The distribution of real contract rents in the county, adjusted for inflation, shows how actual rents paid by tenants have changed across the market over the past decade. Unlike asking rents, contract rents reflect what households are currently paying, offering insight into renters’ real housing costs over time.
Distribution of Real Contract Rents in Los Angeles County
Source: Public Use Microdata Sample (PUMS). US Bureau of Economic Analysis. Analysis by Beacon Economics. Data are in $ 2023.
The apartment vacancy rate measures the share of rental units that are unoccupied and available for rent at a given time.
Vacancy Rate for Apartments in Los Angeles County
Source: Moody's Analytics. Analysis by Beacon Economics.
It serves as an indicator of the balance between rental housing supply and demand. Lower vacancy rates typically point to tighter market conditions, while higher rates suggest greater availability.
STATE OF RENTERS: COUNTY OF LOS ANGELES
Key demographic and socioeconomic characteristics of renter households include household size, poverty status, income distribution, language access, and household composition. Together, these indicators offer a snapshot of how renter households are structured and how those characteristics have shifted over time. The data combine absolute figures, such as the number of renter households, with percentages that reflect household traits, such as the share with children or seniors.
Demographic Characteristics of Los Angeles County Renter Households.
Source: American Community Survey Public Use Microdata Sample (PUMS) Analysis by Beacon Economics.
The share of single-person renter households who moved into their current home within the past two years reflects residential mobility among renters living alone.
This measure helps illustrate turnover in the rental market and may indicate trends in housing availability and economic stability for solo renters.
Share of Single-Person Renter Households That Have Moved in Previous 2 Years
Source: American Community Survey, Public Use Microdata Sample (PUMS). Analysis by Beacon Economics.
The share of multi-person renter households who moved within the past two years reflects residential mobility among shared or family households.
This measure offers insight into turnover rates and housing stability for renters living with others, whether as families or roommates.
Share of Multi-Person Renter Households That Have Moved in Previous 2 Years
Source: American Community Survey, Public Use Microdata Sample (PUMS). Analysis by Beacon Economics.
The share of renter households that are single person versus multi-person provides insight into how household size and composition have shifted over time.
Demographic Characteristics of Los Angeles County Renter Households.
Source: American Community Survey Public Use Microdata Sample (PUMS) Analysis by Beacon Economics.
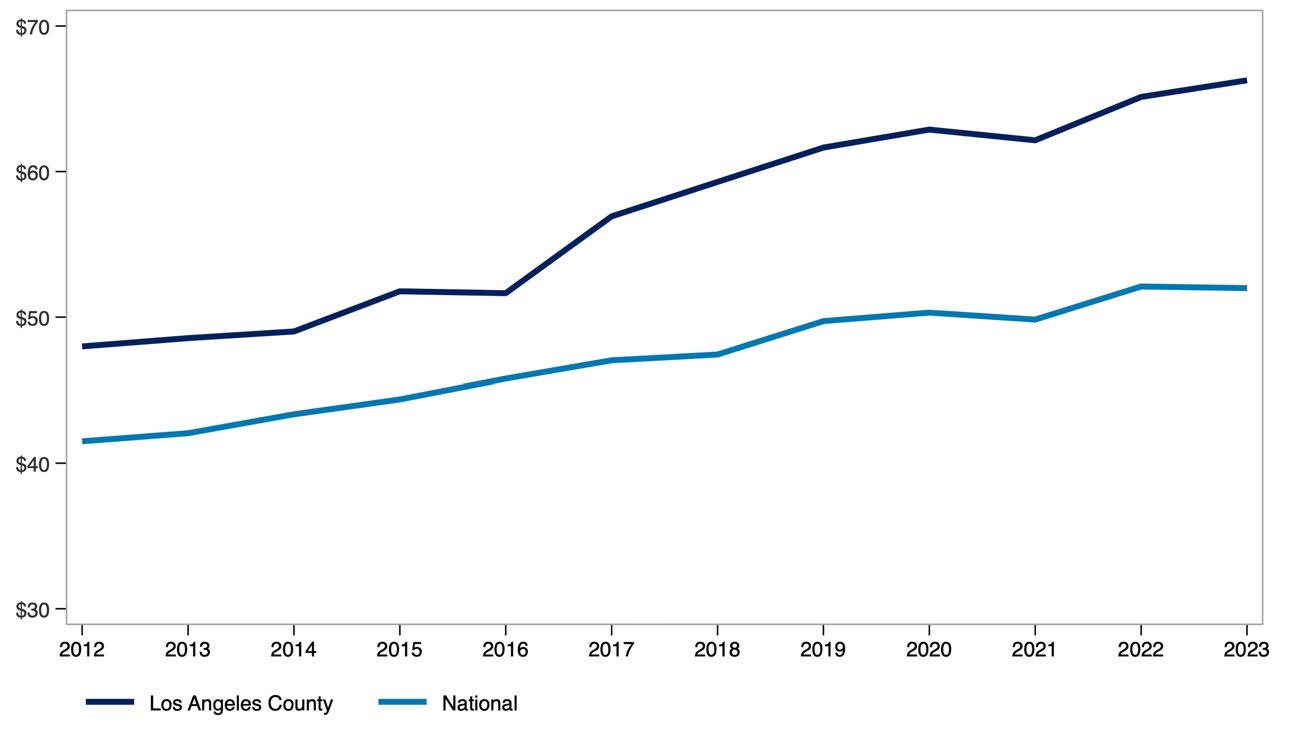
Real median pre-tax income of renter households, measured in 2023 dollars, reflects how renter incomes have changed in purchasing power over time.
Comparing the county to the U.S. highlights how local renter income levels have evolved relative to the national average.
Real Median Renter Pre-Tax Income ($ 2023, 000s)
Source: Public Use Microdata Sample (PUMS) Analysis by Beacon Economics.
The share of income spent on rent, broken out by renter household type and income level, shows how rent burden varies across the population. This measure compares single-person and multi-person households at the 25th percentile, median, and 75th percentile of the burden distribution, offering insight into how both household size affects housing affordability.
Monthly renter household income before and after rent adjusted for inflation, highlights how much income renters have overall and how much remains after covering housing costs. Presented at the 25th percentile, median, and 75th percentile, this measure provides a view of post-rent income across different points in the income distribution.
Real Monthly Pre/Post-Rent Income for Renter Households in Los Angeles County
Source: Public Use Microdata Sample (PUMS). US Bureau of Economic Analysis. Analysis by Beacon Economics. Data are in $ 2023.
STATE OF THE STOCK: COUNTY OF LOS ANGELES
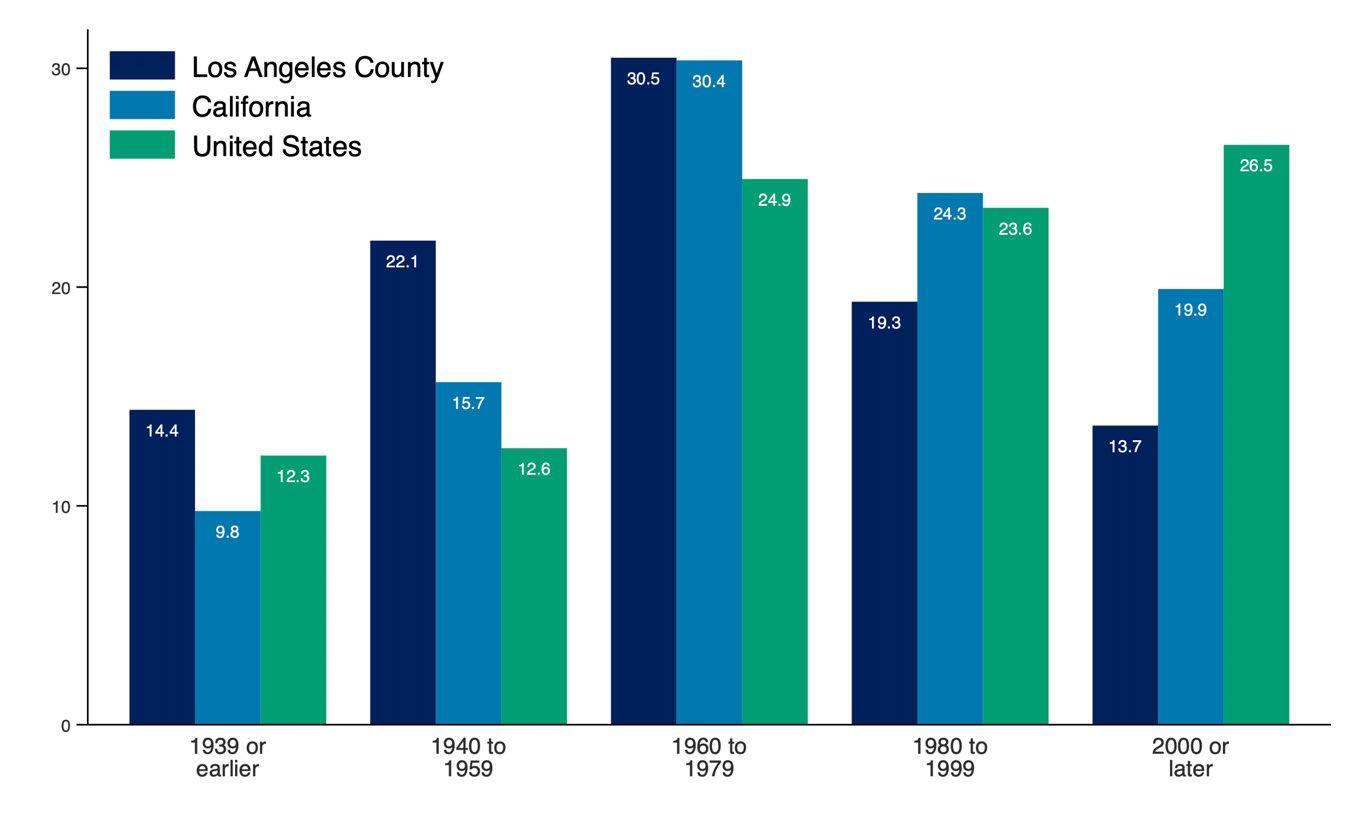
The share of renter-occupied housing units by the year the building was built offers insight into the age of the rental housing stock across the county, California, and the United States.
This measure helps illustrate how recently or how long ago rental units were added to each region’s housing supply.
Renter
Occupied Housing by Year Built, Los Angeles County
Source: 2023 American Community Survey. Analysis by Beacon Economics.
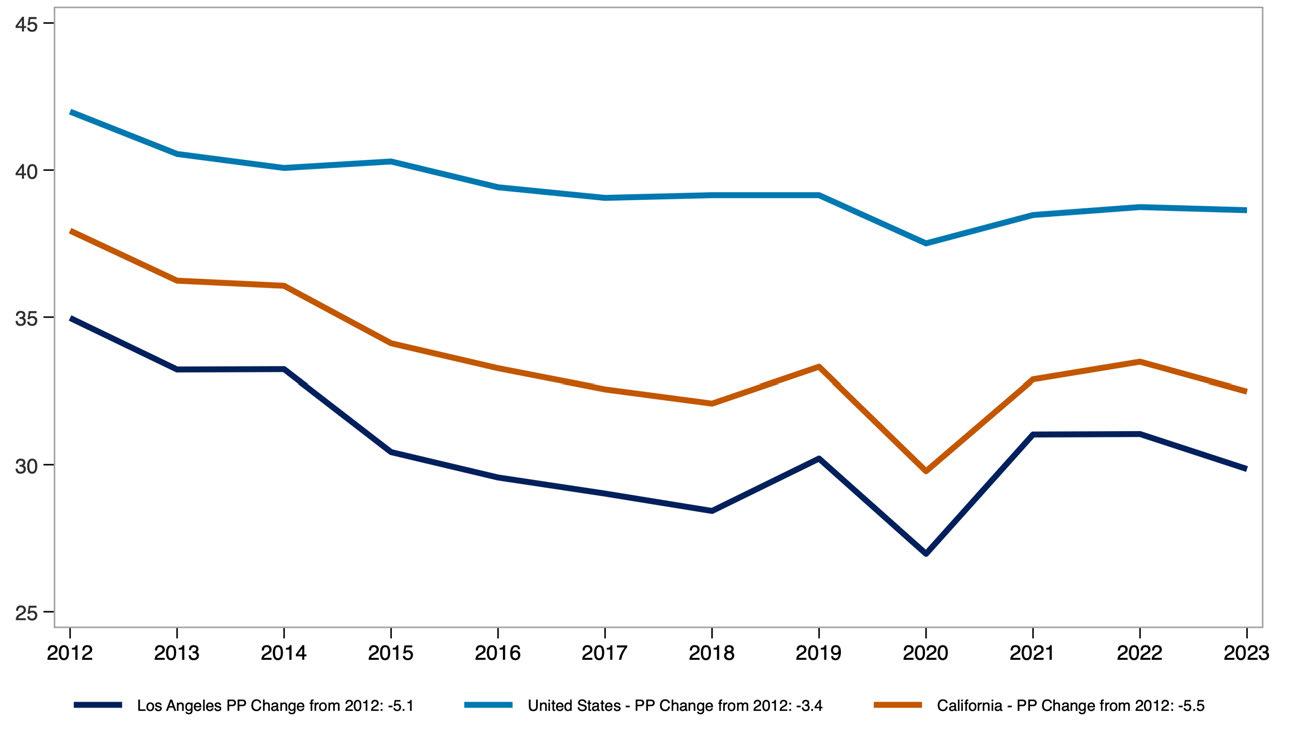
Producer Price Index (PPI) trends for goods and services used in multifamily residential construction reflect how input costs have changed over time. These trends influence the cost and feasibility of developing new rental housing. A broader commodity index is also included to show how construction-specific price movements compare to price trends across all industries.
Producer Price Index by Commodity, United States
Source: U.S. Bureau of Labor Statistics. Analysis by Beacon Economics.
Net Inputs to Multifamily
Residential Construction: Goods, Less Food and Energy
Net Inputs to Multifamily
Residential Construction: Services
All Commodities
Net Inputs to Multifamily
Residential Construction, Excluding Capital Investment, Labor, and Imports
The State of Renters in Monterey County
Renter incomes in Monterey County have grown significantly. Even after adjusting for inflation and subtracting rent, household income has increased by 33.6% over the past decade compared to 21.4% for renters nationwide.
Household composition is shifting as well. The share of single-person renter households in Monterey County has increased by 1.9 percentage points over the past decade, reflecting a broader trend toward smaller household sizes.
Rent burden has remained stable overall. For all renters, the median share of income spent on rent has held steady over the past decade. Among multi-person renter households, rent burden has declined from 29.8% in 2013 to 28.8% in 2023 pointing to modest improvements in affordability for shared households.
STATE OF THE MARKET: COUNTY OF MONTEREY
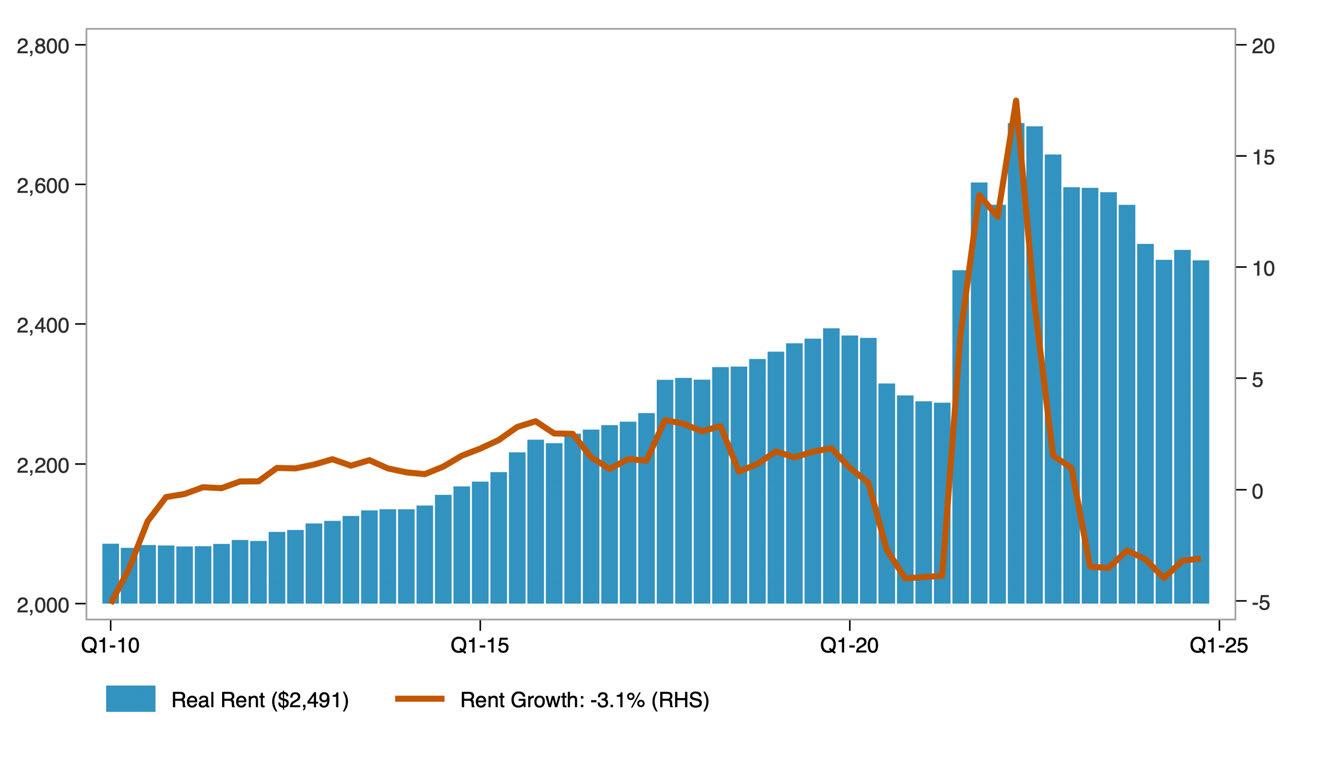
Asking rent represents the price landlords list for vacant units, rather than what current tenants are paying. When adjusted for inflation, it provides insight into how advertised rents have changed in real terms.
The year-over-year rent growth rate captures the pace at which rents are rising or falling. Together, these measures reflect both the level and volatility of rental prices over time.
Real Asking Rents for Apartments in Monterey County ($
Q4-2024)
Source: US Bureau of Labor Statistics. Moody's Analytics. Analysis by Beacon Economics.
The distribution of real asking rents in the county, adjusted for inflation, shows how advertised rental prices have changed across the market over time. The 25th percentile reflects lower-cost rentals, the median represents the typical rental, and the 75th percentile indicates higher-cost rentals. Together, these measures illustrate how asking rents have changed at multiple price points, not just on average, over the past decade.
Distribution of Real Asking Rents in Monterey County
Source: Public Use Microdata Sample (PUMS). US Bureau of Economic Analysis. Analysis by Beacon Economics. Data are in $ 2023.
The distribution of real contract rents in the county, adjusted for inflation, shows how actual rents paid by tenants have changed across the market over the past decade. Unlike asking rents, contract rents reflect what households are currently paying, offering insight into renters’ real housing costs over time.
Distribution of Real Contract Rents in Monterey County
Source: Public Use Microdata Sample (PUMS). US Bureau of Economic Analysis. Analysis by Beacon Economics. Data are in $ 2023.
The apartment vacancy rate measures the share of rental units that are unoccupied and available for rent at a given time.
Vacancy Rate for Apartments in Monterey County
Source: Moody's Analytics. Analysis by Beacon Economics.
It serves as an indicator of the balance between rental housing supply and demand. Lower vacancy rates typically point to tighter market conditions, while higher rates suggest greater availability.
STATE OF RENTERS: COUNTY OF MONTEREY
Key demographic and socioeconomic characteristics of renter households include household size, poverty status, income distribution, language access, and household composition. Together, these indicators offer a snapshot of how renter households are structured and how those characteristics have shifted over time. The data combine absolute figures, such as the number of renter households, with percentages that reflect household traits, such as the share with children or seniors.
Demographic Characteristics of Monterey County Renter Households.
Source: American Community Survey Public Use Microdata Sample (PUMS). Analysis by Beacon Economics.
The share of single-person renter households who moved into their current home within the past two years reflects residential mobility among renters living alone.
This measure helps illustrate turnover in the rental market and may indicate trends in housing availability and economic stability for solo renters.
Share of Single-Person Renter Households That Have Moved in Previous 2 Years
Source: American Community Survey, Public Use Microdata Sample (PUMS). Analysis by Beacon Economics.
The share of multi-person renter households who moved within the past two years reflects residential mobility among shared or family households.
This measure offers insight into turnover rates and housing stability for renters living with others, whether as families or roommates.
Share of Multi-Person Renter Households That Have Moved in Previous 2 Years
Source: American Community Survey, Public Use Microdata Sample (PUMS). Analysis by Beacon Economics.
The share of renter households that are single person versus multi-person provides insight into how household size and composition have shifted over time.
Demographic Characteristics of Monterey County Renter Households.
Source: American Community Survey Public Use Microdata Sample (PUMS). Analysis by Beacon Economics.
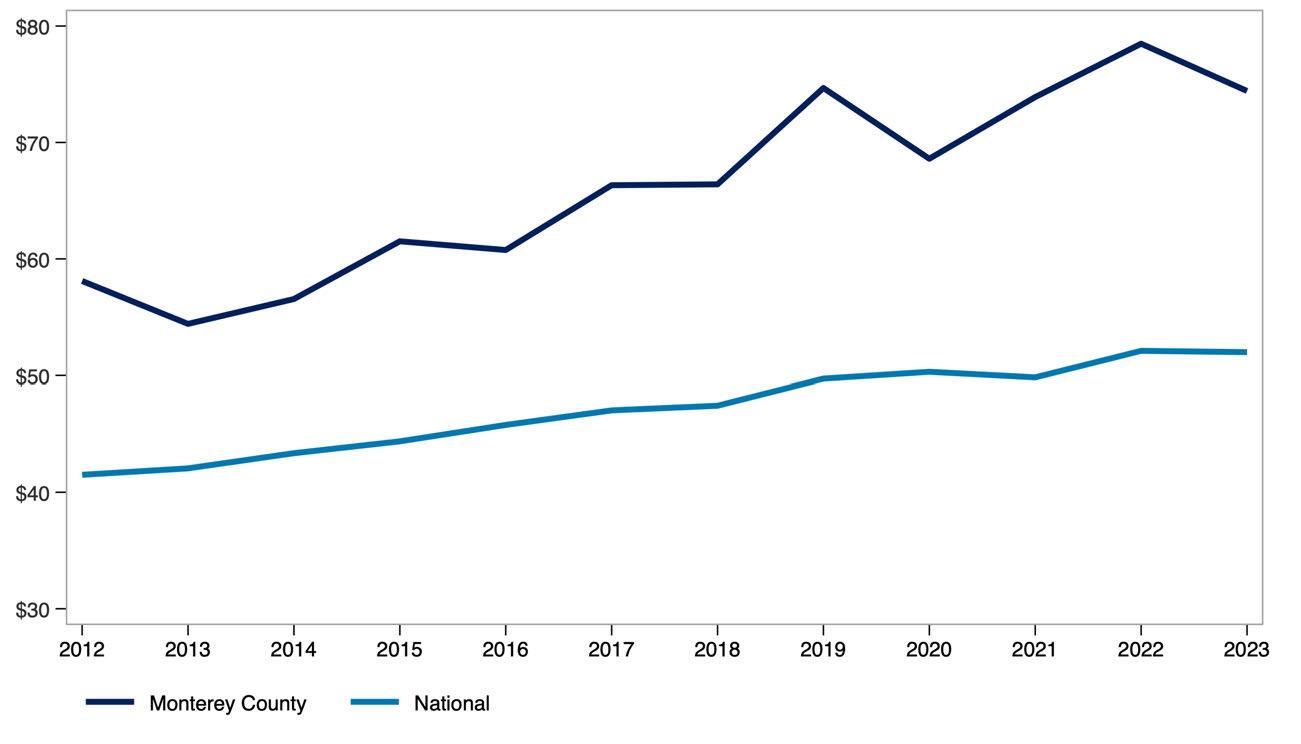
Real median pre-tax income of renter households, measured in 2023 dollars, reflects how renter incomes have changed in purchasing power over time.
Comparing the county to the U.S. highlights how local renter income levels have evolved relative to the national average.
Real Median Renter Pre-Tax Income ($ 2023, 000s)
Source: Public Use Microdata Sample (PUMS). Analysis by Beacon Economics.
The share of income spent on rent, broken out by renter household type and income level, shows how rent burden varies across the population. This measure compares single-person and multi-person households at the 25th percentile, median, and 75th percentile of the burden distribution, offering insight into how both household size affects housing affordability.
Monthly renter household income before and after rent adjusted for inflation, highlights how much income renters have overall and how much remains after covering housing costs. Presented at the 25th percentile, median, and 75th percentile, this measure provides a view of post-rent income across different points in the income distribution.
Real Monthly Pre/Post-Rent Income for Renter Households in Monterey County
Source: Public Use Microdata Sample (PUMS). US Bureau of Economic Analysis. Analysis by Beacon Economics. Data are in $ 2023.
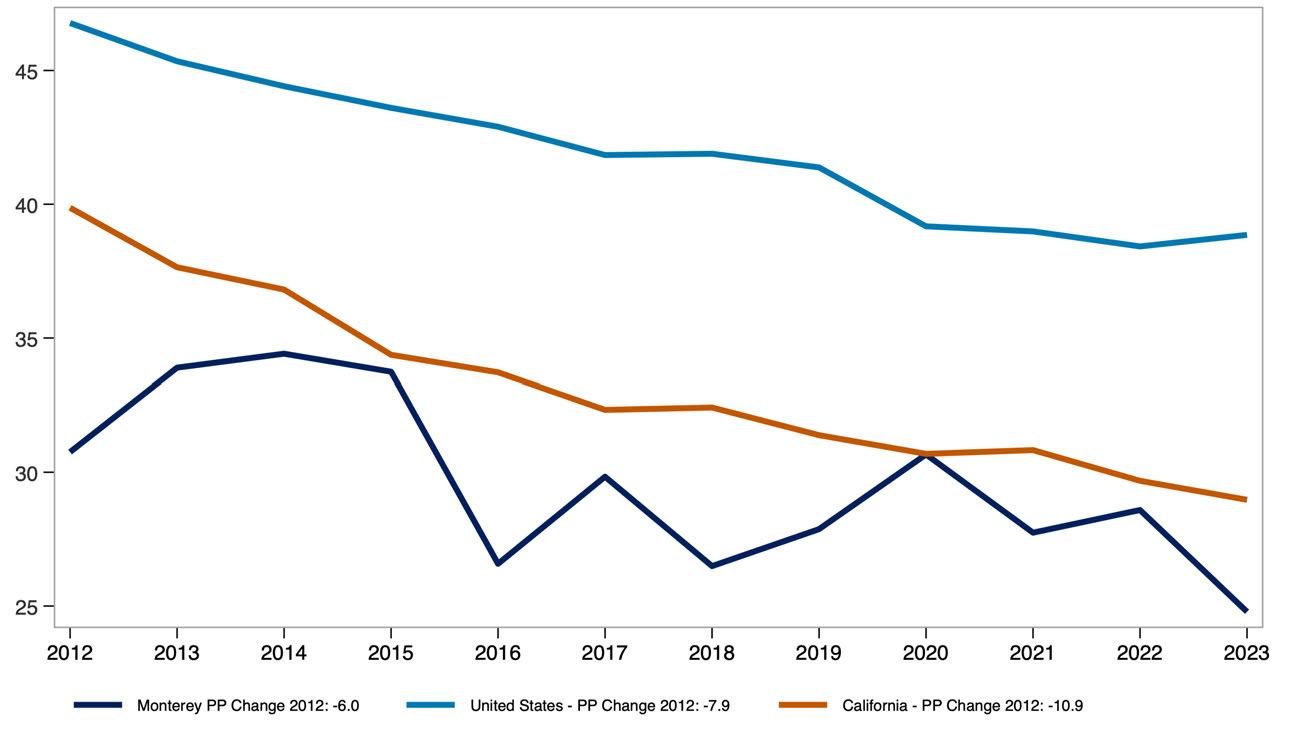
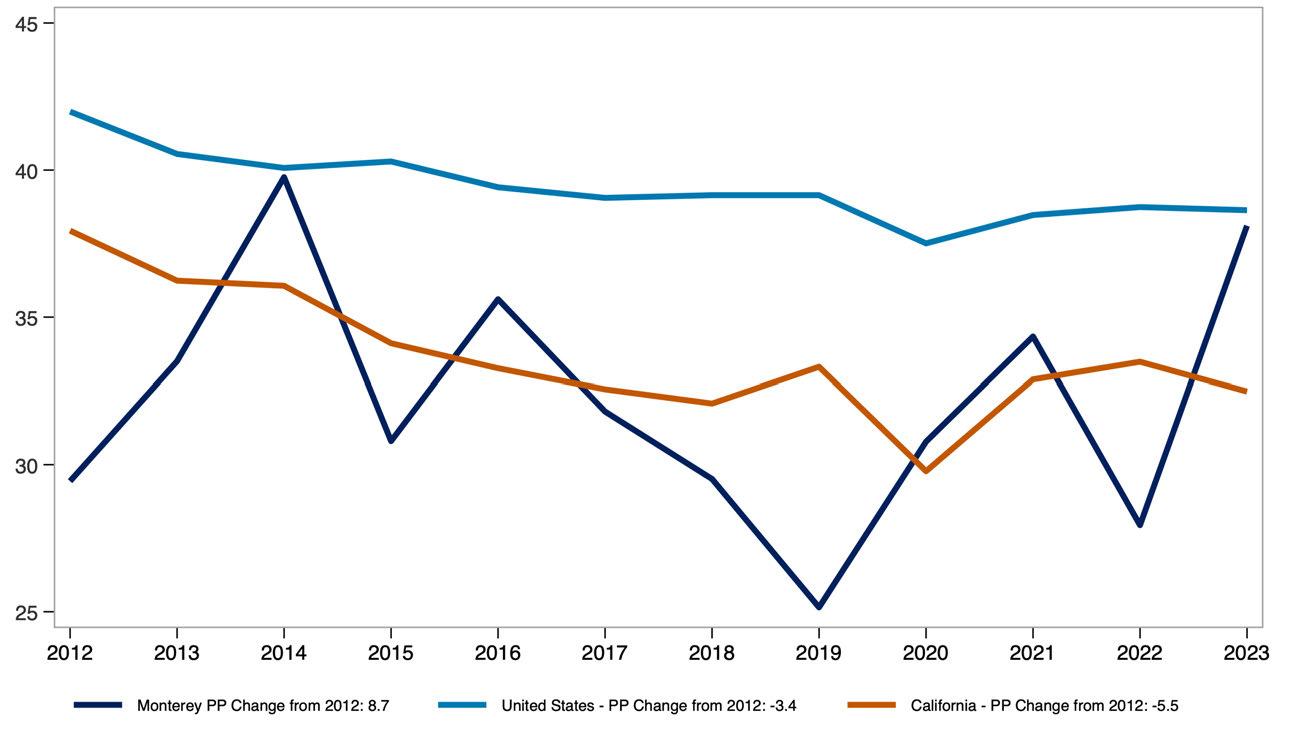
STATE OF THE STOCK: COUNTY OF MONTEREY
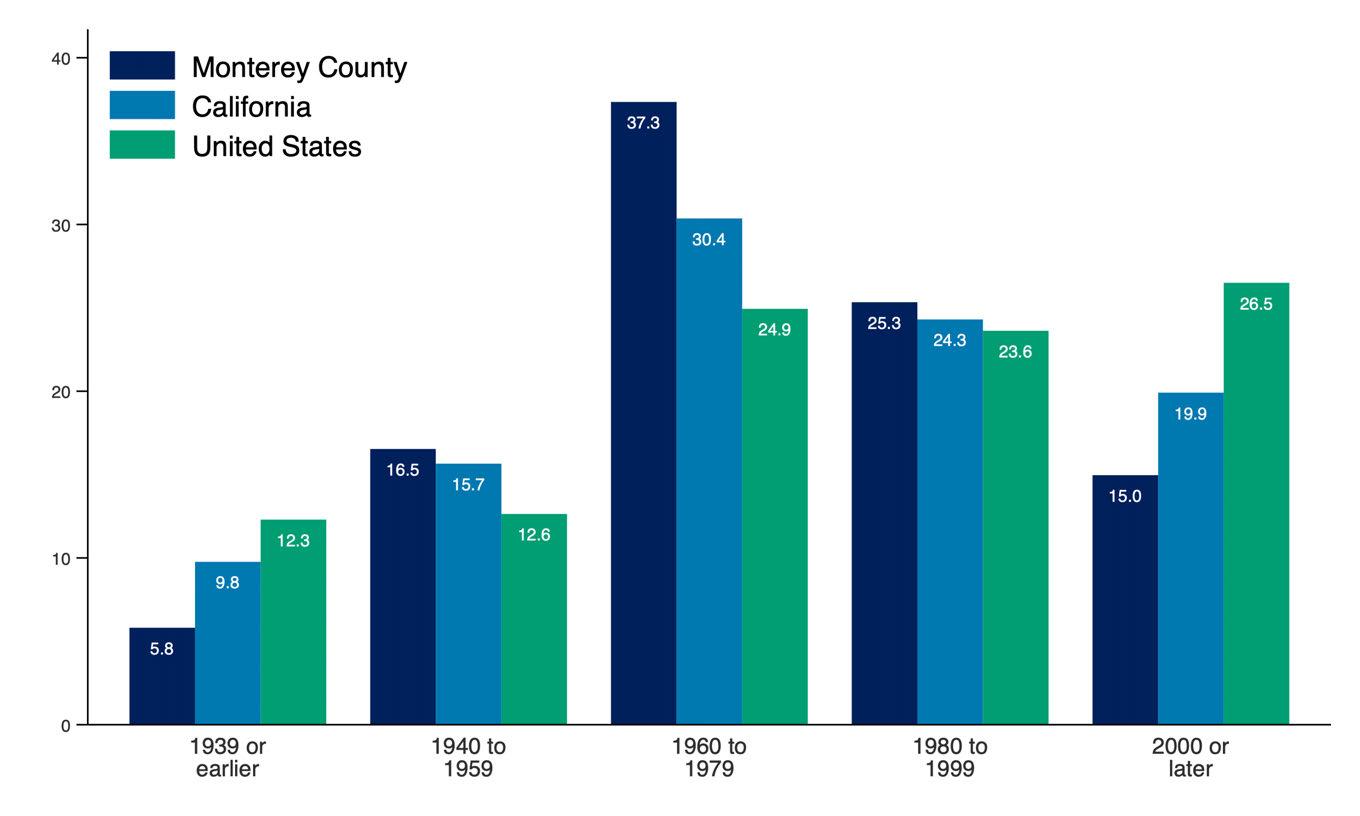
The share of renter-occupied housing units by the year the building was built offers insight into the age of the rental housing stock across the county, California, and the United States. This measure helps illustrate how recently or how long ago rental units were added to each region’s housing supply.
Renter Occupied Housing by Year Built, Monterey County
Source: 2023 American Community Survey. Analysis by Beacon Economics.
Producer Price Index (PPI) trends for goods and services used in multifamily residential construction reflect how input costs have changed over time. These trends influence the cost and feasibility of developing new rental housing. A broader commodity index is also included to show how construction-specific price movements compare to price trends across all industries.
Producer Price Index by Commodity, United States
Source: U.S. Bureau of Labor Statistics. Analysis by Beacon Economics.
Net Inputs to Multifamily
Residential Construction: Goods, Less Food and Energy
Net Inputs to Multifamily
Residential Construction: Services
All Commodities
Net Inputs to Multifamily
Residential Construction, Excluding Capital Investment, Labor, and Imports
The State of Renters in Orange County
Renter incomes in Orange County have grown significantly. Even after adjusting for inflation and subtracting rent, household income has increased by 20.4% over the past decade compared to 21.4% for renters nationwide.
Household composition is shifting as well. The share of single-person renter households in Orange County has increased by 1.6 percentage points over the past decade, reflecting a broader trend toward smaller household sizes.
Rent burden has remained stable overall. For all renters, the median share of income spent on rent has held steady over the past decade. Among multi-person renter households, rent burden has declined from 29.6% in 2013 to 28.7% in 2023 pointing to modest improvements in affordability for shared households.
STATE OF THE MARKET: COUNTY OF ORANGE
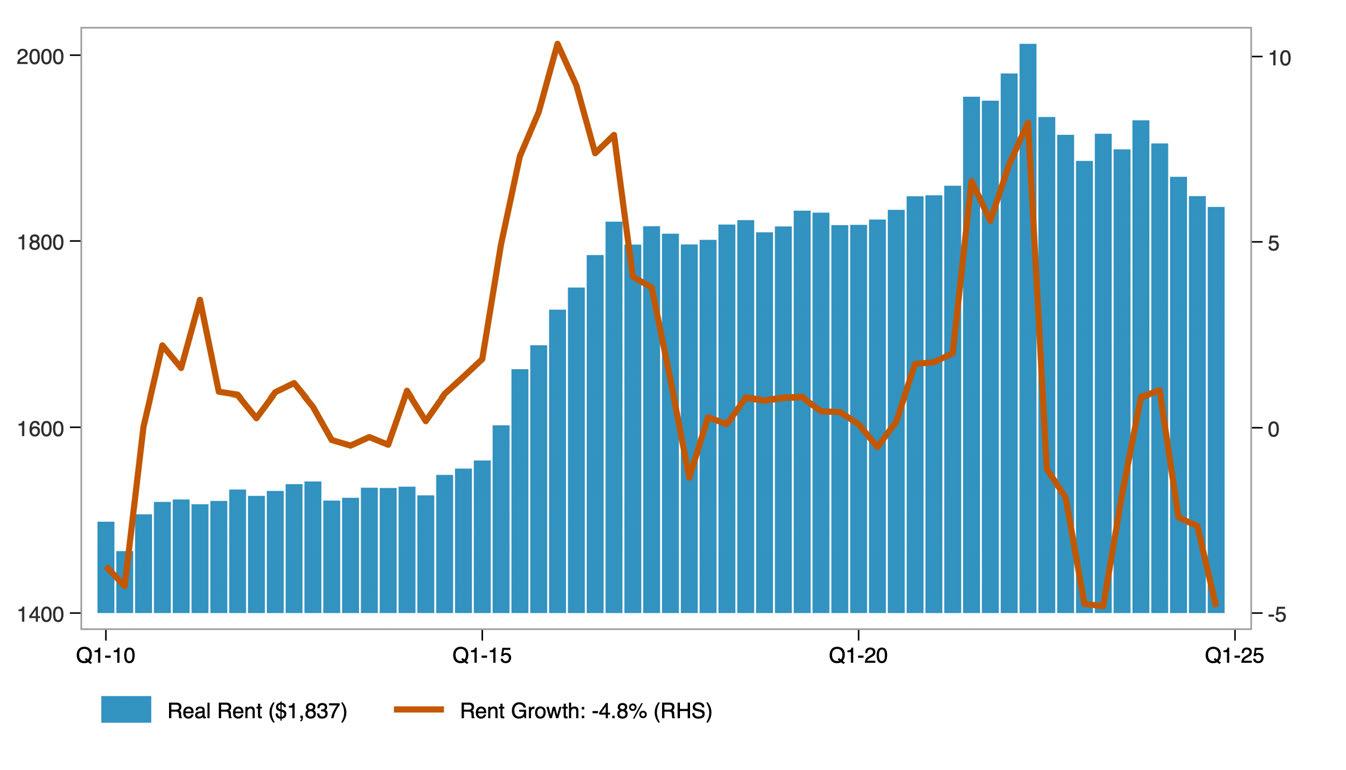
Asking rent represents the price landlords list for vacant units, rather than what current tenants are paying. When adjusted for inflation, it provides insight into how advertised rents have changed in real terms.
The year-over-year rent growth rate captures the pace at which rents are rising or falling. Together, these measures reflect both the level and volatility of rental prices over time.
Real Asking Rents for Apartments in Orange County ($ Q4-2024)
Source: US Bureau of Labor Statistics. Moody's Analytics. Analysis by Beacon Economics.
The distribution of real asking rents in the county, adjusted for inflation, shows how advertised rental prices have changed across the market over time. The 25th percentile reflects lower-cost rentals, the median represents the typical rental, and the 75th percentile indicates higher-cost rentals. Together, these measures illustrate how asking rents have changed at multiple price points, not just on average, over the past decade.
Distribution of Real Asking Rents in Orange County
Source: Public Use Microdata Sample (PUMS). US Bureau of Economic Analysis. Analysis by Beacon Economics. Data are in $ 2023.
The distribution of real contract rents in the county, adjusted for inflation, shows how actual rents paid by tenants have changed across the market over the past decade. Unlike asking rents, contract rents reflect what households are currently paying, offering insight into renters’ real housing costs over time.
Distribution of Real Contract Rents in Orange County
Source: Public Use Microdata Sample (PUMS). US Bureau of Economic Analysis. Analysis by Beacon Economics. Data are in $ 2023.
The apartment vacancy rate measures the share of rental units that are unoccupied and available for rent at a given time.
Vacancy Rate for Apartments in Orange County
Source: Moody's Analytics. Analysis by Beacon Economics.
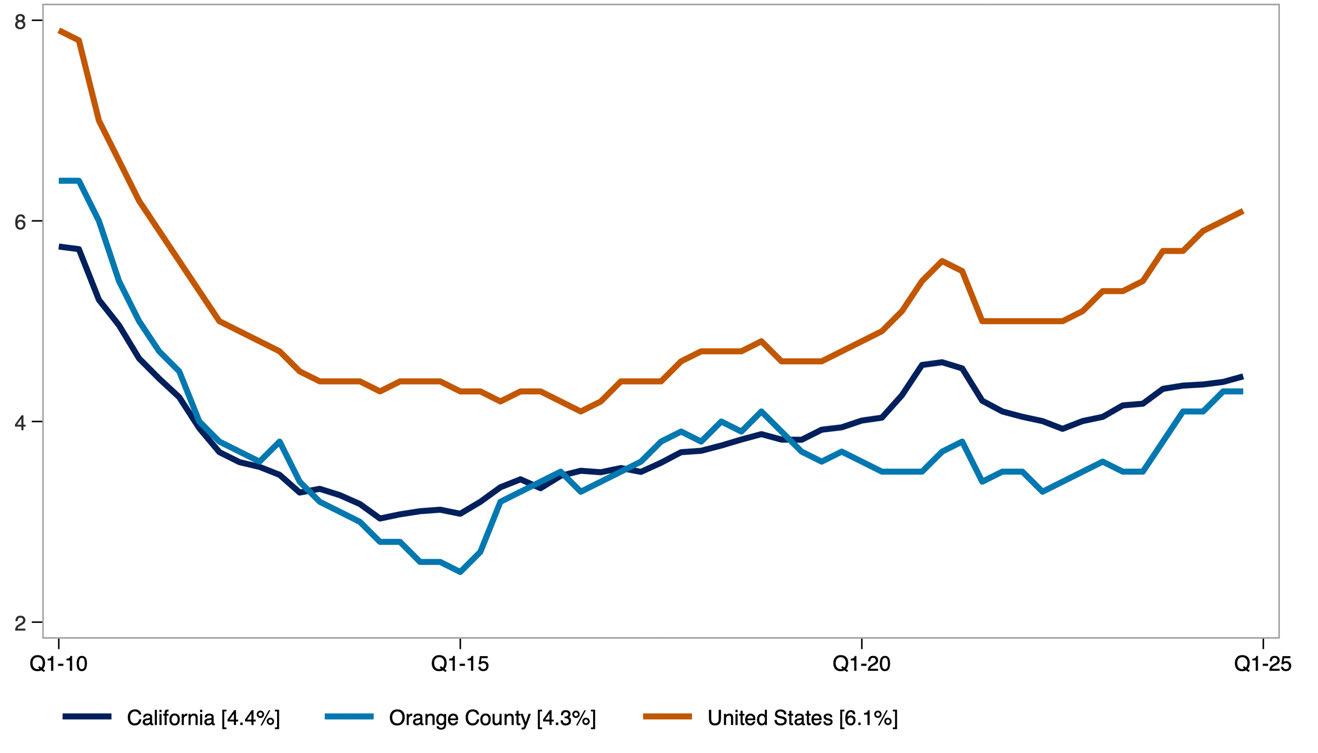
It serves as an indicator of the balance between rental housing supply and demand. Lower vacancy rates typically point to tighter market conditions, while higher rates suggest greater availability.
STATE OF RENTERS: COUNTY OF ORANGE
Key demographic and socioeconomic characteristics of renter households include household size, poverty status, income distribution, language access, and household composition. Together, these indicators offer a snapshot of how renter households are structured and how those characteristics have shifted over time. The data combine absolute figures, such as the number of renter households, with percentages that reflect household traits, such as the share with children or seniors.
Demographic Characteristics of Orange County Renter Households. Orange
Source: American Community Survey Public Use Microdata Sample (PUMS) Analysis by Beacon Economics.
The share of single-person renter households who moved into their current home within the past two years reflects residential mobility among renters living alone.
This measure helps illustrate turnover in the rental market and may indicate trends in housing availability and economic stability for solo renters.
Share of Single-Person Renter Households That Have Moved in Previous 2 Years
Source: American Community Survey, Public Use Microdata Sample (PUMS). Analysis by Beacon Economics.
The share of multi-person renter households who moved within the past two years reflects residential mobility among shared or family households.
This measure offers insight into turnover rates and housing stability for renters living with others, whether as families or roommates.
Share of Multi-Person Renter Households That Have Moved in Previous 2 Years
Source: American Community Survey, Public Use Microdata Sample (PUMS). Analysis by Beacon Economics.
The share of renter households that are single person versus multi-person provides insight into how household size and composition have shifted over time.
Demographic Characteristics of Orange County Renter Households.
Source: American Community Survey Public Use Microdata Sample (PUMS) Analysis by Beacon Economics.
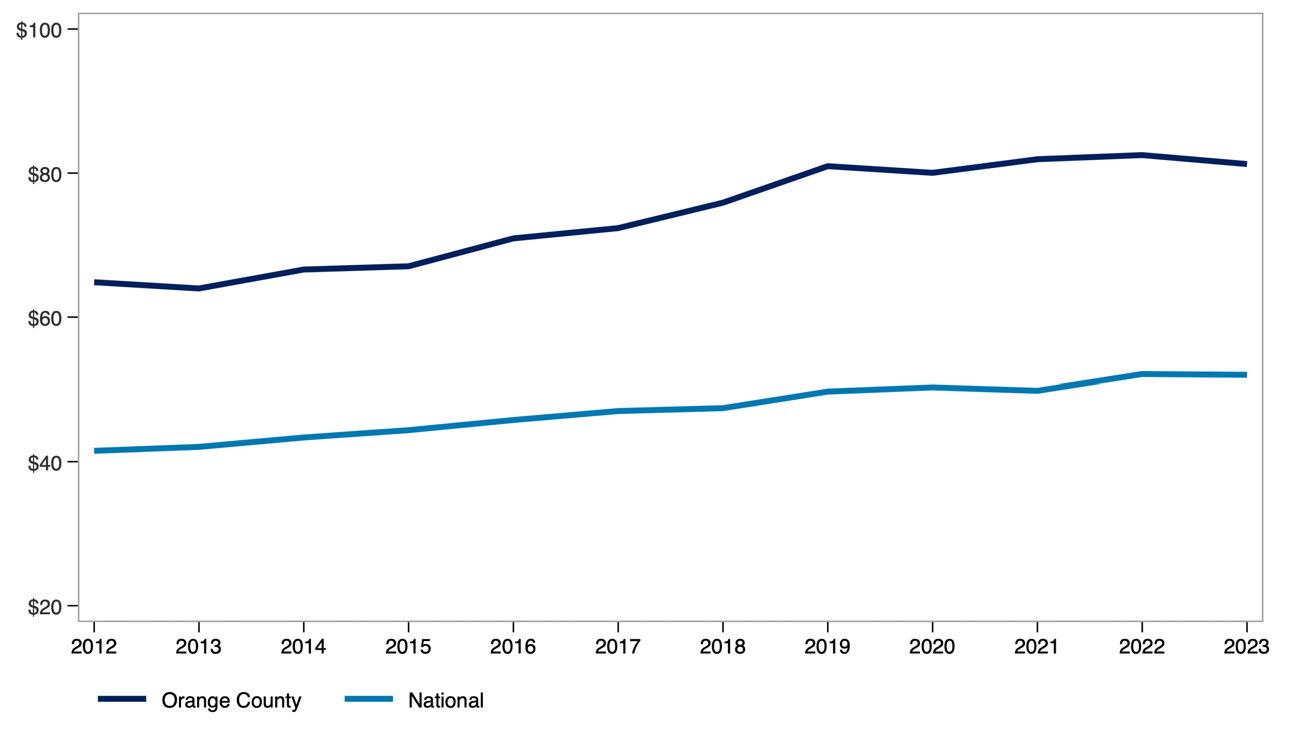
Real median pre-tax income of renter households, measured in 2023 dollars, reflects how renter incomes have changed in purchasing power over time.
Comparing the county to the U.S. highlights how local renter income levels have evolved relative to the national average.
Real Median Renter Pre-Tax Income ($ 2023, 000s)
Source: Public Use Microdata Sample (PUMS). Analysis by Beacon Economics.
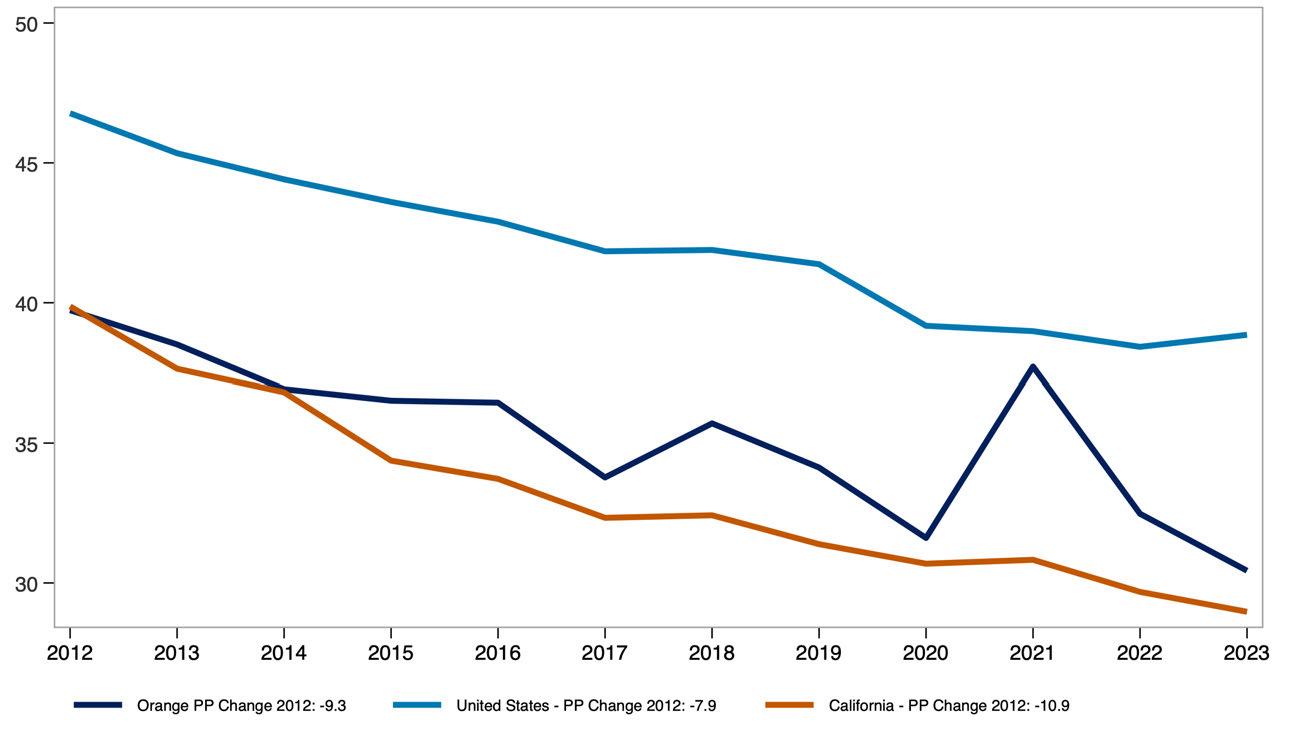
The share of income spent on rent, broken out by renter household type and income level, shows how rent burden varies across the population. This measure compares single-person and multi-person households at the 25th percentile, median, and 75th percentile of the burden distribution, offering insight into how both household size affects housing affordability.
Monthly renter household income before and after rent adjusted for inflation, highlights how much income renters have overall and how much remains after covering housing costs. Presented at the 25th percentile, median, and 75th percentile, this measure provides a view of post-rent income across different points in the income distribution.
Real Monthly Pre/Post-Rent Income for Renter Households in Orange County
Source: Public Use Microdata Sample (PUMS). US Bureau of Economic Analysis. Analysis by Beacon Economics. Data are in $ 2023.
STATE OF THE STOCK: COUNTY OF ORANGE
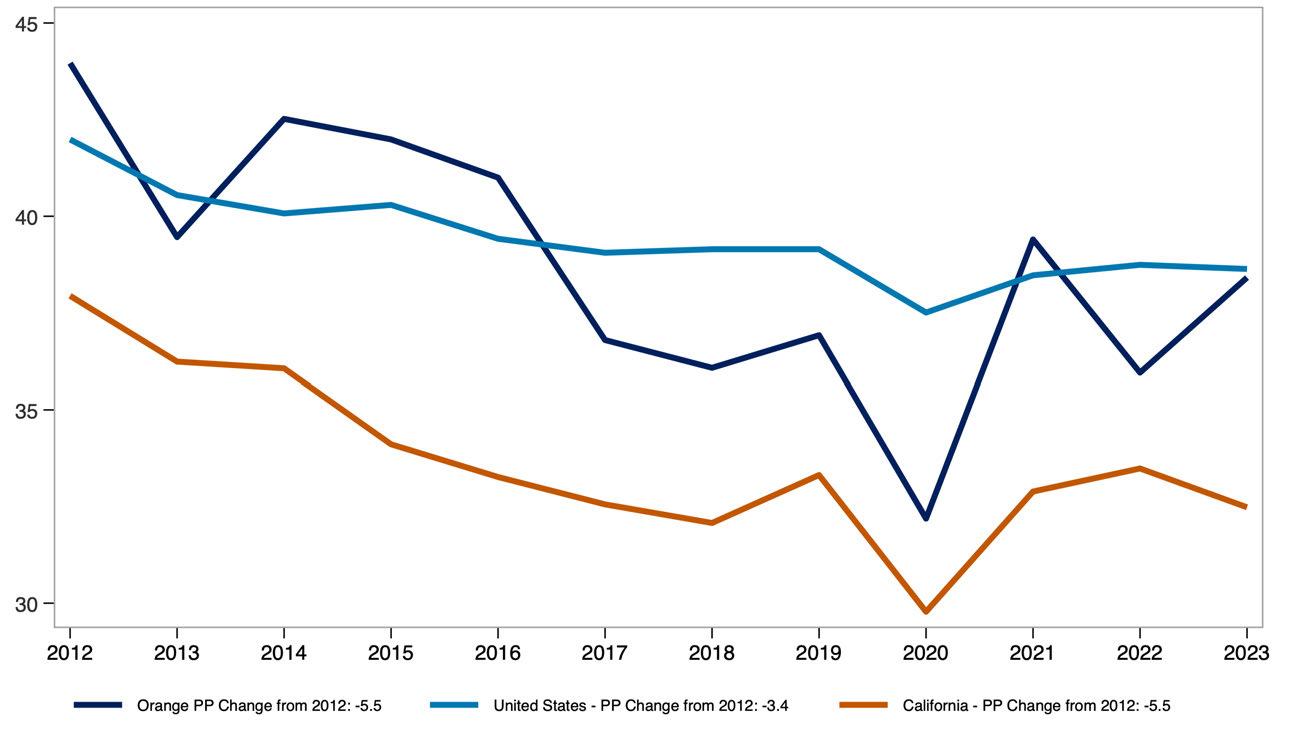
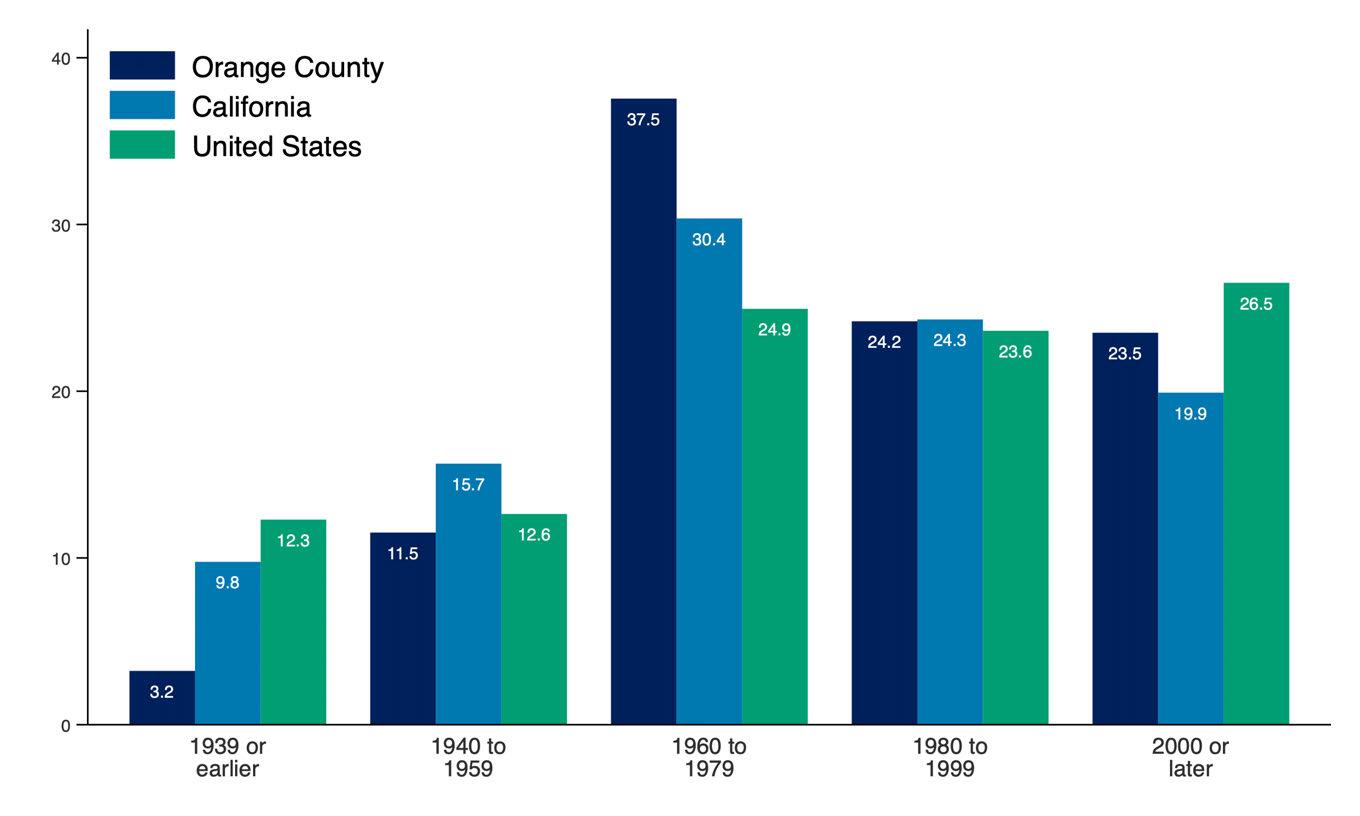
The share of renter-occupied housing units by the year the building was built offers insight into the age of the rental housing stock across the county, California, and the United States. This measure helps illustrate how recently or how long ago rental units were added to each region’s housing supply.
Renter Occupied Housing by Year Built, Orange County
Source: 2023 American Community Survey. Analysis by Beacon Economics.
Producer Price Index (PPI) trends for goods and services used in multifamily residential construction reflect how input costs have changed over time. These trends influence the cost and feasibility of developing new rental housing. A broader commodity index is also included to show how construction-specific price movements compare to price trends across all industries.
Producer Price Index by Commodity, United States
Source: U.S. Bureau of Labor Statistics. Analysis by Beacon Economics.
Net Inputs to Multifamily
Residential Construction: Goods, Less Food and Energy
Net Inputs to Multifamily
Residential Construction: Services
All Commodities
Net Inputs to Multifamily
Residential Construction, Excluding Capital Investment, Labor, and Imports
The State of Renters in Placer County
Renter incomes in Placer County have grown significantly. Even after adjusting for inflation and subtracting rent, household income has increased by 35.3% over the past decade compared to 21.4% for renters nationwide.
Household composition is shifting as well. The share of single-person renter households in Placer County has increased by 1.3 percentage points over the past decade, reflecting a broader trend toward smaller household sizes.
Rent burden has remained stable overall. For all renters, the median share of income spent on rent has held steady over the past decade. Among multi-person renter households, rent burden has increased slightly—from 25.2% in 2013 to 25.7% in 2023.
STATE OF THE MARKET: COUNTY OF PLACER
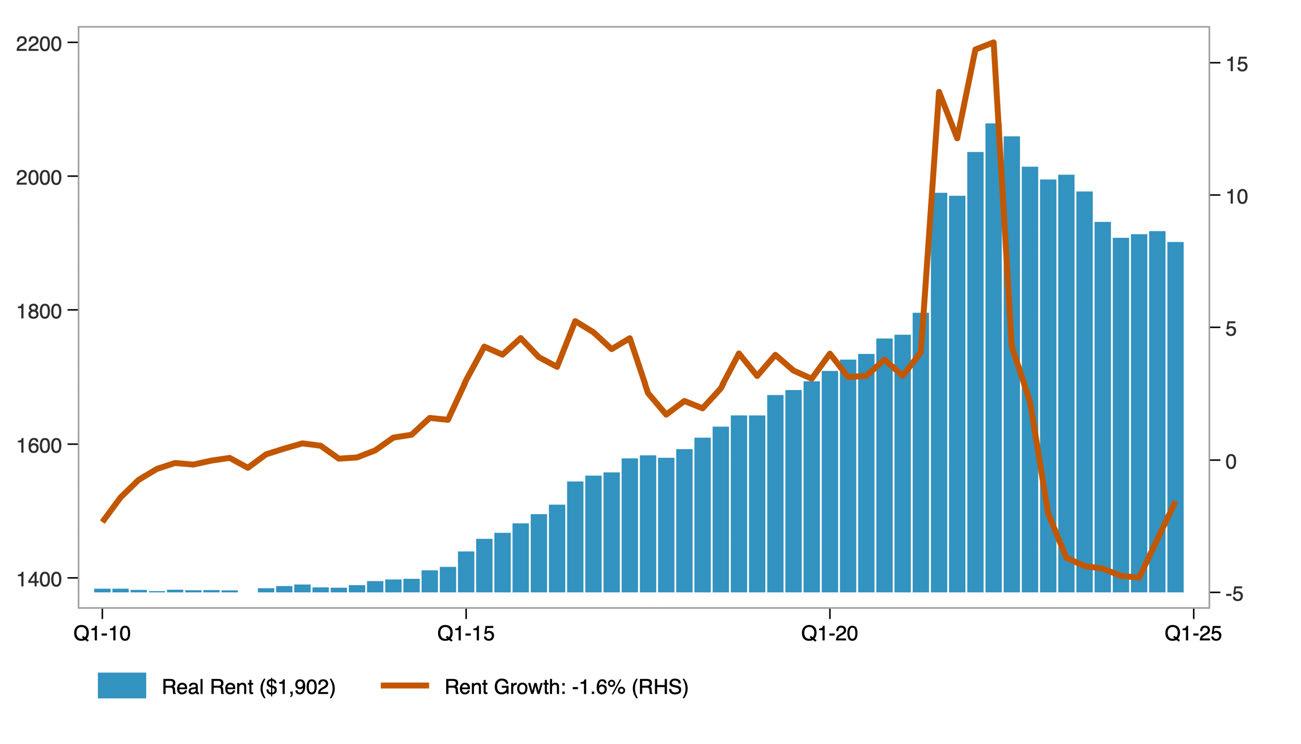
Asking rent represents the price landlords list for vacant units, rather than what current tenants are paying. When adjusted for inflation, it provides insight into how advertised rents have changed in real terms
The year-over-year rent growth rate captures the pace at which rents are rising or falling. Together, these measures reflect both the level and volatility of rental prices over time.
Real Asking Rents for Apartments in Placer County ($ Q4-2024)
Source: US Bureau of Labor Statistics. Moody's Analytics. Analysis by Beacon Economics.
The distribution of real asking rents in the county, adjusted for inflation, shows how advertised rental prices have changed across the market over time. The 25th percentile reflects lower-cost rentals, the median represents the typical rental, and the 75th percentile indicates higher-cost rentals. Together, these measures illustrate how asking rents have changed at multiple price points, not just on average, over the past decade.
Distribution of Real Asking Rents in Placer County
Source: Public Use Microdata Sample (PUMS). US Bureau of Economic Analysis. Analysis by Beacon Economics. Data are in $ 2023.
The distribution of real contract rents in the county, adjusted for inflation, shows how actual rents paid by tenants have changed across the market over the past decade. Unlike asking rents, contract rents reflect what households are currently paying, offering insight into renters’ real housing costs over time.
Distribution of Real Contract Rents in Placer County
Source: Public Use Microdata Sample (PUMS). US Bureau of Economic Analysis. Analysis by Beacon Economics. Data are in $ 2023.
The apartment vacancy rate measures the share of rental units that are unoccupied and available for rent at a given time.
Vacancy Rate for Apartments in Placer County
Source: Moody's Analytics. Analysis by Beacon Economics.
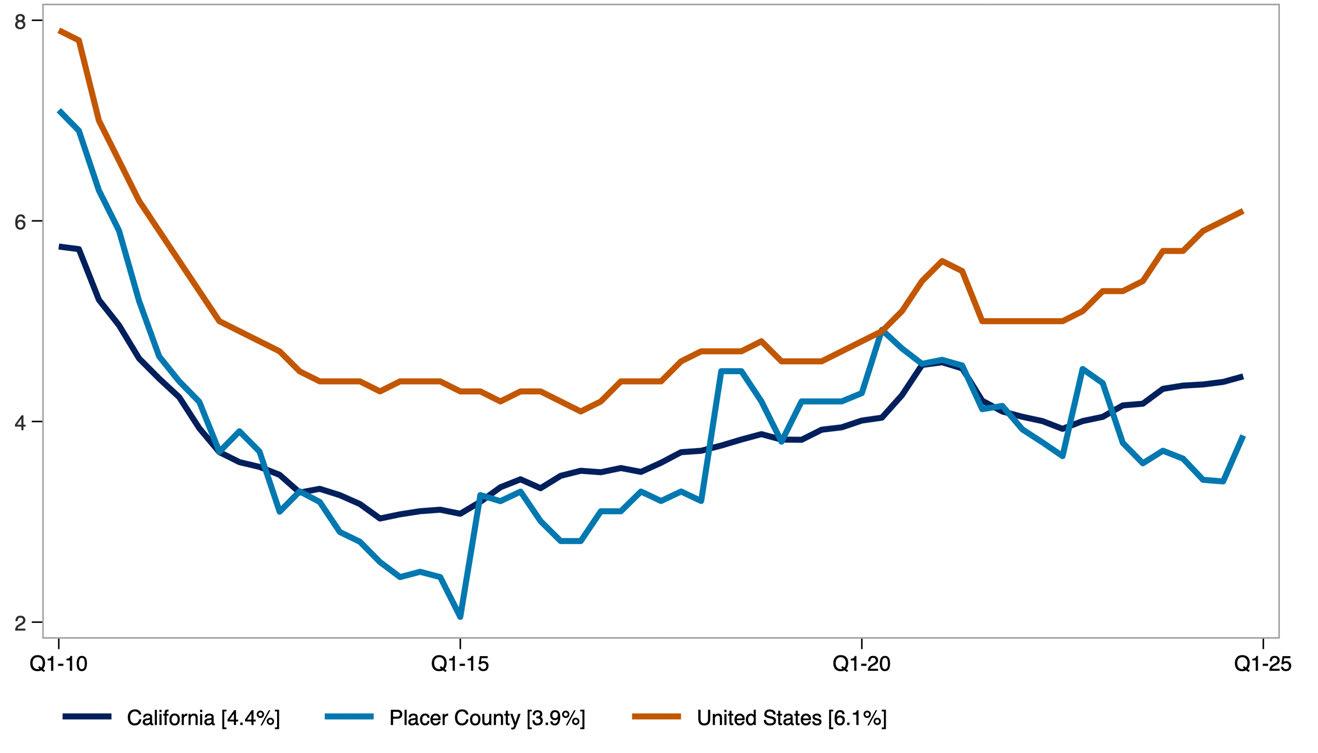
It serves as an indicator of the balance between rental housing supply and demand. Lower vacancy rates typically point to tighter market conditions, while higher rates suggest greater availability.
STATE OF RENTERS: COUNTY OF PLACER
Key demographic and socioeconomic characteristics of renter households include household size, poverty status, income distribution, language access, and household composition. Together, these indicators offer a snapshot of how renter households are structured and how those characteristics have shifted over time. The data combine absolute figures, such as the number of renter households, with percentages that reflect household traits, such as the share with children or seniors.
Demographic Characteristics of Placer County Renter Households. Placer
Source: American Community Survey Public Use Microdata Sample (PUMS). Analysis by Beacon Economics.
The share of single-person renter households who moved into their current home within the past two years reflects residential mobility among renters living alone.
This measure helps illustrate turnover in the rental market and may indicate trends in housing availability and economic stability for solo renters.
Share of Single-Person Renter Households That Have Moved in Previous 2 Years
Source: American Community Survey, Public Use Microdata Sample (PUMS). Analysis by Beacon Economics.
The share of multi-person renter households who moved within the past two years reflects residential mobility among shared or family households.
This measure offers insight into turnover rates and housing stability for renters living with others, whether as families or roommates.
Share of Multi-Person Renter Households That Have Moved in Previous 2 Years
Source: American Community Survey, Public Use Microdata Sample (PUMS). Analysis by Beacon Economics.
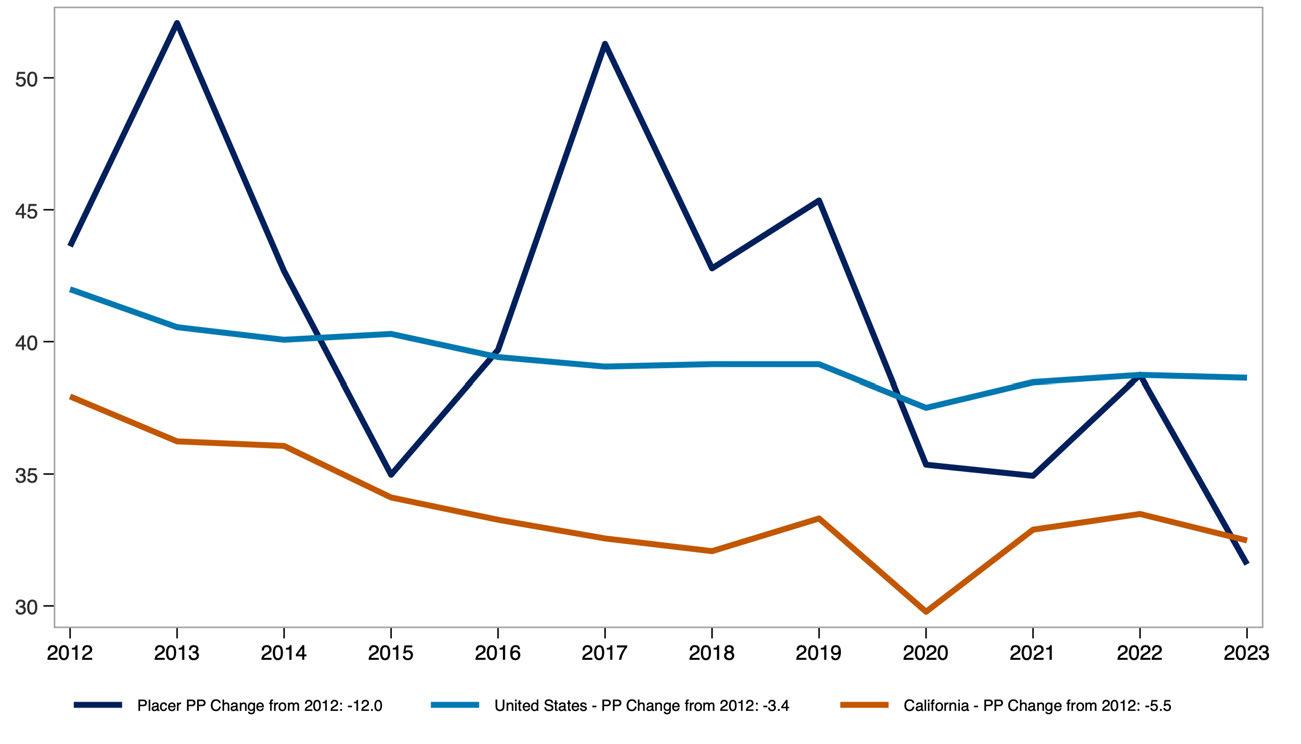
The share of renter households that are single person versus multi-person provides insight into how household size and composition have shifted over time.
Demographic Characteristics of Placer County Renter Households.
Source: American Community Survey Public Use Microdata Sample (PUMS). Analysis by Beacon Economics.
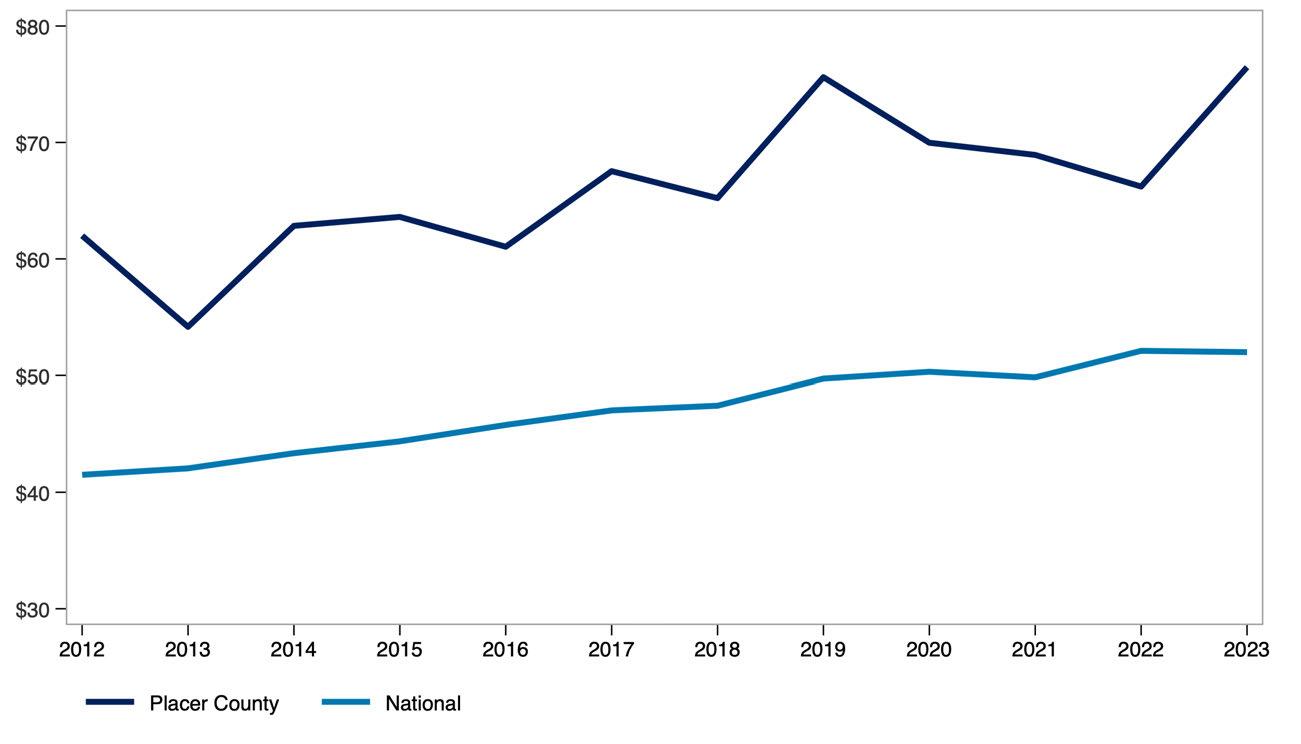
Real median pre-tax income of renter households, measured in 2023 dollars, reflects how renter incomes have changed in purchasing power over time.
Comparing the county to the U.S. highlights how local renter income levels have evolved relative to the national average.
Real Median Renter Pre-Tax Income ($ 2023, 000s)
Source: Public Use Microdata Sample (PUMS). Analysis by Beacon Economics.
The share of income spent on rent, broken out by renter household type and income level, shows how rent burden varies across the population. This measure compares single-person and multi-person households at the 25th percentile, median, and 75th percentile of the burden distribution, offering insight into how both household size affects housing affordability.
Monthly renter household income before and after rent adjusted for inflation, highlights how much income renters have overall and how much remains after covering housing costs. Presented at the 25th percentile, median, and 75th percentile, this measure provides a view of post-rent income across different points in the income distribution.
Real Monthly Pre/Post-Rent Income for Renter Households in Placer County
Source: Public Use Microdata Sample (PUMS). US Bureau of Economic Analysis. Analysis by Beacon Economics. Data are in $ 2023.
STATE OF THE STOCK: COUNTY OF PLACER
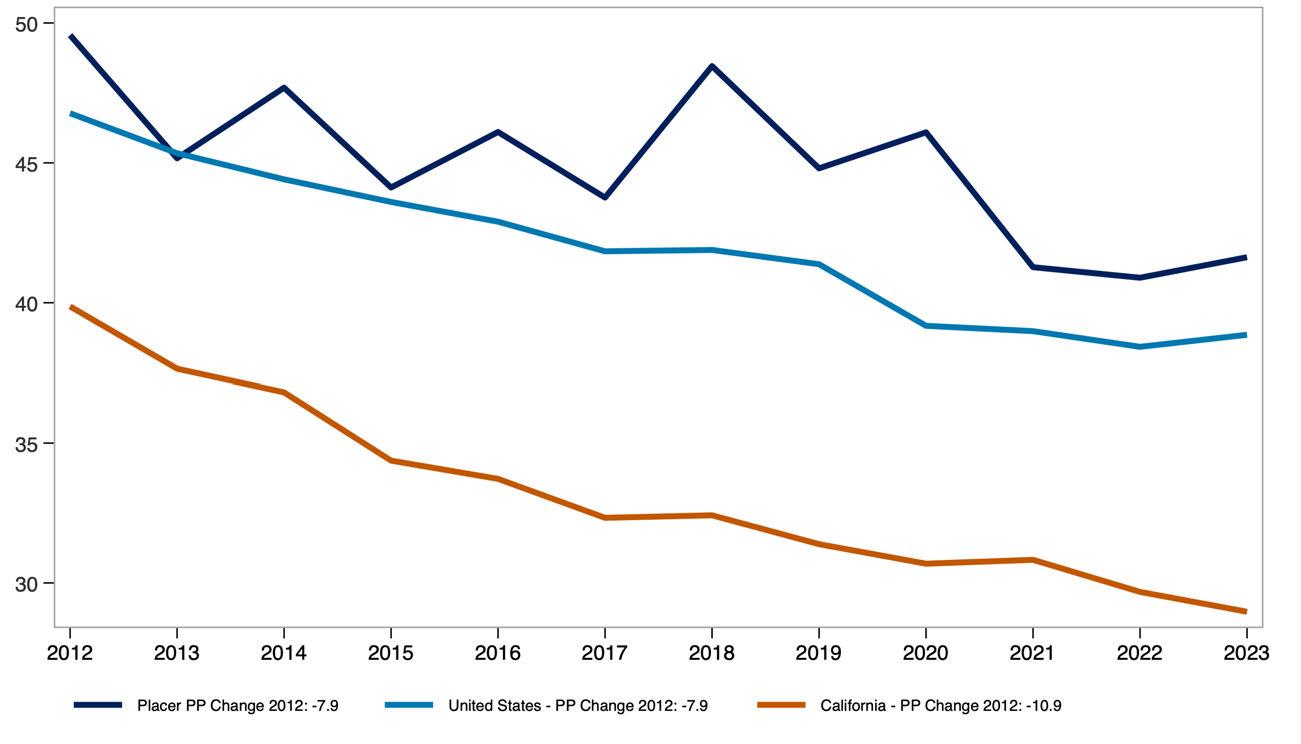
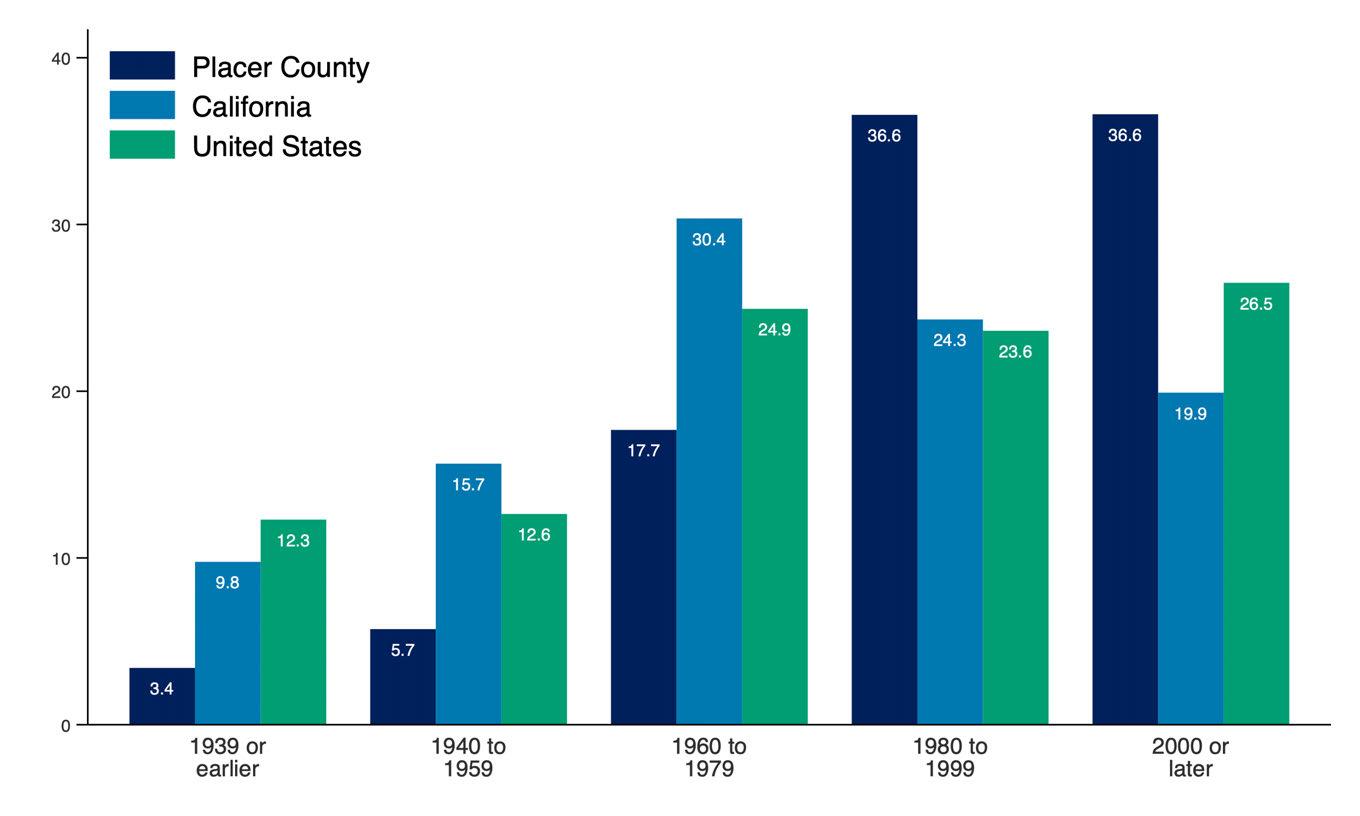
The share of renter-occupied housing units by the year the building was built offers insight into the age of the rental housing stock across the county, California, and the United States. This measure helps illustrate how recently or how long ago rental units were added to each region’s housing supply.
Renter Occupied Housing by Year Built, Placer County
Source: 2023 American Community Survey. Analysis by Beacon Economics.
Producer Price Index (PPI) trends for goods and services used in multifamily residential construction reflect how input costs have changed over time. These trends influence the cost and feasibility of developing new rental housing. A broader commodity index is also included to show how construction-specific price movements compare to price trends across all industries.
Producer Price Index by Commodity, United States
Source: U.S. Bureau of Labor Statistics. Analysis by Beacon Economics.
Net Inputs to Multifamily
Residential Construction: Goods, Less Food and Energy
Net Inputs to Multifamily
Residential Construction: Services
All Commodities
Net Inputs to Multifamily
Residential Construction, Excluding Capital Investment, Labor, and Imports
The State of Renters in Riverside County
Renter incomes in Riverside County have grown significantly. Even after adjusting for inflation and subtracting rent, household income has increased by 30.7% over the past decade compared to 21.4% for renters nationwide.
Household composition is shifting as well. The share of single-person renter households in Riverside County has increased by 0.7 percentage points over the past decade, reflecting a broader trend toward smaller household sizes.
Rent burden has remained stable overall. For all renters, the median share of income spent on rent has held steady over the past decade. Among multi-person renter households, rent burden has declined from 29.3% in 2013 to 27.8% in 2023 pointing to modest improvements in affordability for shared households.
STATE OF THE MARKET: COUNTY OF RIVERSIDE
Asking rent represents the price landlords list for vacant units, rather than what current tenants are paying. When adjusted for inflation, it provides insight into how advertised rents have changed in real terms.
The year-over-year rent growth rate captures the pace at which rents are rising or falling. Together, these measures reflect both the level and volatility of rental prices over time.
Real Asking Rents for Apartments in Riverside County ($ Q4-2024)
Source: US Bureau of Labor Statistics. Moody's Analytics. Analysis by Beacon Economics.
The distribution of real asking rents in the county, adjusted for inflation, shows how advertised rental prices have changed across the market over time. The 25th percentile reflects lower-cost rentals, the median represents the typical rental, and the 75th percentile indicates higher-cost rentals. Together, these measures illustrate how asking rents have changed at multiple price points, not just on average, over the past decade.
Distribution of Real Asking Rents
Source: Public Use Microdata Sample (PUMS). US Bureau of Economic Analysis. Analysis by Beacon Economics. Data are in $ 2023.
The distribution of real contract rents in the county, adjusted for inflation, shows how actual rents paid by tenants have changed across the market over the past decade. Unlike asking rents, contract rents reflect what households are currently paying, offering insight into renters’ real housing costs over time.
Distribution of Real Contract Rents in
Source: Public Use Microdata Sample (PUMS). US Bureau of Economic Analysis. Analysis by Beacon Economics. Data are in $ 2023.
The apartment vacancy rate measures the share of rental units that are unoccupied and available for rent at a given time.
Vacancy Rate for Apartments in Riverside County
Source: Moody's Analytics. Analysis by Beacon Economics.

It serves as an indicator of the balance between rental housing supply and demand. Lower vacancy rates typically point to tighter market conditions, while higher rates suggest greater availability.
STATE OF RENTERS: COUNTY OF RIVERSIDE
Key demographic and socioeconomic characteristics of renter households include household size, poverty status, income distribution, language access, and household composition. Together, these indicators offer a snapshot of how renter households are structured and how those characteristics have shifted over time. The data combine absolute figures, such as the number of renter households, with percentages that reflect household traits, such as the share with children or seniors.
Demographic Characteristics of Riverside County Renter Households.
Source: American Community Survey Public Use Microdata Sample (PUMS) Analysis by Beacon Economics.
The share of single-person renter households who moved into their current home within the past two years reflects residential mobility among renters living alone.
This measure helps illustrate turnover in the rental market and may indicate trends in housing availability and economic stability for solo renters.
Share of Single-Person Renter Households That Have Moved in Previous 2 Years
Source: American Community Survey, Public Use Microdata Sample (PUMS). Analysis by Beacon Economics.
The share of multi-person renter households who moved within the past two years reflects residential mobility among shared or family households.
This measure offers insight into turnover rates and housing stability for renters living with others, whether as families or roommates.
Share of Multi-Person Renter Households That Have Moved in Previous 2 Years
Source: American Community Survey, Public Use Microdata Sample (PUMS). Analysis by Beacon Economics.

The share of renter households that are single person versus multi-person provides insight into how household size and composition have shifted over time.
Source: American Community Survey Public Use Microdata Sample (PUMS) Analysis by Beacon Economics.
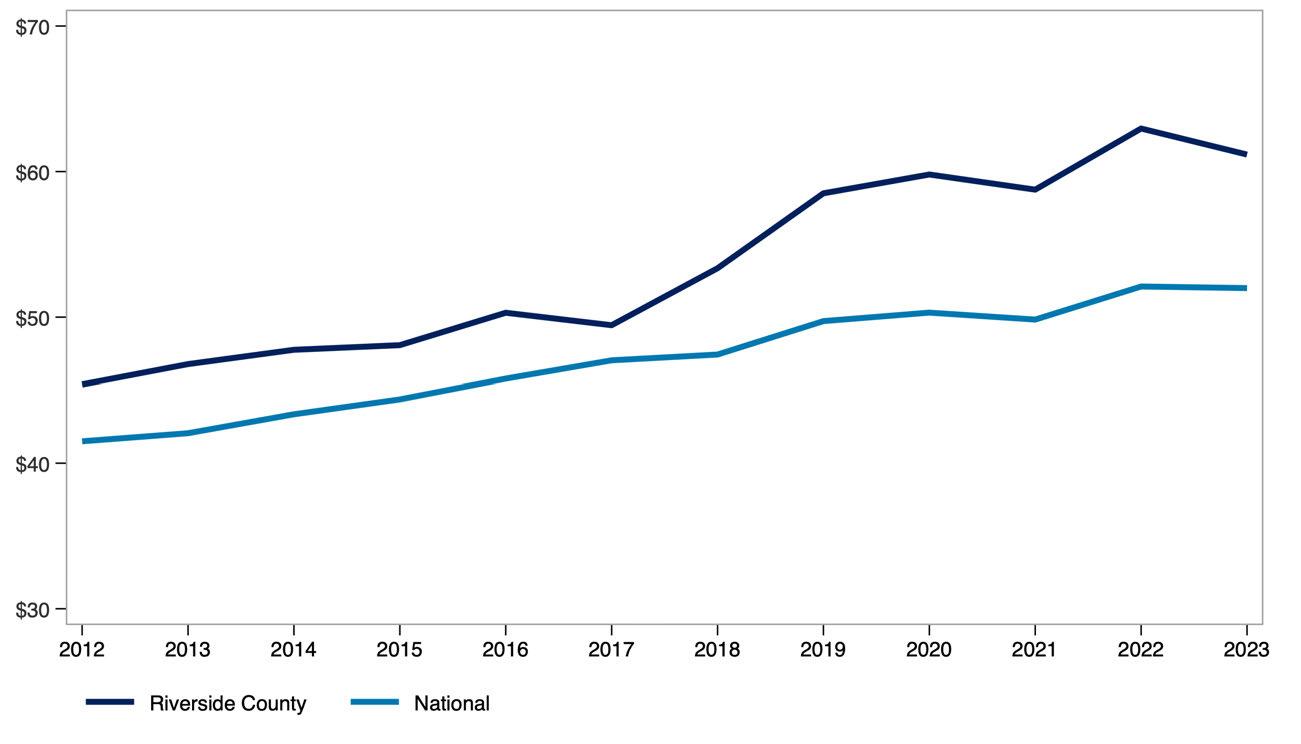
Real median pre-tax income of renter households, measured in 2023 dollars, reflects how renter incomes have changed in purchasing power over time.
Comparing the county to the U.S. highlights how local renter income levels have evolved relative to the national average.
Real Median Renter Pre-Tax Income ($ 2023, 000s)
Source: Public Use Microdata Sample (PUMS) Analysis by Beacon Economics.
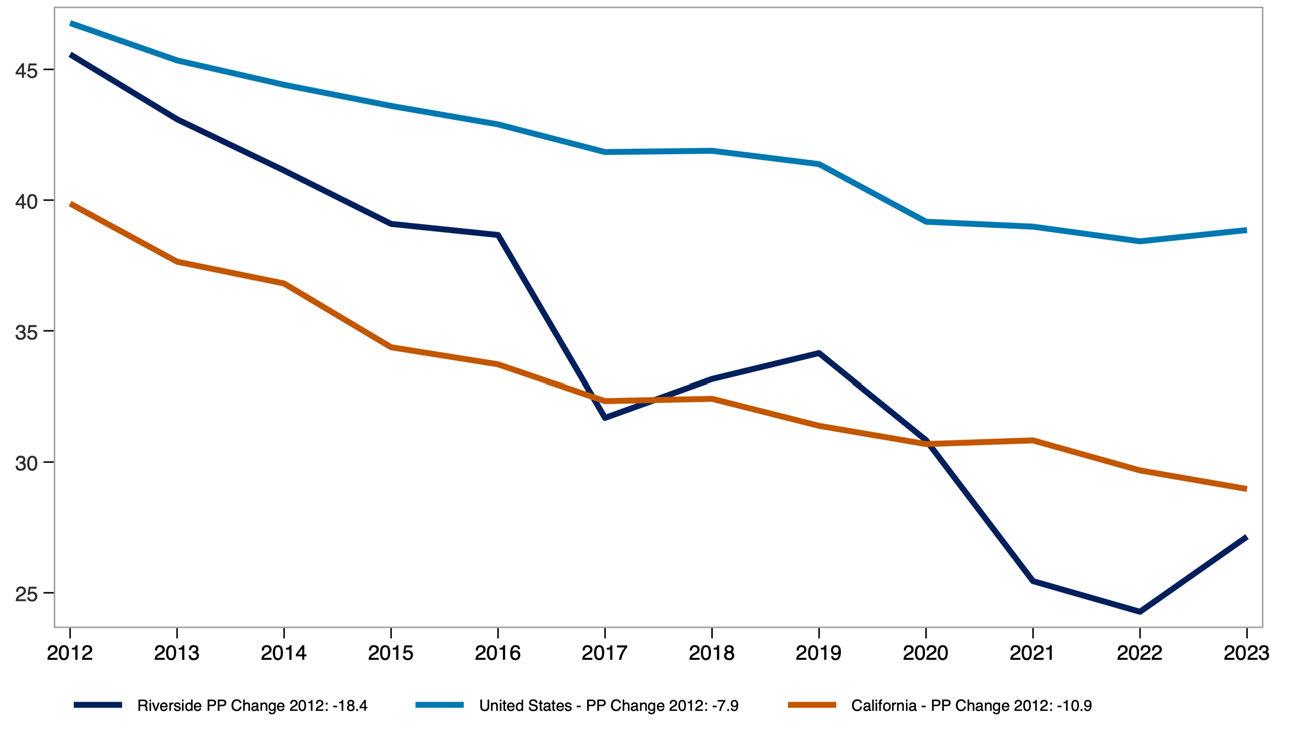
The share of income spent on rent, broken out by renter household type and income level, shows how rent burden varies across the population. This measure compares single-person and multi-person households at the 25th percentile, median, and 75th percentile of the burden distribution, offering insight into how both household size affects housing affordability.
Monthly renter household income before and after rent adjusted for inflation, highlights how much income renters have overall and how much remains after covering housing costs. Presented at the 25th percentile, median, and 75th percentile, this measure provides a view of post-rent income across different points in the income distribution.
Real Monthly Pre/Post-Rent Income for Renter Households in Riverside County
Source: Public Use Microdata Sample (PUMS). US Bureau of Economic Analysis. Analysis by Beacon Economics. Data are in $ 2023.
STATE OF THE STOCK: COUNTY OF RIVERSIDE
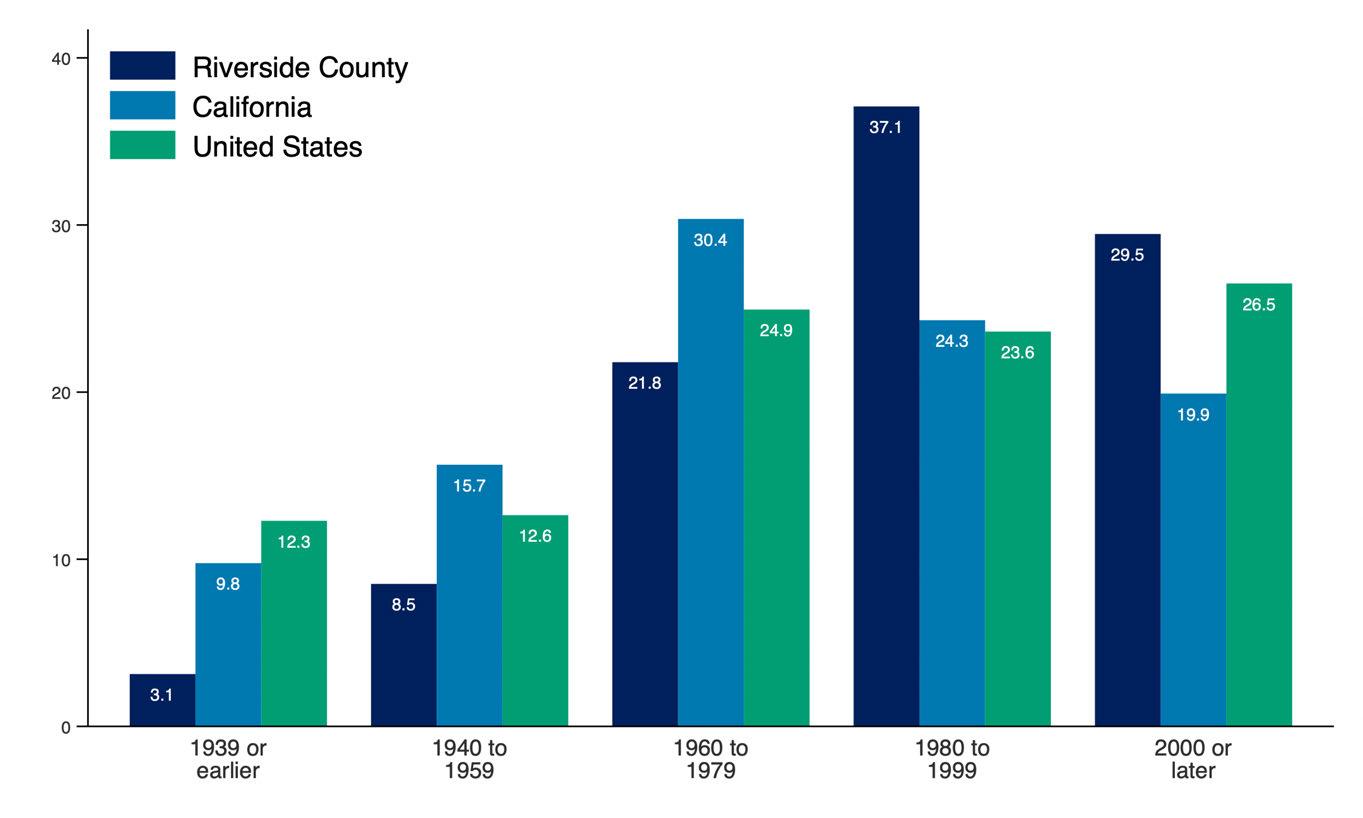
The share of renter-occupied housing units by the year the building was built offers insight into the age of the rental housing stock across the county, California, and the United States. This measure helps illustrate how recently or how long ago rental units were added to each region’s housing supply.
Renter Occupied Housing by Year Built, Riverside County
Source: 2023 American Community Survey. Analysis by Beacon Economics.
Producer Price Index (PPI) trends for goods and services used in multifamily residential construction reflect how input costs have changed over time. These trends influence the cost and feasibility of developing new rental housing. A broader commodity index is also included to show how construction-specific price movements compare to price trends across all industries.
Producer Price Index by Commodity, United States
Source: U.S. Bureau of Labor Statistics. Analysis by Beacon Economics.
Net Inputs to Multifamily
Residential Construction: Goods, Less Food and Energy
Net Inputs to Multifamily
Residential Construction: Services
All Commodities
Net Inputs to Multifamily
Residential Construction, Excluding Capital Investment, Labor, and Imports
The State of Renters in Sacramento County
Renter incomes in Sacramento County have grown significantly. Even after adjusting for inflation and subtracting rent, household income has increased by 34.7% over the past decade compared to 21.4% for renters nationwide.
Household composition is shifting as well. The share of single-person renter households in Sacramento County has increased by 3.4 percentage points over the past decade, reflecting a broader trend toward smaller household sizes.
Rent burden has remained stable overall. For all renters, the median share of income spent on rent has held steady over the past decade. Among multi-person renter households, rent burden has declined from 27.5% in 2013 to 25.9% in 2023 pointing to modest improvements in affordability for shared households.
STATE OF THE MARKET: COUNTY OF SACRAMENTO
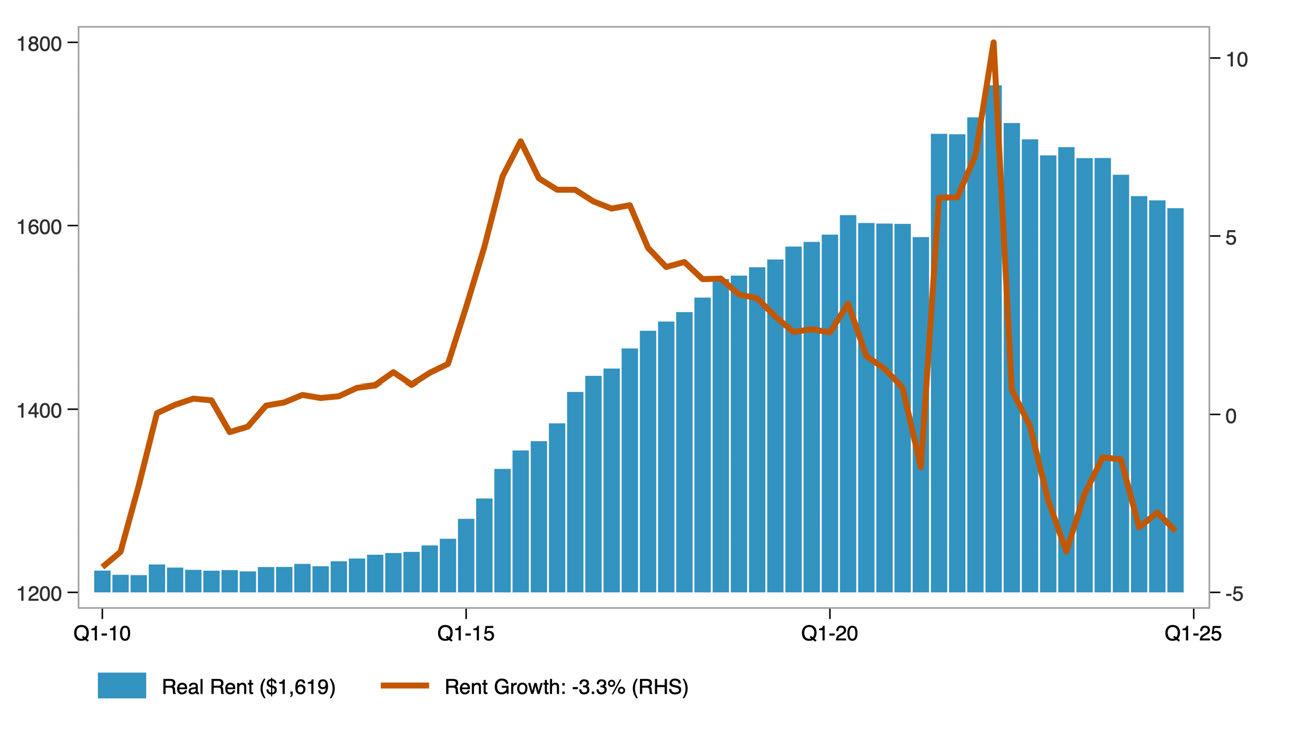
Asking rent represents the price landlords list for vacant units, rather than what current tenants are paying. When adjusted for inflation, it provides insight into how advertised rents have changed in real terms.
The year-over-year rent growth rate captures the pace at which rents are rising or falling. Together, these measures reflect both the level and volatility of rental prices over time.
Real Asking Rents for Apartments in Sacramento County ($ Q4-2024)
Source: US Bureau of Labor Statistics. Moody's Analytics. Analysis by Beacon Economics.
The distribution of real asking rents in the county, adjusted for inflation, shows how advertised rental prices have changed across the market over time. The 25th percentile reflects lower-cost rentals, the median represents the typical rental, and the 75th percentile indicates higher-cost rentals. Together, these measures illustrate how asking rents have changed at multiple price points, not just on average, over the past decade.
Distribution of Real Asking Rents in
Source: Public Use Microdata Sample (PUMS). US Bureau of Economic Analysis. Analysis by Beacon Economics. Data are in $ 2023.
The distribution of real contract rents in the county, adjusted for inflation, shows how actual rents paid by tenants have changed across the market over the past decade. Unlike asking rents, contract rents reflect what households are currently paying, offering insight into renters’ real housing costs over time.
Distribution of Real Contract Rents in Sacramento County
Source: Public Use Microdata Sample (PUMS). US Bureau of Economic Analysis. Analysis by Beacon Economics. Data are in $ 2023.
The apartment vacancy rate measures the share of rental units that are unoccupied and available for rent at a given time.
Vacancy Rate for Apartments in Sacramento County
Source: Moody's Analytics. Analysis by Beacon Economics.
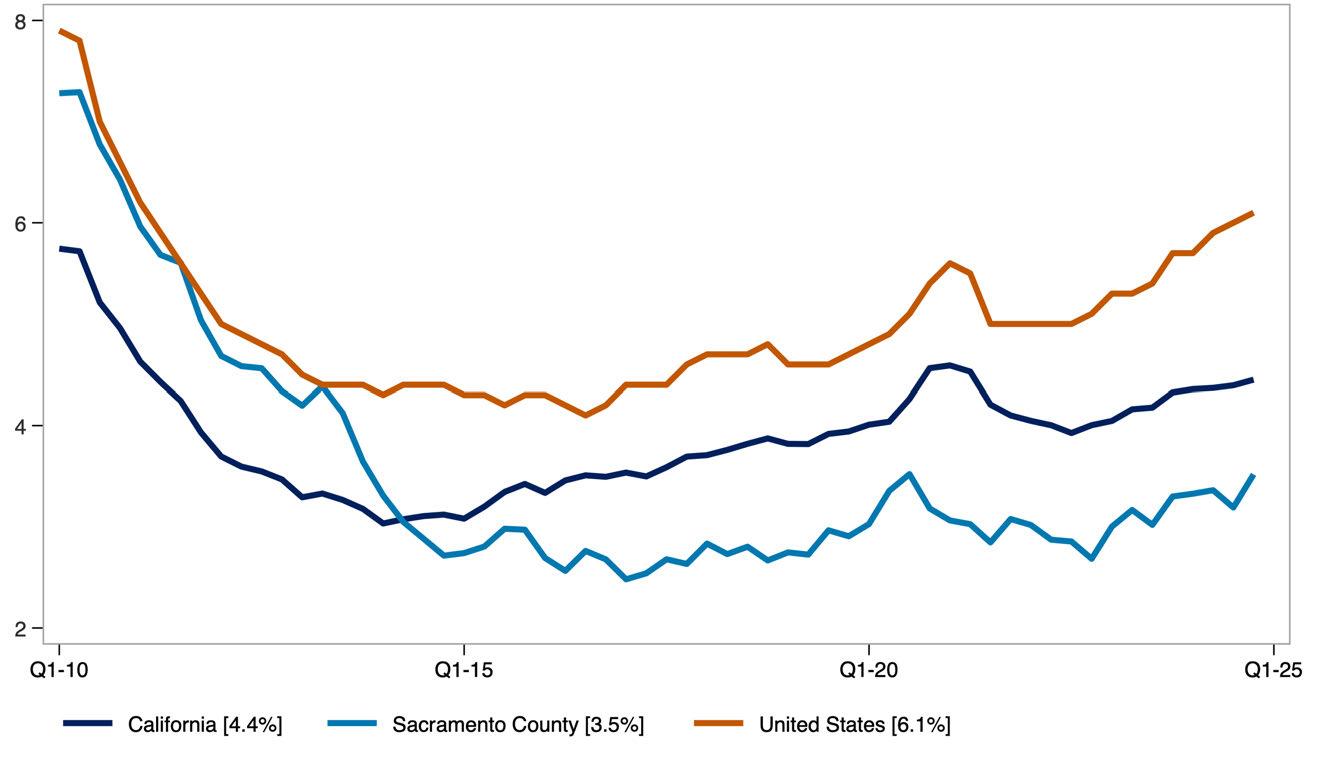
It serves as an indicator of the balance between rental housing supply and demand. Lower vacancy rates typically point to tighter market conditions, while higher rates suggest greater availability.
STATE OF RENTERS: COUNTY OF SACRAMENTO
Key demographic and socioeconomic characteristics of renter households include household size, poverty status, income distribution, language access, and household composition. Together, these indicators offer a snapshot of how renter households are structured and how those characteristics have shifted over time. The data combine absolute figures, such as the number of renter households, with percentages that reflect household traits, such as the share with children or seniors.
Demographic Characteristics of Sacramento County Renter Households.
Source: American Community Survey Public Use Microdata Sample (PUMS) Analysis by Beacon Economics.
The share of single-person renter households who moved into their current home within the past two years reflects residential mobility among renters living alone.
This measure helps illustrate turnover in the rental market and may indicate trends in housing availability and economic stability for solo renters.
Share of Single-Person Renter Households That Have Moved in Previous 2 Years
Source: American Community Survey, Public Use Microdata Sample (PUMS). Analysis by Beacon Economics.
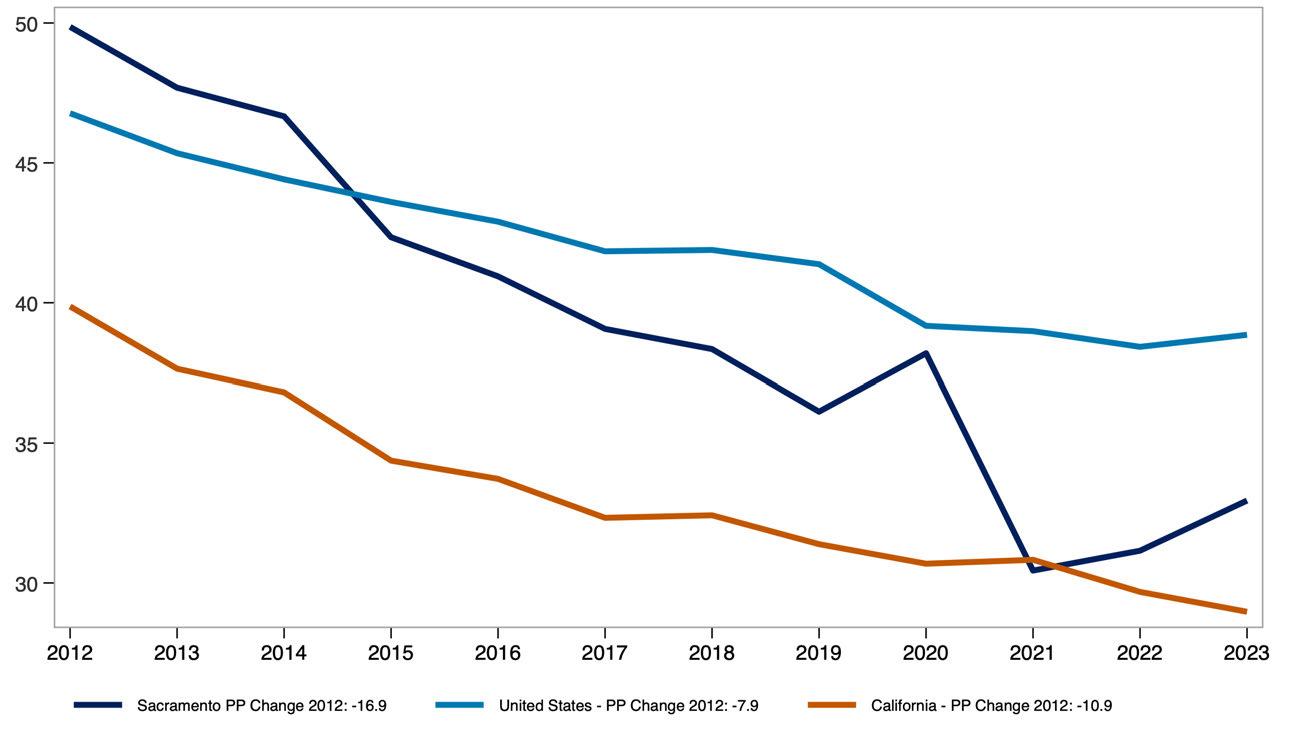
The share of multi-person renter households who moved within the past two years reflects residential mobility among shared or family households.
This measure offers insight into turnover rates and housing stability for renters living with others, whether as families or roommates.
Share of Multi-Person Renter Households That Have Moved in Previous 2 Years
Source: American Community Survey, Public Use Microdata Sample (PUMS). Analysis by Beacon Economics.
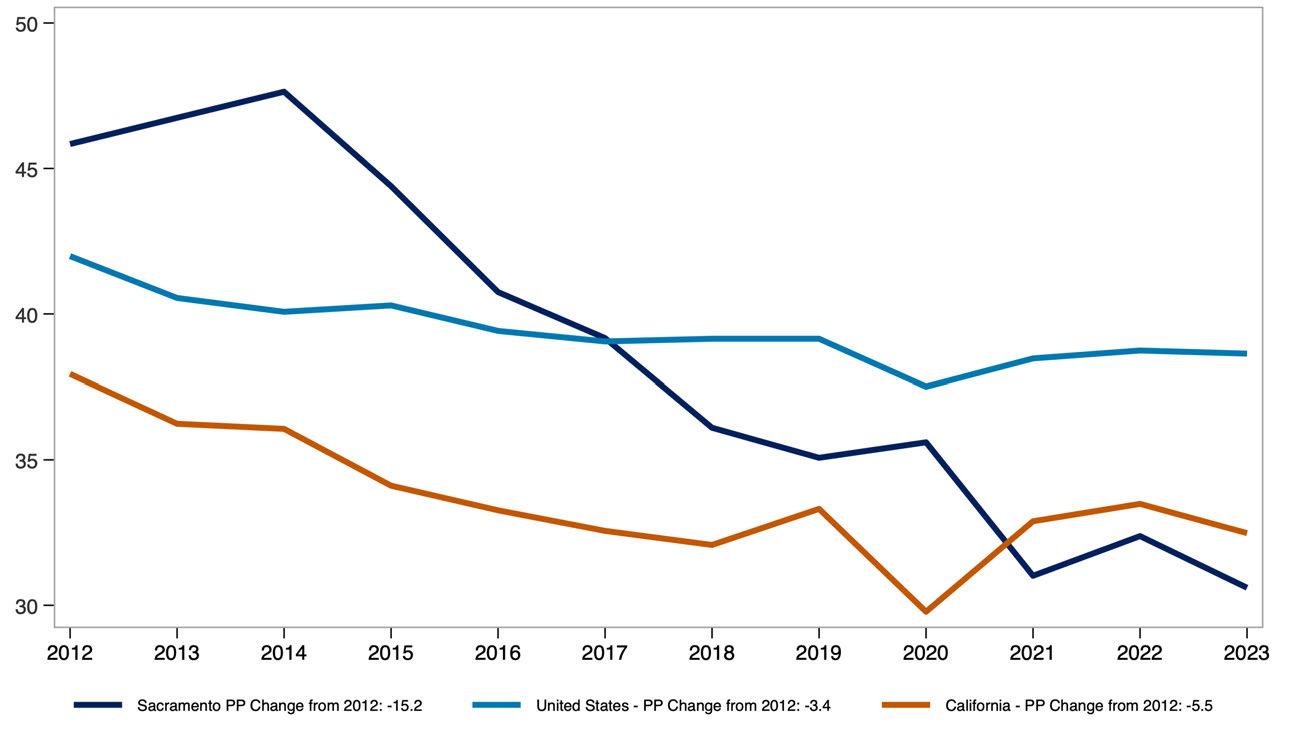
The share of renter households that are single person versus multi-person provides insight into how household size and composition have shifted over time.
Source: American Community Survey Public Use Microdata Sample (PUMS) Analysis by Beacon Economics.
Real median pre-tax income of renter households, measured in 2023 dollars, reflects how renter incomes have changed in purchasing power over time.
Comparing the county to the U.S. highlights how local renter income levels have evolved relative to the national average.
Real Median Renter Pre-Tax Income ($ 2023, 000s)
Source: Public Use Microdata Sample (PUMS) Analysis by Beacon Economics.
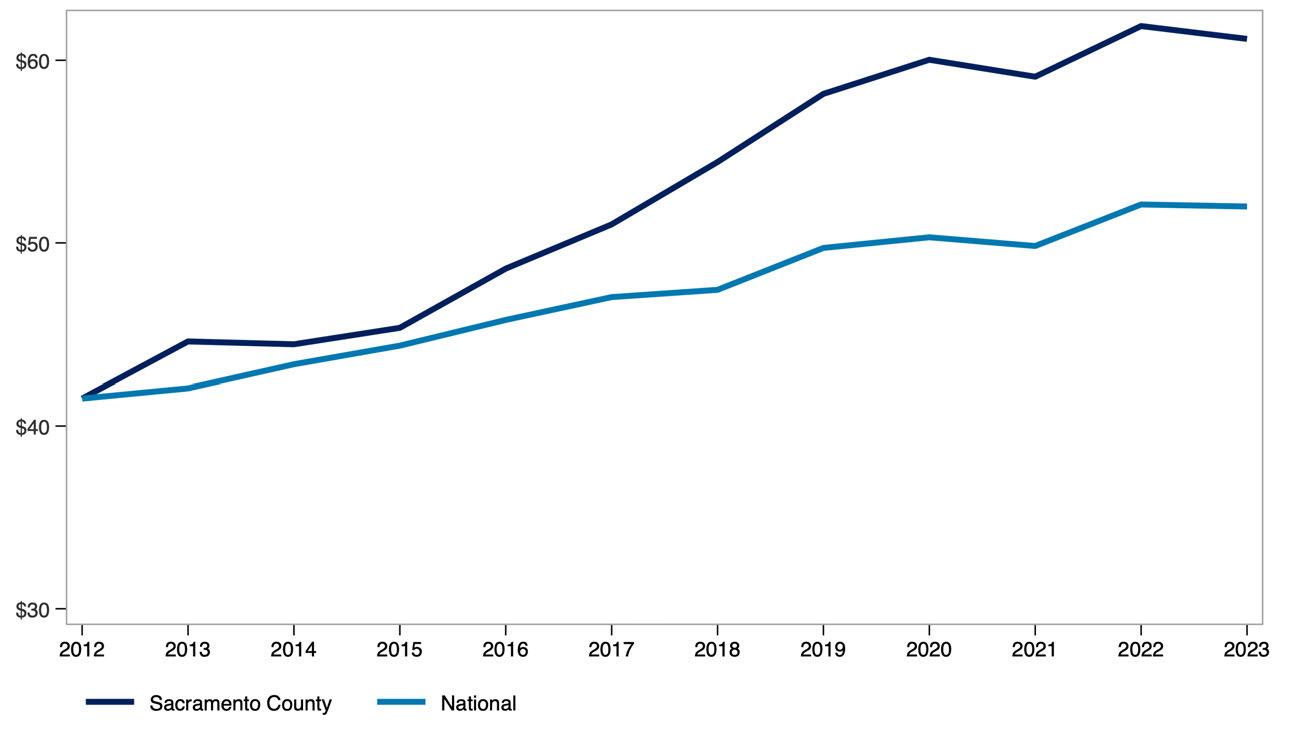
The share of income spent on rent, broken out by renter household type and income level, shows how rent burden varies across the population. This measure compares single-person and multi-person households at the 25th percentile, median, and 75th percentile of the burden distribution, offering insight into how both household size affects housing affordability.
Monthly renter household income before and after rent adjusted for inflation, highlights how much income renters have overall and how much remains after covering housing costs. Presented at the 25th percentile, median, and 75th percentile, this measure provides a view of post-rent income across different points in the income distribution.
Real Monthly Pre/Post-Rent Income for Renter Households in Sacramento County
Source: Public Use Microdata Sample (PUMS). US Bureau of Economic Analysis. Analysis by Beacon Economics. Data are in $ 2023.
STATE OF THE STOCK: COUNTY OF SACRAMENTO
The share of renter-occupied housing units by the year the building was built offers insight into the age of the rental housing stock across the county, California, and the United States. This measure helps illustrate how recently or how long ago rental units were added to each region’s housing supply.
Renter Occupied Housing by Year Built, Sacramento County
Source: 2023 American Community Survey. Analysis by Beacon Economics.
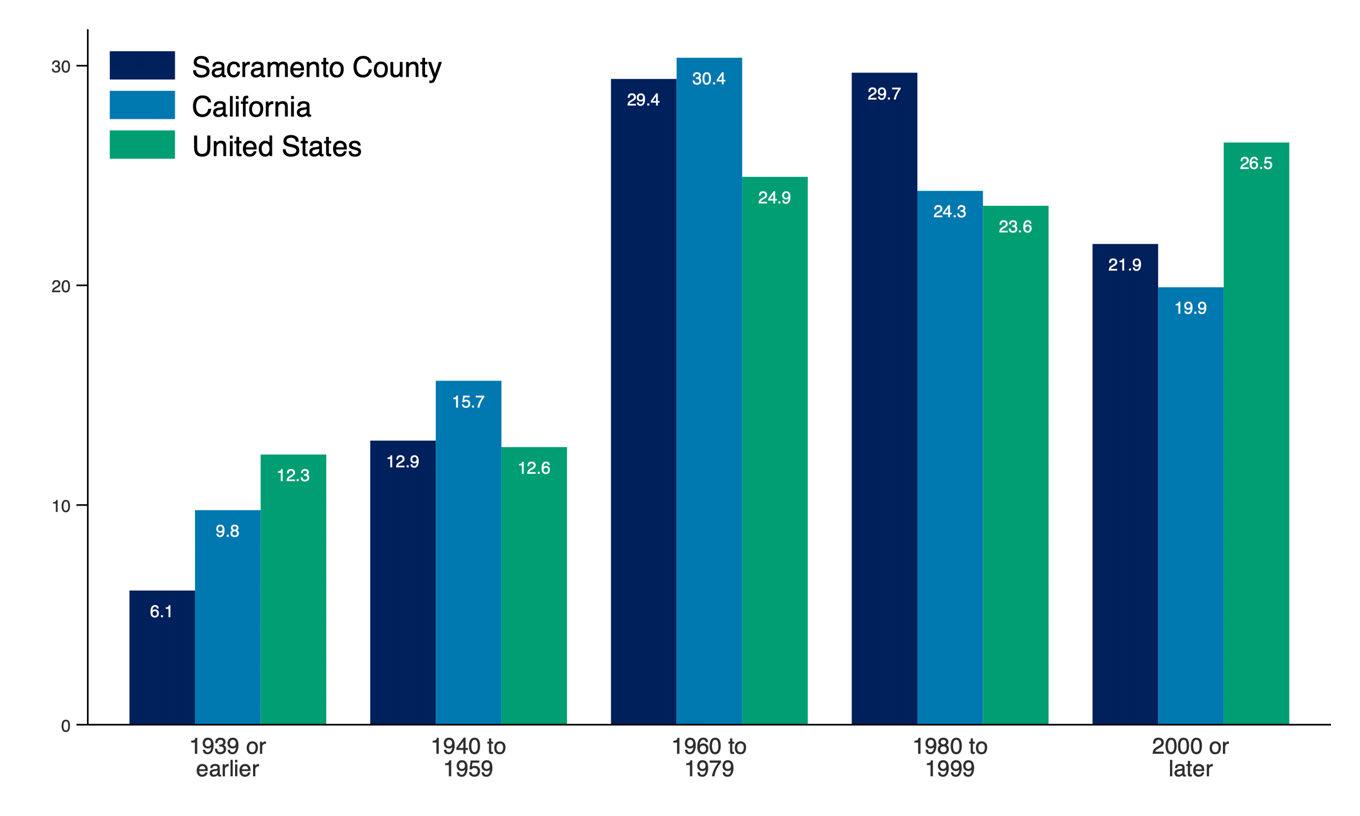
Producer Price Index (PPI) trends for goods and services used in multifamily residential construction reflect how input costs have changed over time. These trends influence the cost and feasibility of developing new rental housing. A broader commodity index is also included to show how construction-specific price movements compare to price trends across all industries.
Producer Price Index by Commodity, United States
Source: U.S. Bureau of Labor Statistics. Analysis by Beacon Economics.
Net Inputs to Multifamily
Residential Construction: Goods, Less Food and Energy
Net Inputs to Multifamily
Residential Construction: Services
All Commodities
Net Inputs to Multifamily
Residential Construction, Excluding Capital Investment, Labor, and Imports
The State of Renters in San Bernardino County
Renter incomes in San Bernardino County have grown significantly. Even after adjusting for inflation and subtracting rent, household income has increased by 28.3% over the past decade compared to 21.4% for renters nationwide.
Household composition is shifting as well. The share of single-person renter households in San Bernardino County has decreased by 3.6 percentage points over the past decade, reflecting a broader trend toward larger household sizes.
Rent burden has remained stable overall. For all renters, the median share of income spent on rent has held steady over the past decade. Among multi-person renter households, rent burden has remained the same 28.5% in 2013 to 28.5% in 2023.
STATE OF THE MARKET: COUNTY OF SAN BERNARDINO
Asking rent represents the price landlords list for vacant units, rather than what current tenants are paying. When adjusted for inflation, it provides insight into how advertised rents have changed in real terms.
The year-over-year rent growth rate captures the pace at which rents are rising or falling. Together, these measures reflect both the level and volatility of rental prices over time.
Real Asking Rents for Apartments in San Bernardino County ($ Q4-2024)
Source: US Bureau of Labor Statistics. Moody's Analytics. Analysis by Beacon Economics.
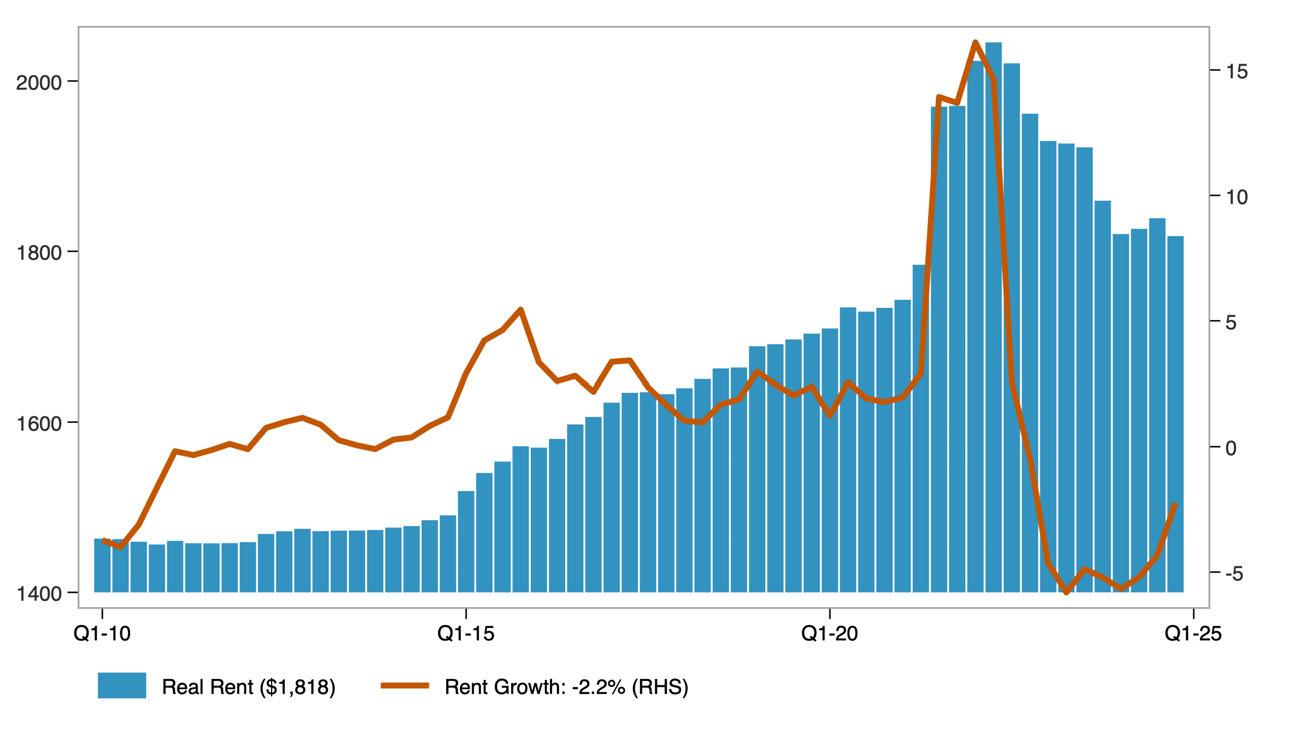
The distribution of real asking rents in the county, adjusted for inflation, shows how advertised rental prices have changed across the market over time. The 25th percentile reflects lower-cost rentals, the median represents the typical rental, and the 75th percentile indicates higher-cost rentals. Together, these measures illustrate how asking rents have changed at multiple price points, not just on average, over the past decade. Distribution of
Source: Public Use Microdata Sample (PUMS). US Bureau of Economic Analysis. Analysis by Beacon Economics. Data are in $ 2023.
The distribution of real contract rents in the county, adjusted for inflation, shows how actual rents paid by tenants have changed across the market over the past decade. Unlike asking rents, contract rents reflect what households are currently paying, offering insight into renters’ real housing costs over time.
Source: Public Use Microdata Sample (PUMS). US Bureau of Economic Analysis. Analysis by Beacon Economics. Data are in $ 2023.
The apartment vacancy rate measures the share of rental units that are unoccupied and available for rent at a given time.
Vacancy Rate for Apartments in San Bernardino County
Source: Moody's Analytics. Analysis by Beacon Economics.
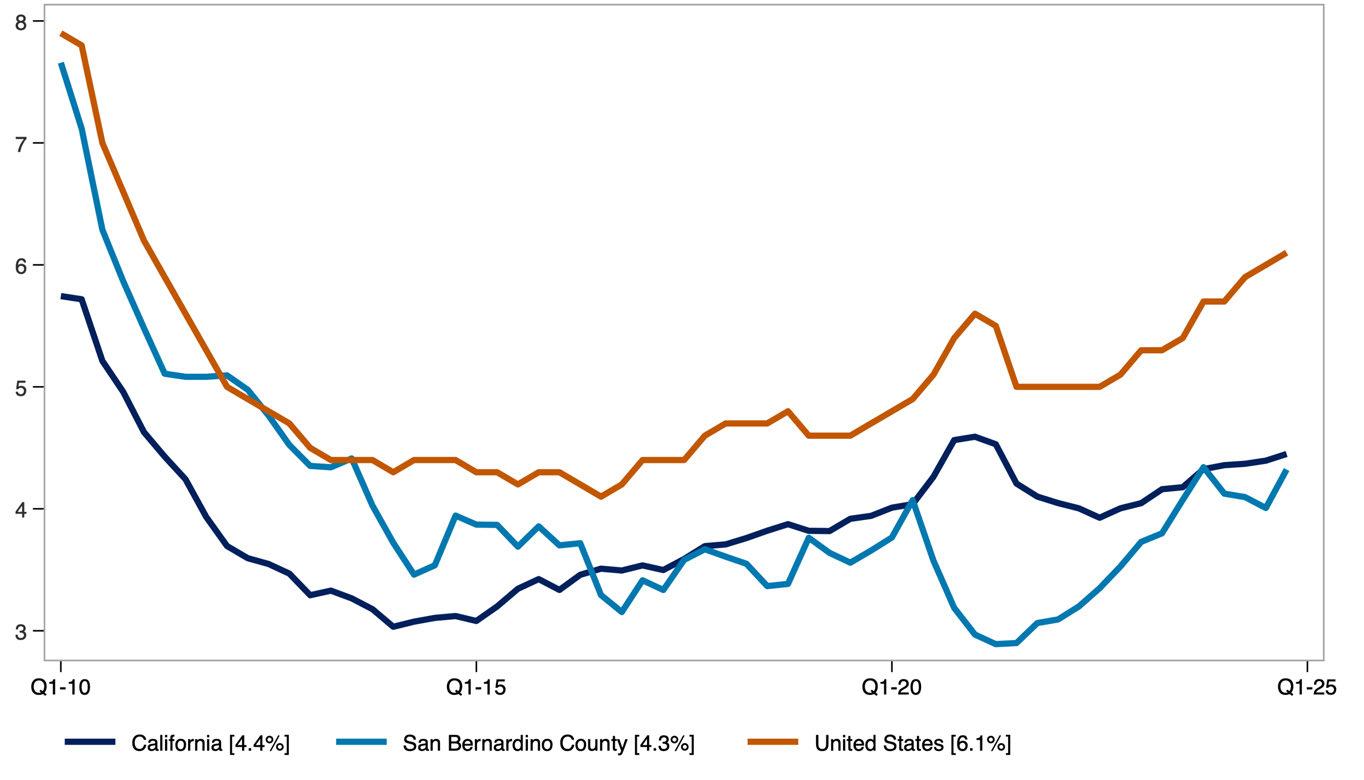
It serves as an indicator of the balance between rental housing supply and demand. Lower vacancy rates typically point to tighter market conditions, while higher rates suggest greater availability.
STATE OF RENTERS: COUNTY OF SAN BERNARDINO
Key demographic and socioeconomic characteristics of renter households include household size, poverty status, income distribution, language access, and household composition. Together, these indicators offer a snapshot of how renter households are structured and how those characteristics have shifted over time. The data combine absolute figures, such as the number of renter households, with percentages that reflect household traits, such as the share with children or seniors.
Demographic Characteristics of San Bernardino County Renter Households.
Source: American Community Survey Public Use Microdata Sample (PUMS). Analysis by Beacon Economics.
The share of single-person renter households who moved into their current home within the past two years reflects residential mobility among renters living alone.
This measure helps illustrate turnover in the rental market and may indicate trends in housing availability and economic stability for solo renters.
Share of Single-Person Renter Households That Have Moved in Previous 2 Years
Source: American Community Survey, Public Use Microdata Sample (PUMS). Analysis by Beacon Economics.
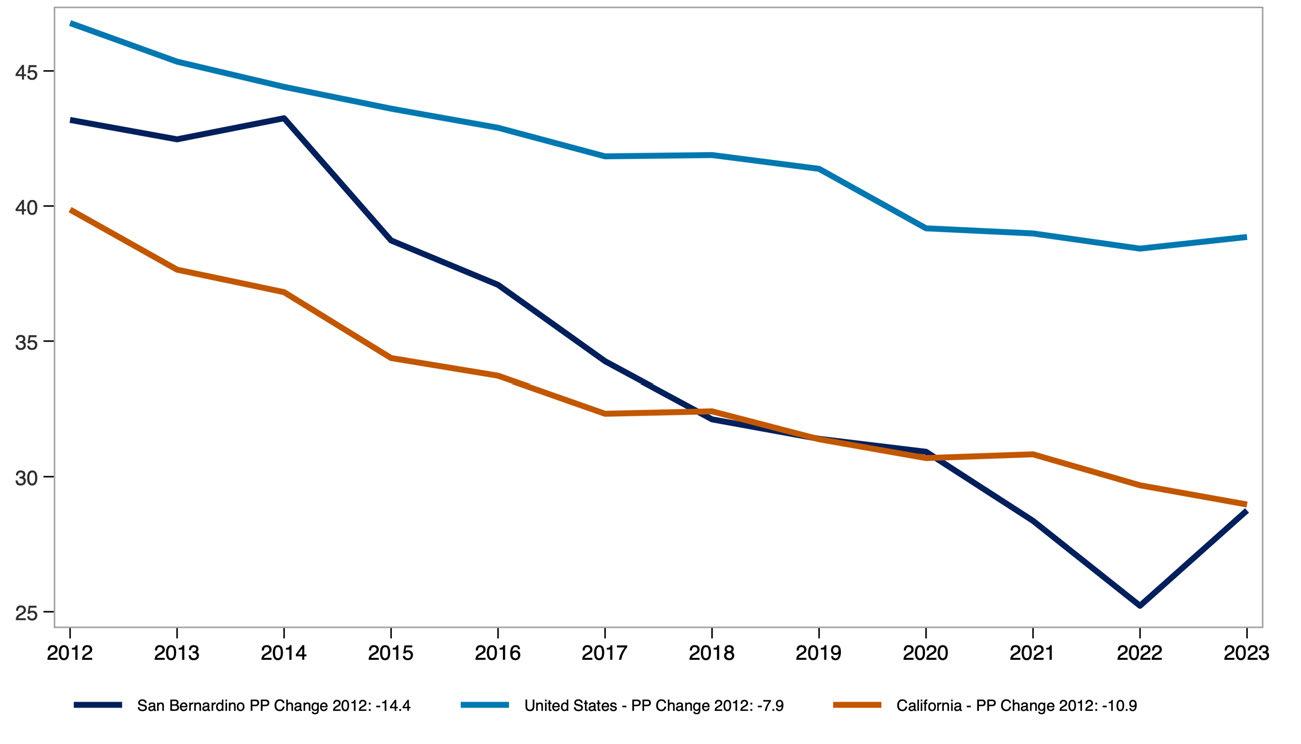
The share of multi-person renter households who moved within the past two years reflects residential mobility among shared or family households.
This measure offers insight into turnover rates and housing stability for renters living with others, whether as families or roommates.
Share of Multi-Person Renter Households That Have Moved in Previous 2 Years
Source: American Community Survey, Public Use Microdata Sample (PUMS). Analysis by Beacon Economics.
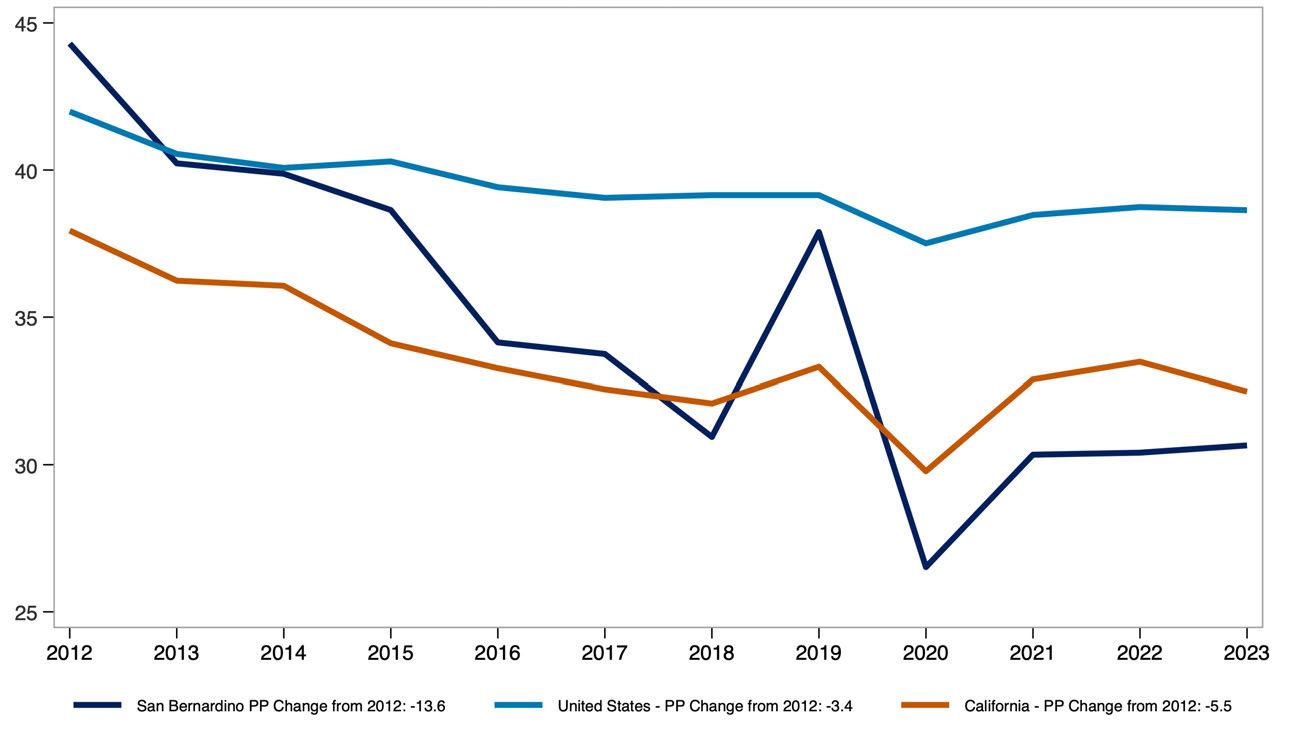
The share of renter households that are single person versus multi-person provides insight into how household size and composition have shifted over time. Demographic Characteristics
Source: American Community Survey Public Use Microdata Sample (PUMS). Analysis by Beacon Economics.
Real median pre-tax income of renter households, measured in 2023 dollars, reflects how renter incomes have changed in purchasing power over time.
Comparing the county to the U.S. highlights how local renter income levels have evolved relative to the national average.
Real Median Renter Pre-Tax Income ($ 2023, 000s)
Source: Public Use Microdata Sample (PUMS). Analysis by Beacon Economics.

The share of income spent on rent, broken out by renter household type and income level, shows how rent burden varies across the population. This measure compares single-person and multi-person households at the 25th percentile, median, and 75th percentile of the burden distribution, offering insight into how both household size affects housing affordability.
Monthly renter household income before and after rent adjusted for inflation, highlights how much income renters have overall and how much remains after covering housing costs. Presented at the 25th percentile, median, and 75th percentile, this measure provides a view of post-rent income across different points in the income distribution.
Real Monthly Pre/Post-Rent Income for Renter Households in San Bernardino County
Source: Public Use Microdata Sample (PUMS). US Bureau of Economic Analysis. Analysis by Beacon Economics. Data are in $ 2023.
STATE OF THE STOCK: COUNTY OF SAN BERNARDINO
The share of renter-occupied housing units by the year the building was built offers insight into the age of the rental housing stock across the county, California, and the United States. This measure helps illustrate how recently or how long ago rental units were added to each region’s housing supply.
Renter Occupied Housing by Year Built, San Bernardino County
Source: 2023 American Community Survey. Analysis by Beacon Economics.
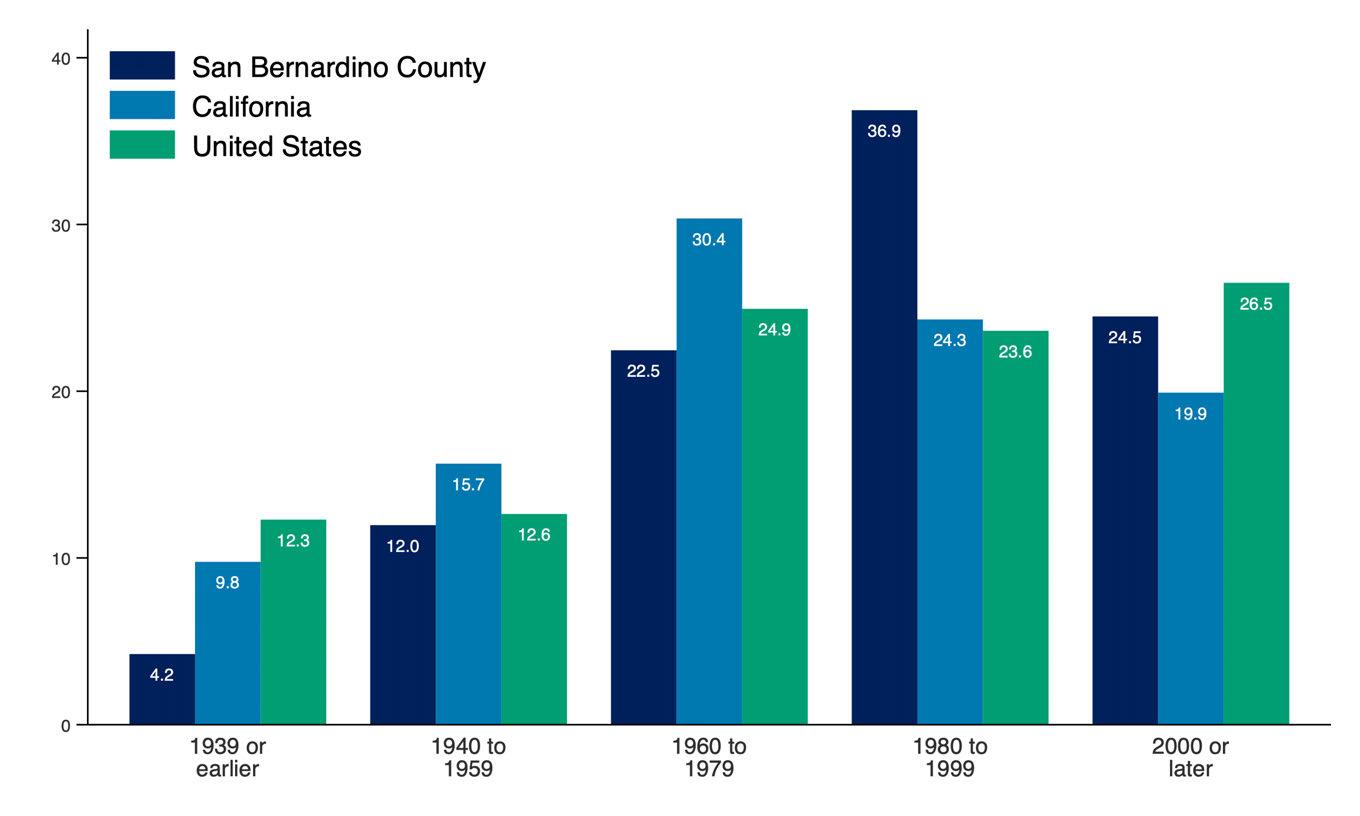
Producer Price Index (PPI) trends for goods and services used in multifamily residential construction reflect how input costs have changed over time. These trends influence the cost and feasibility of developing new rental housing. A broader commodity index is also included to show how construction-specific price movements compare to price trends across all industries.
Producer Price Index by Commodity, United States
Source: U.S. Bureau of Labor Statistics. Analysis by Beacon Economics.
Net Inputs to Multifamily
Residential Construction: Goods, Less Food and Energy
Net Inputs to Multifamily
Residential Construction: Services
All Commodities
Net Inputs to Multifamily
Residential Construction, Excluding Capital Investment, Labor, and Imports
The State of Renters in San Diego County
Renter incomes in San Diego County have grown significantly. Even after adjusting for inflation and subtracting rent, household income has increased by 43.4% over the past decade compared to 21.4% for renters nationwide.
Household composition is shifting as well. The share of single-person renter households in San Diego County has increased by 3.3 percentage points over the past decade, reflecting a broader trend toward smaller household sizes.
Rent burden has remained stable overall. For all renters, the median share of income spent on rent has held steady over the past decade. Among multi-person renter households, rent burden has declined from 30.0% in 2013 to 28.3% in 2023 pointing to modest improvements in affordability for shared households.
STATE OF THE MARKET: COUNTY OF SAN DIEGO
Asking rent represents the price landlords list for vacant units, rather than what current tenants are paying. When adjusted for inflation, it provides insight into how advertised rents have changed in real terms.
The year-over-year rent growth rate captures the pace at which rents are rising or falling. Together, these measures reflect both the level and volatility of rental prices over time.
Real Asking Rents for Apartments in San Diego County ($ Q4-2024)
Source: US Bureau of Labor Statistics. Moody's Analytics. Analysis by Beacon Economics.
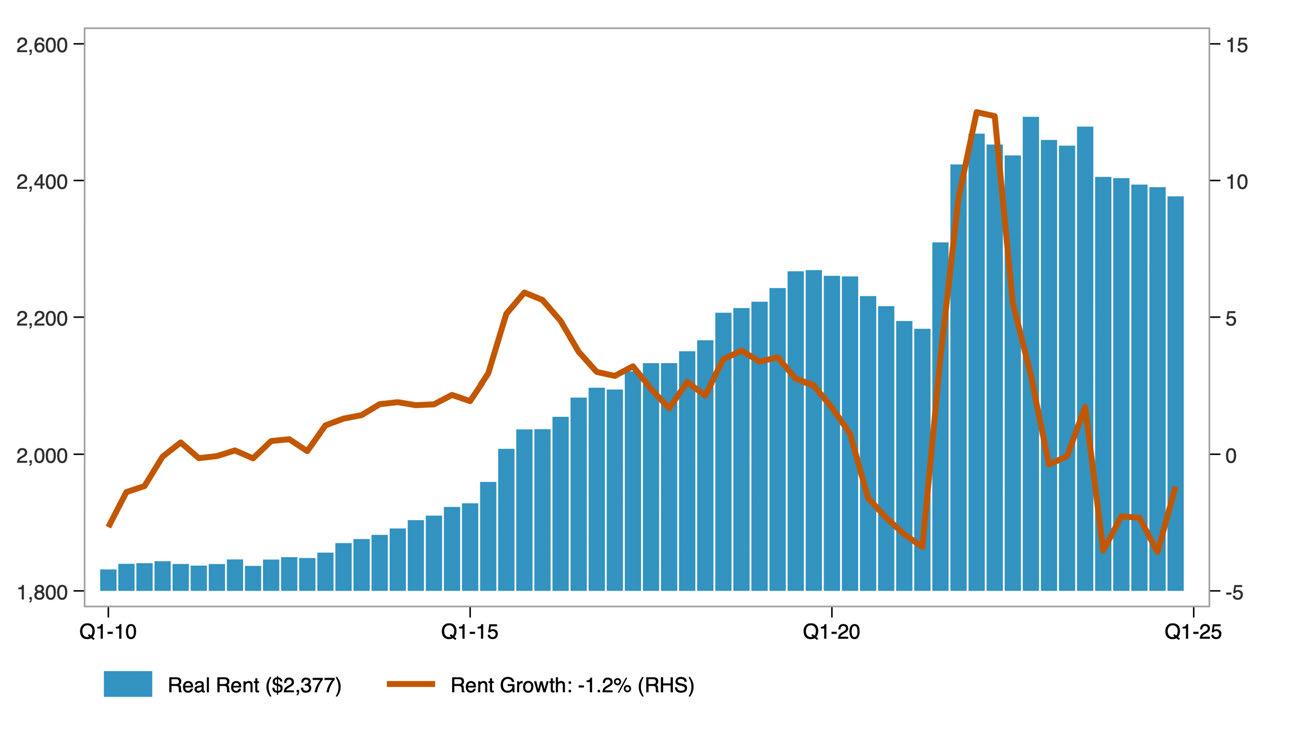
The distribution of real asking rents in the county, adjusted for inflation, shows how advertised rental prices have changed across the market over time. The 25th percentile reflects lower-cost rentals, the median represents the typical rental, and the 75th percentile indicates higher-cost rentals. Together, these measures illustrate how asking rents have changed at multiple price points, not just on average, over the past decade.
Distribution of Real Asking Rents
Source: Public Use Microdata Sample (PUMS). US Bureau of Economic Analysis. Analysis by Beacon Economics. Data are in $ 2023.
The distribution of real contract rents in the county, adjusted for inflation, shows how actual rents paid by tenants have changed across the market over the past decade. Unlike asking rents, contract rents reflect what households are currently paying, offering insight into renters’ real housing costs over time.
Distribution of Real Contract Rents in San Diego County
Source: Public Use Microdata Sample (PUMS). US Bureau of Economic Analysis. Analysis by Beacon Economics. Data are in $ 2023.
The apartment vacancy rate measures the share of rental units that are unoccupied and available for rent at a given time.
Vacancy Rate for Apartments in San Diego County
Source: Moody's Analytics. Analysis by Beacon Economics.
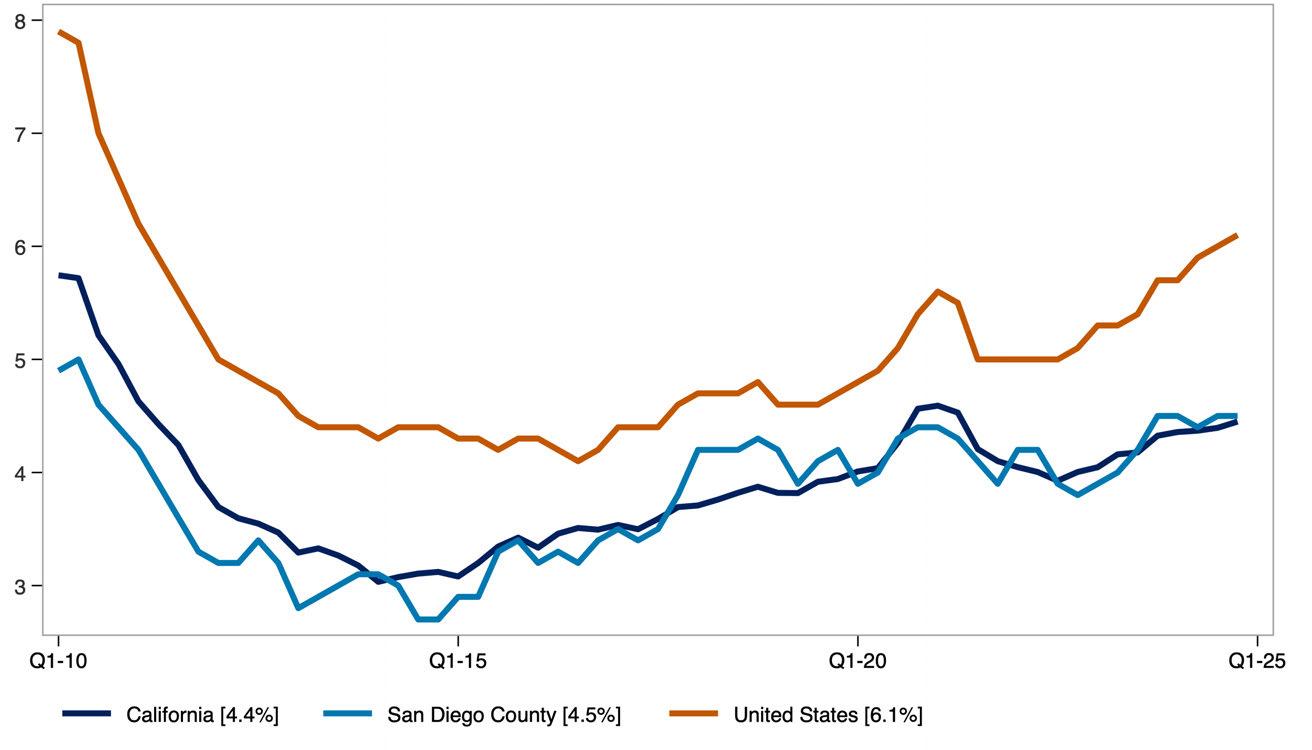
It serves as an indicator of the balance between rental housing supply and demand. Lower vacancy rates typically point to tighter market conditions, while higher rates suggest greater availability.
STATE OF RENTERS: COUNTY OF SAN DIEGO
Key demographic and socioeconomic characteristics of renter households include household size, poverty status, income distribution, language access, and household composition. Together, these indicators offer a snapshot of how renter households are structured and how those characteristics have shifted over time. The data combine absolute figures, such as the number of renter households, with percentages that reflect household traits, such as the share with children or seniors.
Demographic Characteristics of San Diego County Renter Households.
Source: American Community Survey Public Use Microdata Sample (PUMS) Analysis by Beacon Economics.
The share of single-person renter households who moved into their current home within the past two years reflects residential mobility among renters living alone.
This measure helps illustrate turnover in the rental market and may indicate trends in housing availability and economic stability for solo renters.
Share of Single-Person Renter Households That Have Moved in Previous 2 Years
Source: American Community Survey, Public Use Microdata Sample (PUMS). Analysis by Beacon Economics.
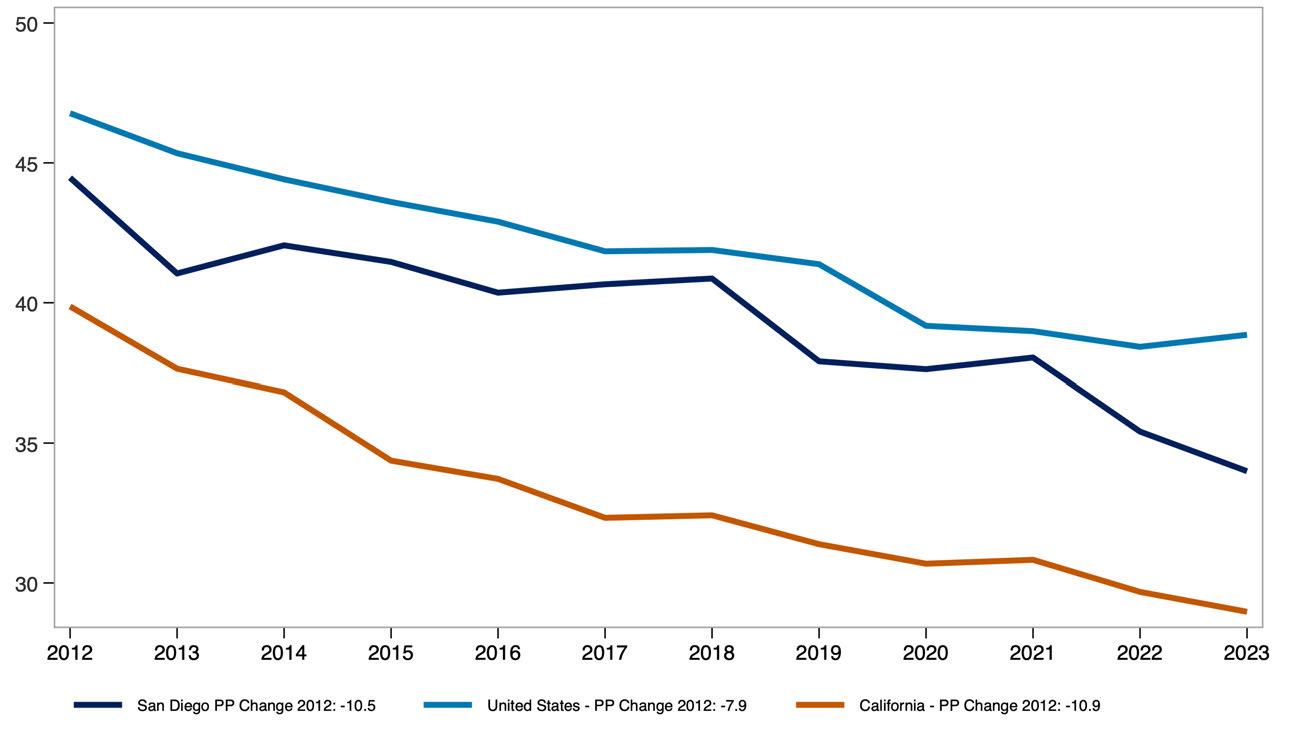
The share of multi-person renter households who moved within the past two years reflects residential mobility among shared or family households.
This measure offers insight into turnover rates and housing stability for renters living with others, whether as families or roommates.
Share of Multi-Person Renter Households That Have Moved in Previous 2 Years
Source: American Community Survey, Public Use Microdata Sample (PUMS). Analysis by Beacon Economics.
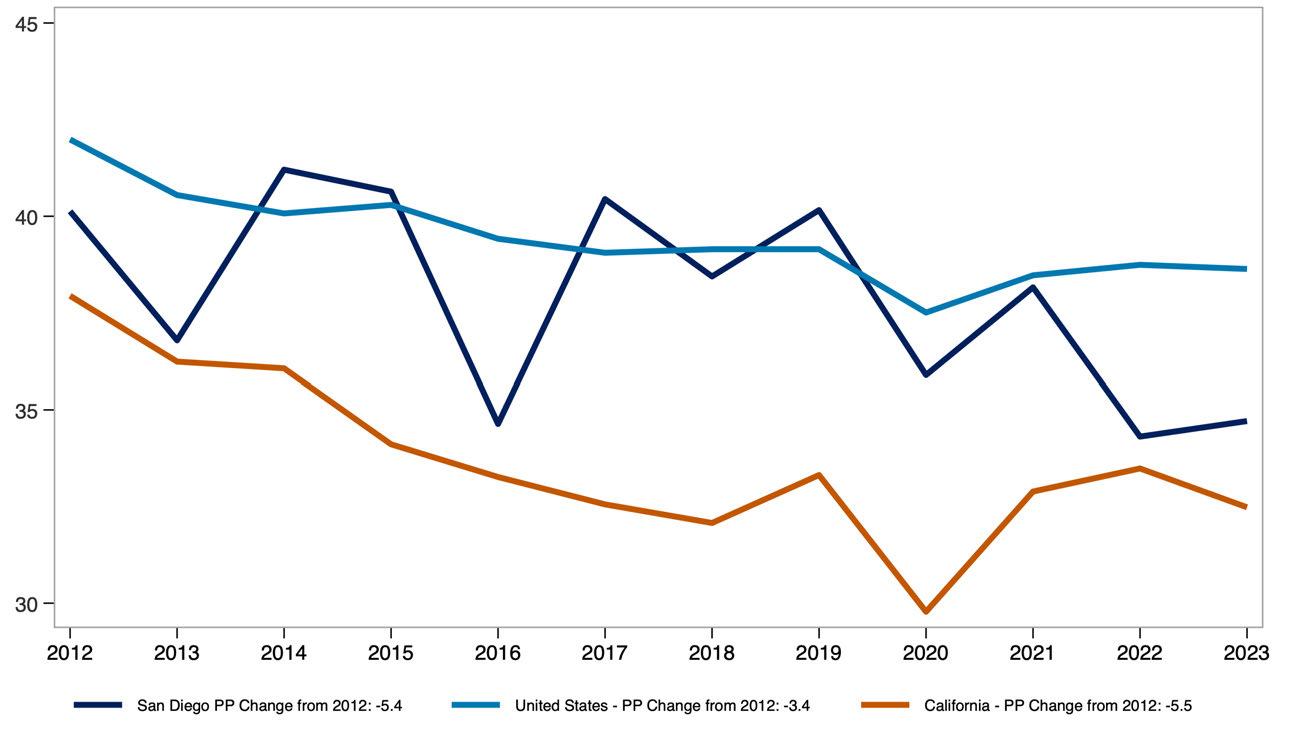
The share of renter households that are single person versus multi-person provides insight into how household size and composition have shifted over time.
Demographic Characteristics of San Diego County Renter Households.
Source: American Community Survey Public Use Microdata Sample (PUMS) Analysis by Beacon Economics.
Real median pre-tax income of renter households, measured in 2023 dollars, reflects how renter incomes have changed in purchasing power over time.
Comparing the county to the U.S. highlights how local renter income levels have evolved relative to the national average.
Real Median Renter Pre-Tax Income ($ 2023, 000s)
Source: Public Use Microdata Sample (PUMS) Analysis by Beacon Economics.
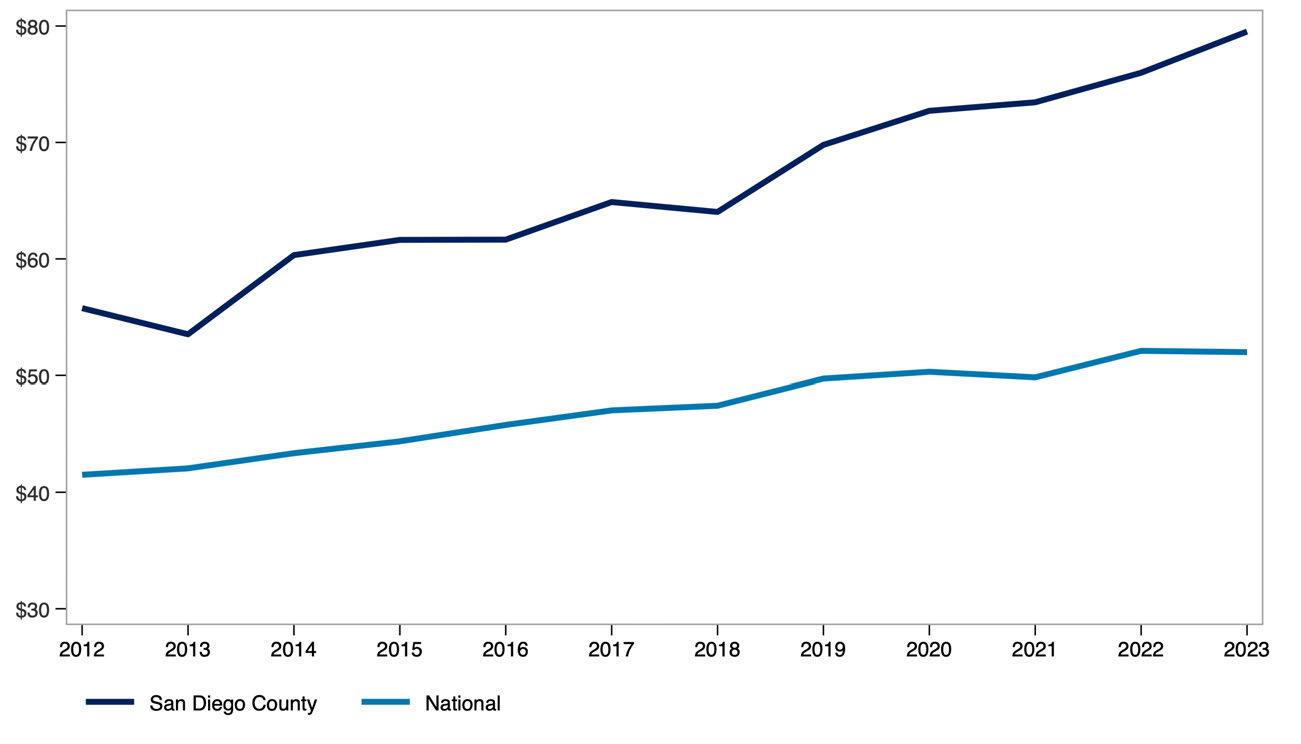
The share of income spent on rent, broken out by renter household type and income level, shows how rent burden varies across the population. This measure compares single-person and multi-person households at the 25th percentile, median, and 75th percentile of the burden distribution, offering insight into how both household size affects housing affordability.
Monthly renter household income before and after rent adjusted for inflation, highlights how much income renters have overall and how much remains after covering housing costs. Presented at the 25th percentile, median, and 75th percentile, this measure provides a view of post-rent income across different points in the income distribution.
Real Monthly Pre/Post-Rent Income for Renter Households in San Diego County
Source: Public Use Microdata Sample (PUMS). US Bureau of Economic Analysis. Analysis by Beacon Economics. Data are in $ 2023.
STATE OF THE STOCK: COUNTY OF SAN DIEGO
The share of renter-occupied housing units by the year the building was built offers insight into the age of the rental housing stock across the county, California, and the United States. This measure helps illustrate how recently or how long ago rental units were added to each region’s housing supply.
Renter Occupied Housing by Year Built, San Diego County
Source: 2023 American Community Survey. Analysis by Beacon Economics.
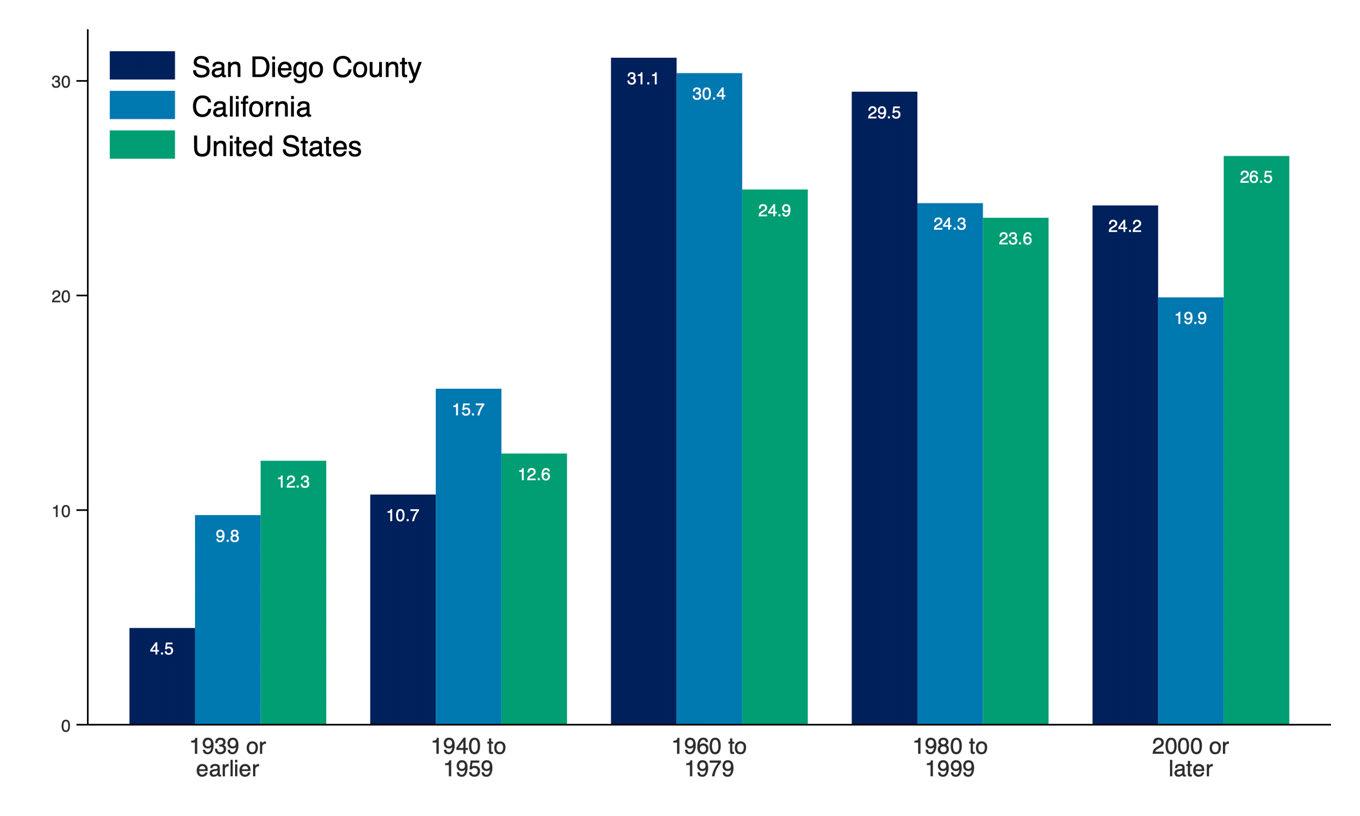
Producer Price Index (PPI) trends for goods and services used in multifamily residential construction reflect how input costs have changed over time. These trends influence the cost and feasibility of developing new rental housing. A broader commodity index is also included to show how construction-specific price movements compare to price trends across all industries.
Producer Price Index by Commodity, United States
Source: U.S. Bureau of Labor Statistics. Analysis by Beacon Economics.
Net Inputs to Multifamily
Residential Construction: Goods, Less Food and Energy
Net Inputs to Multifamily
Residential Construction: Services
All Commodities
Net Inputs to Multifamily
Residential Construction, Excluding Capital Investment, Labor, and Imports
The State of Renters in San Francisco County
Renter incomes in San Francisco County have grown significantly. Even after adjusting for inflation and subtracting rent, household income has increased by 26.4% over the past decade compared to 21.4% for renters nationwide.
Household composition is shifting as well. The share of single-person renter households in San Francisco County has increased by 2.3 percentage points over the past decade, reflecting a broader trend toward smaller household sizes.
Rent burden has remained stable overall. For all renters, the median share of income spent on rent has held steady over the past decade. Among multi-person renter households, rent burden has declined from 22.4% in 2013 to 20.5% in 2023 pointing to modest improvements in affordability for shared households
STATE OF THE MARKET: COUNTY OF SAN FRANCISCO
Asking rent represents the price landlords list for vacant units, rather than what current tenants are paying. When adjusted for inflation, it provides insight into how advertised rents have changed in real terms
The year-over-year rent growth rate captures the pace at which rents are rising or falling. Together, these measures reflect both the level and volatility of rental prices over time.
Real Asking Rents for Apartments in San Francisco County ($
Q4-2024)
Source: US Bureau of Labor Statistics. Moody's Analytics. Analysis by Beacon Economics.

The distribution of real asking rents in the county, adjusted for inflation, shows how advertised rental prices have changed across the market over time. The 25th percentile reflects lower-cost rentals, the median represents the typical rental, and the 75th percentile indicates higher-cost rentals. Together, these measures illustrate how asking rents have changed at multiple price points, not just on average, over the past decade. Distribution of
Source: Public Use Microdata Sample (PUMS). US Bureau of Economic Analysis. Analysis by Beacon Economics. Data are in $ 2023.
The distribution of real contract rents in the county, adjusted for inflation, shows how actual rents paid by tenants have changed across the market over the past decade. Unlike asking rents, contract rents reflect what households are currently paying, offering insight into renters’ real housing costs over time. Distribution of
Source: Public Use Microdata Sample (PUMS). US Bureau of Economic Analysis. Analysis by Beacon Economics. Data are in $ 2023.
The apartment vacancy rate measures the share of rental units that are unoccupied and available for rent at a given time.
Vacancy Rate for Apartments in San Francisco County
Source: Moody's Analytics. Analysis by Beacon Economics.

It serves as an indicator of the balance between rental housing supply and demand. Lower vacancy rates typically point to tighter market conditions, while higher rates suggest greater availability.
STATE OF RENTERS: COUNTY OF SAN FRANCISCO
Key demographic and socioeconomic characteristics of renter households include household size, poverty status, income distribution, language access, and household composition. Together, these indicators offer a snapshot of how renter households are structured and how those characteristics have shifted over time. The data combine absolute figures, such as the number of renter households, with percentages that reflect household traits, such as the share with children or seniors.
Demographic Characteristics of San Francisco County Renter Households.
Source: American Community Survey Public Use Microdata Sample (PUMS) Analysis by Beacon Economics.
The share of single-person renter households who moved into their current home within the past two years reflects residential mobility among renters living alone.
This measure helps illustrate turnover in the rental market and may indicate trends in housing availability and economic stability for solo renters.
Share of Single-Person Renter Households That Have Moved in Previous 2 Years
Source: American Community Survey, Public Use Microdata Sample (PUMS). Analysis by Beacon Economics.
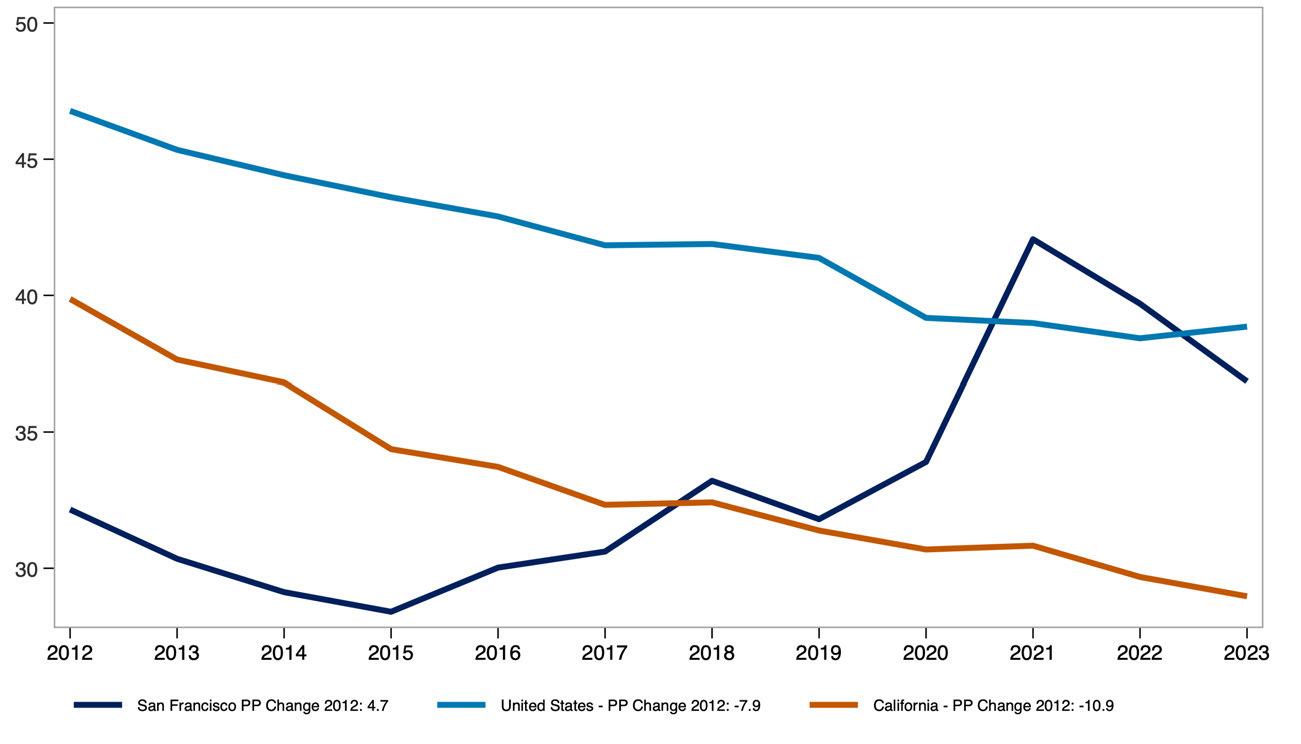
The share of multi-person renter households who moved within the past two years reflects residential mobility among shared or family households.
This measure offers insight into turnover rates and housing stability for renters living with others, whether as families or roommates.
Share of Multi-Person Renter Households That Have Moved in Previous 2 Years
Source: American Community Survey, Public Use Microdata Sample (PUMS). Analysis by Beacon Economics.
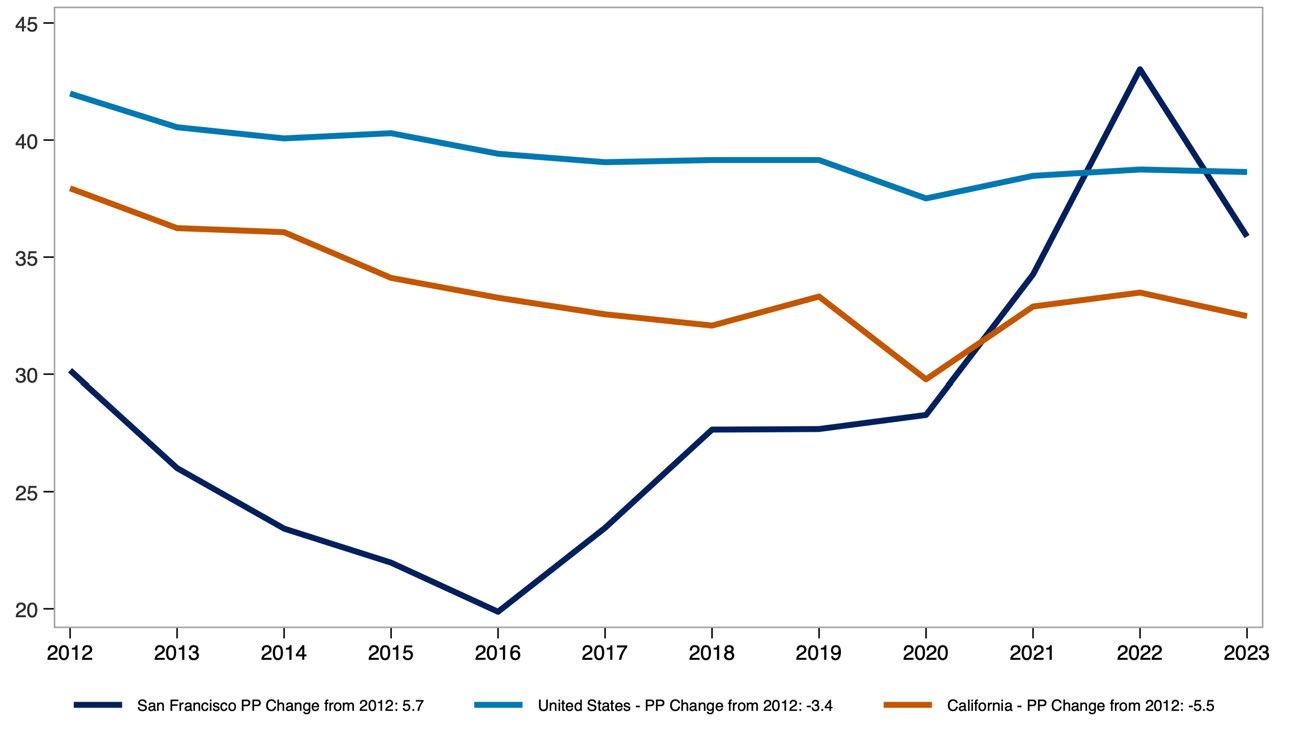
The share of renter households that are single person versus multi-person provides insight into how household size and composition have shifted over time.
Source: American Community Survey Public Use Microdata Sample (PUMS) Analysis by Beacon Economics.
Real median pre-tax income of renter households, measured in 2023 dollars, reflects how renter incomes have changed in purchasing power over time.
Comparing the county to the U.S. highlights how local renter income levels have evolved relative to the national average.
Real Median Renter Pre-Tax Income ($ 2023, 000s)
Source: Public Use Microdata Sample (PUMS) Analysis by Beacon Economics.
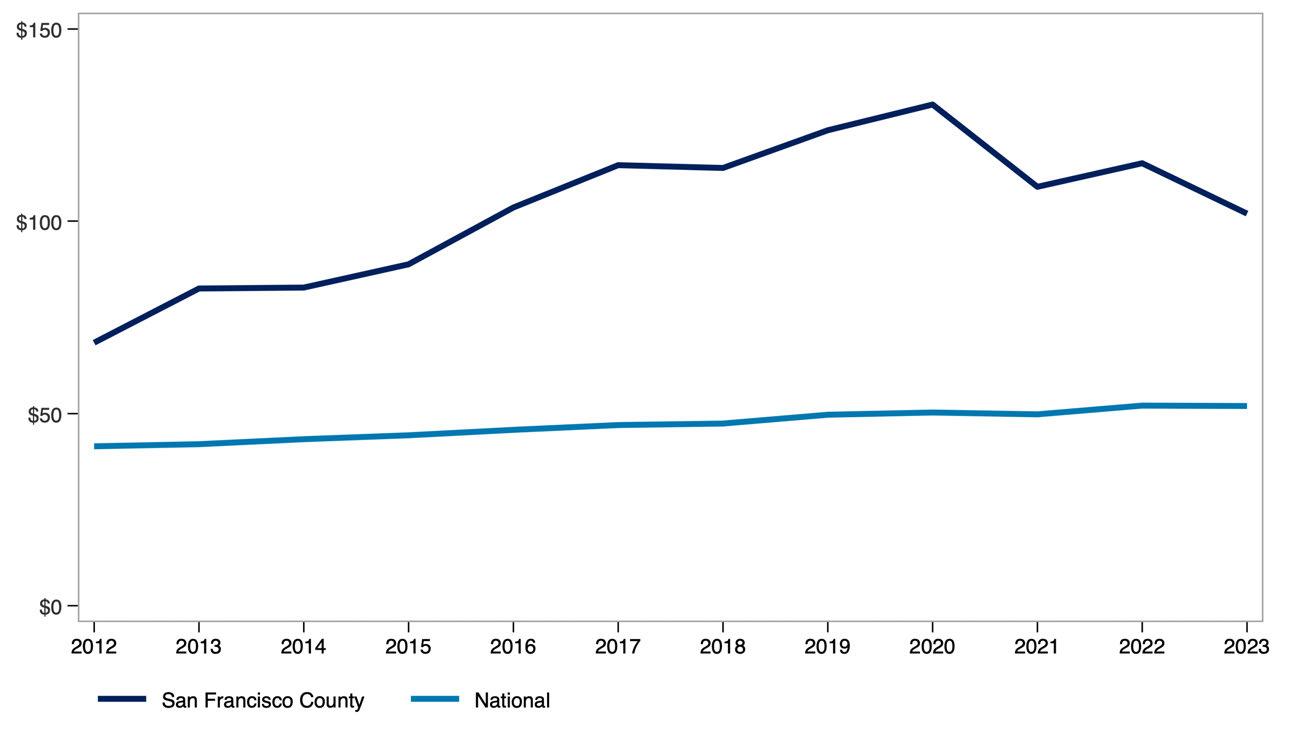
The share of income spent on rent, broken out by renter household type and income level, shows how rent burden varies across the population. This measure compares single-person and multi-person households at the 25th percentile, median, and 75th percentile of the burden distribution, offering insight into how both household size affects housing affordability.
Monthly renter household income before and after rent adjusted for inflation, highlights how much income renters have overall and how much remains after covering housing costs. Presented at the 25th percentile, median, and 75th percentile, this measure provides a view of post-rent income across different points in the income distribution.
Real Monthly Pre/Post-Rent Income for Renter Households in San Francisco County
Source: Public Use Microdata Sample (PUMS). US Bureau of Economic Analysis. Analysis by Beacon Economics. Data are in $ 2023.
STATE OF THE STOCK: COUNTY OF SAN FRANCISCO
The share of renter-occupied housing units by the year the building was built offers insight into the age of the rental housing stock across the county, California, and the United States.
This measure helps illustrate how recently or how long ago rental units were added to each region’s housing supply.
Renter Occupied Housing by Year Built, San Francisco County
Source: 2023 American Community Survey. Analysis by Beacon Economics.
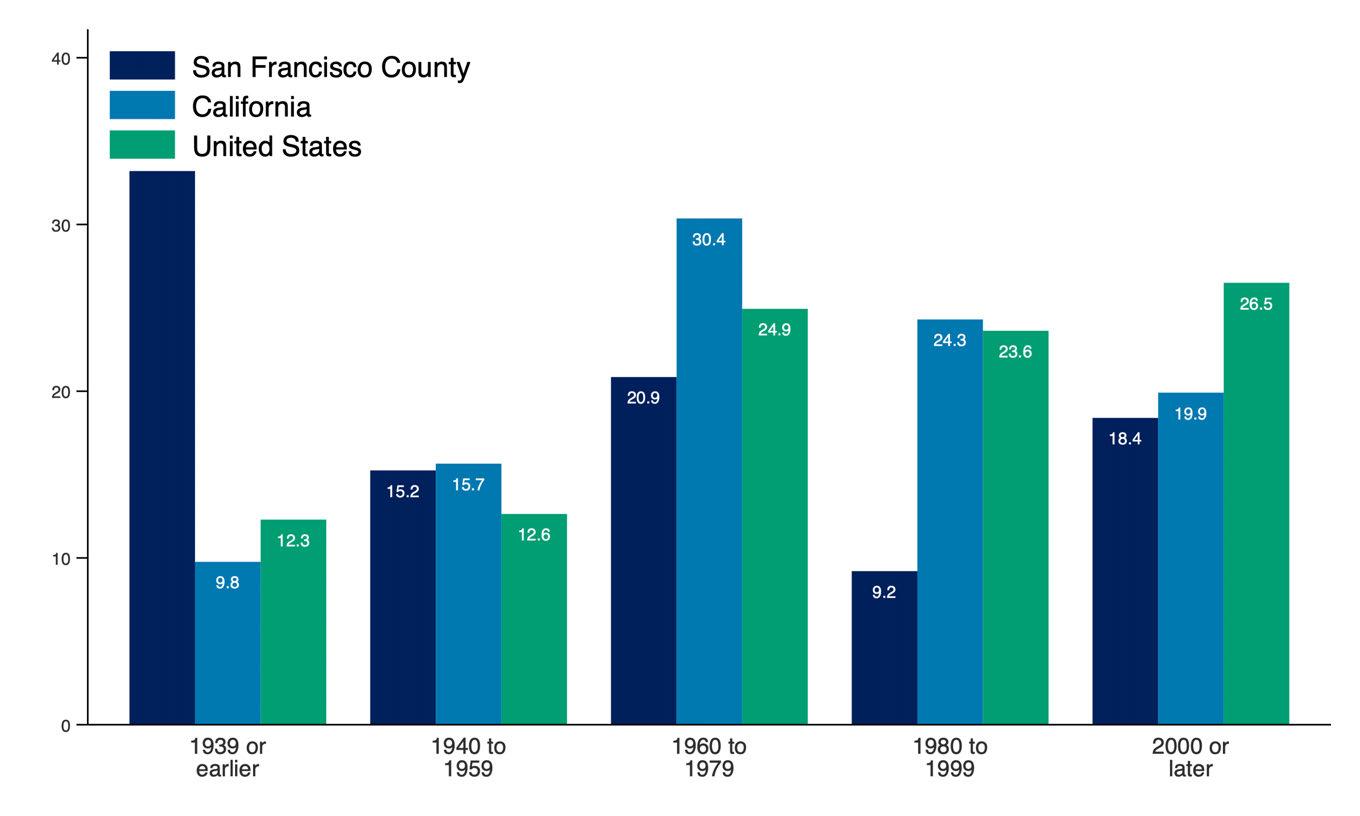
Producer Price Index (PPI) trends for goods and services used in multifamily residential construction reflect how input costs have changed over time. These trends influence the cost and feasibility of developing new rental housing. A broader commodity index is also included to show how construction-specific price movements compare to price trends across all industries.
Producer Price Index by Commodity, United States
Source: U.S. Bureau of Labor Statistics. Analysis by Beacon Economics.
Net Inputs to Multifamily
Residential Construction: Goods, Less Food and Energy
Net Inputs to Multifamily
Residential Construction: Services
All Commodities
Net Inputs to Multifamily
Residential Construction, Excluding Capital Investment, Labor, and Imports
The State of Renters in San Joaquin County
Renter incomes in San Joaquin County have grown significantly. Even after adjusting for inflation and subtracting rent, household income has increased by 55.4% over the past decade compared to 21.4% for renters nationwide.
Household composition is shifting as well. The share of single-person renter households in San Joaquin County has increased by 0.2 percentage points over the past decade, reflecting a broader trend toward smaller household sizes.
Rent burden has remained stable overall. For all renters, the median share of income spent on rent has held steady over the past decade. Among multi-person renter households, rent burden has declined from 27.8% in 2013 to 24.8% in 2023 pointing to modest improvements in affordability for shared households.
STATE OF THE MARKET: COUNTY OF SAN JOAQUIN
Asking rent represents the price landlords list for vacant units, rather than what current tenants are paying. When adjusted for inflation, it provides insight into how advertised rents have changed in real terms.
The year-over-year rent growth rate captures the pace at which rents are rising or falling. Together, these measures reflect both the level and volatility of rental prices over time.
Real Asking Rents for Apartments in San
Joaquin County ($ Q4-2024)
Source: US Bureau of Labor Statistics. Moody's Analytics. Analysis by Beacon Economics.

The distribution of real asking rents in the county, adjusted for inflation, shows how advertised rental prices have changed across the market over time. The 25th percentile reflects lower-cost rentals, the median represents the typical rental, and the 75th percentile indicates higher-cost rentals. Together, these measures illustrate how asking rents have changed at multiple price points, not just on average, over the past decade.
Distribution of Real Asking Rents in San Joaquin County
Source: Public Use Microdata Sample (PUMS). US Bureau of Economic Analysis. Analysis by Beacon Economics. Data are in $ 2023.
The distribution of real contract rents in the county, adjusted for inflation, shows how actual rents paid by tenants have changed across the market over the past decade. Unlike asking rents, contract rents reflect what households are currently paying, offering insight into renters’ real housing costs over time.
Distribution of Real Contract Rents in San Joaquin County
Source: Public Use Microdata Sample (PUMS). US Bureau of Economic Analysis. Analysis by Beacon Economics. Data are in $ 2023.
The apartment vacancy rate measures the share of rental units that are unoccupied and available for rent at a given time.
Vacancy Rate for Apartments in San Joaquin County
Source: Moody's Analytics. Analysis by Beacon Economics.

It serves as an indicator of the balance between rental housing supply and demand. Lower vacancy rates typically point to tighter market conditions, while higher rates suggest greater availability.
STATE OF RENTERS: COUNTY OF SAN JOAQUIN
Key demographic and socioeconomic characteristics of renter households include household size, poverty status, income distribution, language access, and household composition. Together, these indicators offer a snapshot of how renter households are structured and how those characteristics have shifted over time. The data combine absolute figures, such as the number of renter households, with percentages that reflect household traits, such as the share with children or seniors.
Demographic Characteristics of San Joaquin County Renter Households.
Source: American Community Survey Public Use Microdata Sample (PUMS) Analysis by Beacon Economics.
The share of single-person renter households who moved into their current home within the past two years reflects residential mobility among renters living alone.
This measure helps illustrate turnover in the rental market and may indicate trends in housing availability and economic stability for solo renters.
Share of Single-Person Renter Households That Have Moved in Previous 2 Years
Source: American Community Survey, Public Use Microdata Sample (PUMS). Analysis by Beacon Economics.
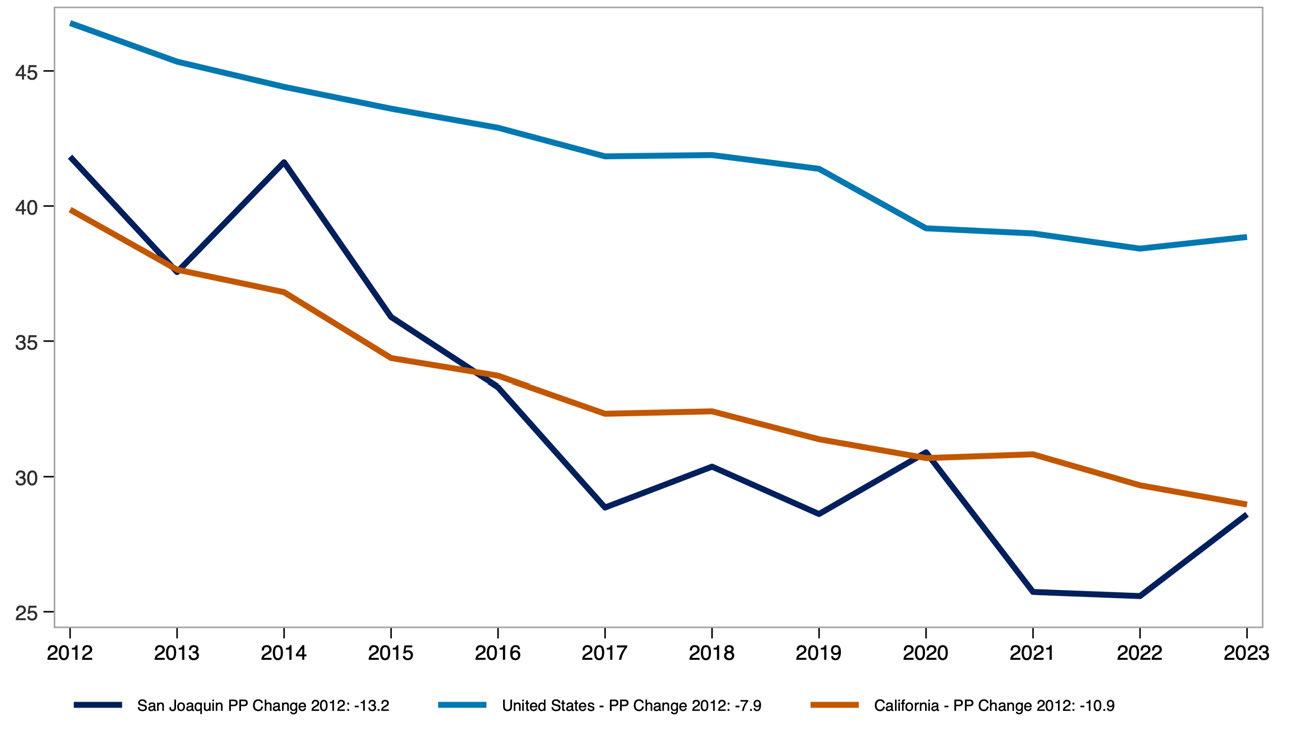
The share of multi-person renter households who moved within the past two years reflects residential mobility among shared or family households.
This measure offers insight into turnover rates and housing stability for renters living with others, whether as families or roommates.
Share of Multi-Person Renter Households That Have Moved in Previous 2 Years
Source: American Community Survey, Public Use Microdata Sample (PUMS). Analysis by Beacon Economics.

The share of renter households that are single person versus multi-person provides insight into how household size and composition have shifted over time.
Demographic Characteristics of San Joaquin County Renter Households.
Source: American Community Survey Public Use Microdata Sample (PUMS) Analysis by Beacon Economics.
Real median pre-tax income of renter households, measured in 2023 dollars, reflects how renter incomes have changed in purchasing power over time.
Comparing the county to the U.S. highlights how local renter income levels have evolved relative to the national average.
Real Median Renter Pre-Tax Income ($ 2023, 000s)
Source: Public Use Microdata Sample (PUMS) Analysis by Beacon Economics.
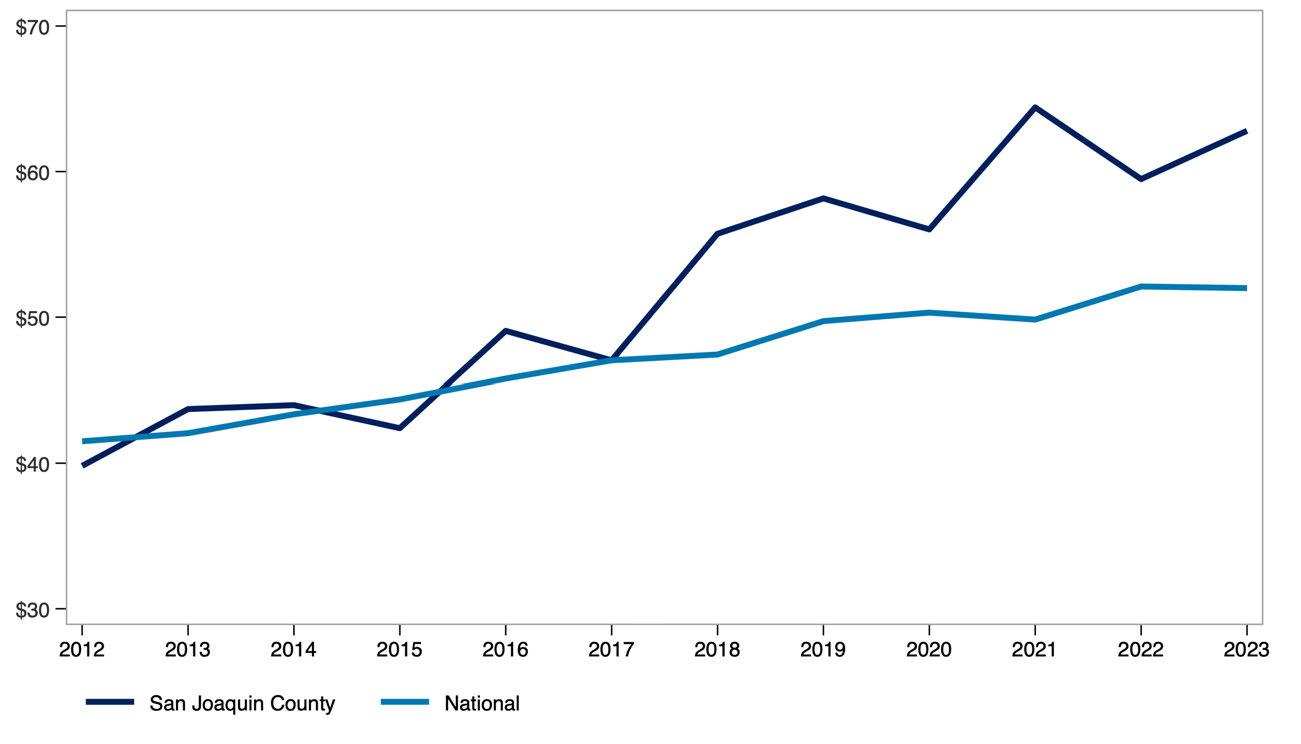
The share of income spent on rent, broken out by renter household type and income level, shows how rent burden varies across the population. This measure compares single-person and multi-person households at the 25th percentile, median, and 75th percentile of the burden distribution, offering insight into how both household size affects housing affordability.
Monthly renter household income before and after rent adjusted for inflation, highlights how much income renters have overall and how much remains after covering housing costs. Presented at the 25th percentile, median, and 75th percentile, this measure provides a view of post-rent income across different points in the income distribution.
Real Monthly Pre/Post-Rent Income for Renter Households in San Joaquin County
Source: Public Use Microdata Sample (PUMS). US Bureau of Economic Analysis. Analysis by Beacon Economics. Data are in $ 2023.
STATE OF THE STOCK: COUNTY OF SAN JOAQUIN
The share of renter-occupied housing units by the year the building was built offers insight into the age of the rental housing stock across the county, California, and the United States. This measure helps illustrate how recently or how long ago rental units were added to each region’s housing supply.
Renter Occupied Housing by Year Built, San Joaquin County
Source: 2023 American Community Survey. Analysis by Beacon Economics.
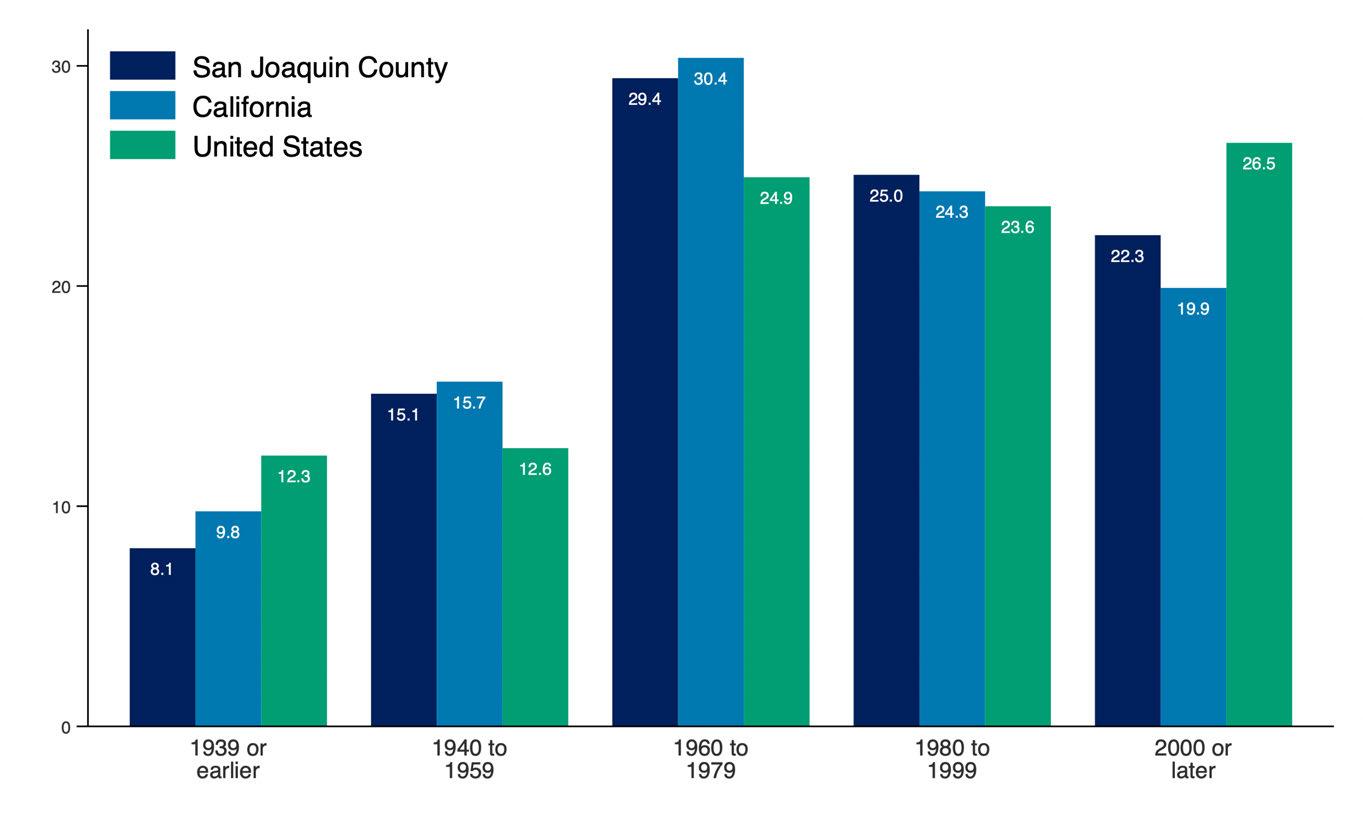
Producer Price Index (PPI) trends for goods and services used in multifamily residential construction reflect how input costs have changed over time. These trends influence the cost and feasibility of developing new rental housing. A broader commodity index is also included to show how construction-specific price movements compare to price trends across all industries.
Producer Price Index by Commodity, United States
Source: U.S. Bureau of Labor Statistics. Analysis by Beacon Economics.
Net Inputs to Multifamily
Residential Construction: Goods, Less Food and Energy
Net Inputs to Multifamily
Residential Construction: Services
All Commodities
Net Inputs to Multifamily
Residential Construction, Excluding Capital Investment, Labor, and Imports
The State of Renters in San Mateo County
Renter incomes in San Mateo County have grown significantly. Even after adjusting for inflation and subtracting rent, household income has increased by 52.5% over the past decade compared to 21.4% for renters nationwide.
Household composition is shifting as well. The share of single-person renter households in San Mateo County has increased by 3.2 percentage points over the past decade, reflecting a broader trend toward smaller household sizes.
Rent burden has remained stable overall. For all renters, the median share of income spent on rent has held steady over the past decade. Among multi-person renter households, rent burden has declined from 26.5% in 2013 to 24.0% in 2023 pointing to modest improvements in affordability for shared households.
STATE OF THE MARKET: COUNTY OF SAN MATEO
Asking rent represents the price landlords list for vacant units, rather than what current tenants are paying. When adjusted for inflation, it provides insight into how advertised rents have changed in real terms.
The year-over-year rent growth rate captures the pace at which rents are rising or falling. Together, these measures reflect both the level and volatility of rental prices over time.
Real Asking Rents for Apartments in San Mateo County ($ Q4-2024)
Source: US Bureau of Labor Statistics. Moody's Analytics. Analysis by Beacon Economics.
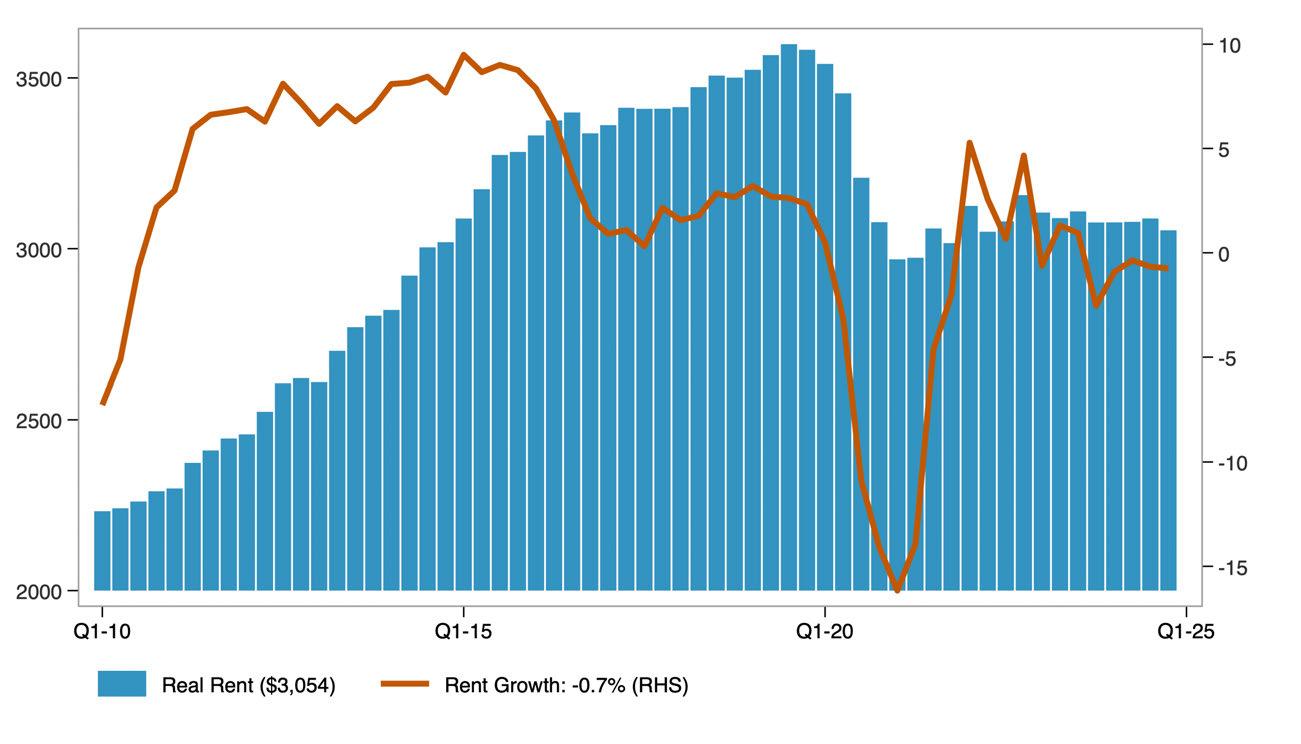
The distribution of real asking rents in the county, adjusted for inflation, shows how advertised rental prices have changed across the market over time. The 25th percentile reflects lower-cost rentals, the median represents the typical rental, and the 75th percentile indicates higher-cost rentals. Together, these measures illustrate how asking rents have changed at multiple price points, not just on average, over the past decade.
Distribution of Real Asking Rents in San Mateo County
Source: Public Use Microdata Sample (PUMS). US Bureau of Economic Analysis. Analysis by Beacon Economics. Data are in $ 2023.
The distribution of real contract rents in the county, adjusted for inflation, shows how actual rents paid by tenants have changed across the market over the past decade. Unlike asking rents, contract rents reflect what households are currently paying, offering insight into renters’ real housing costs over time.
Distribution of Real Contract Rents in San Mateo County
Source: Public Use Microdata Sample (PUMS). US Bureau of Economic Analysis. Analysis by Beacon Economics. Data are in $ 2023.
The apartment vacancy rate measures the share of rental units that are unoccupied and available for rent at a given time.
Vacancy Rate for Apartments in San Mateo County
Source: Moody's Analytics. Analysis by Beacon Economics.

It serves as an indicator of the balance between rental housing supply and demand. Lower vacancy rates typically point to tighter market conditions, while higher rates suggest greater availability.
STATE OF RENTERS: COUNTY OF SAN MATEO
Key demographic and socioeconomic characteristics of renter households include household size, poverty status, income distribution, language access, and household composition. Together, these indicators offer a snapshot of how renter households are structured and how those characteristics have shifted over time. The data combine absolute figures, such as the number of renter households, with percentages that reflect household traits, such as the share with children or seniors.
Demographic Characteristics of San Mateo County Renter Households.
Source: American Community Survey Public Use Microdata Sample (PUMS) Analysis by Beacon Economics.
The share of single-person renter households who moved into their current home within the past two years reflects residential mobility among renters living alone.
This measure helps illustrate turnover in the rental market and may indicate trends in housing availability and economic stability for solo renters.
Share of Single-Person Renter Households That Have Moved in Previous 2 Years
Source: American Community Survey, Public Use Microdata Sample (PUMS). Analysis by Beacon Economics.

The share of multi-person renter households who moved within the past two years reflects residential mobility among shared or family households.
This measure offers insight into turnover rates and housing stability for renters living with others, whether as families or roommates.
Share of Multi-Person Renter Households That Have Moved in Previous 2 Years
Source: American Community Survey, Public Use Microdata Sample (PUMS). Analysis by Beacon Economics.
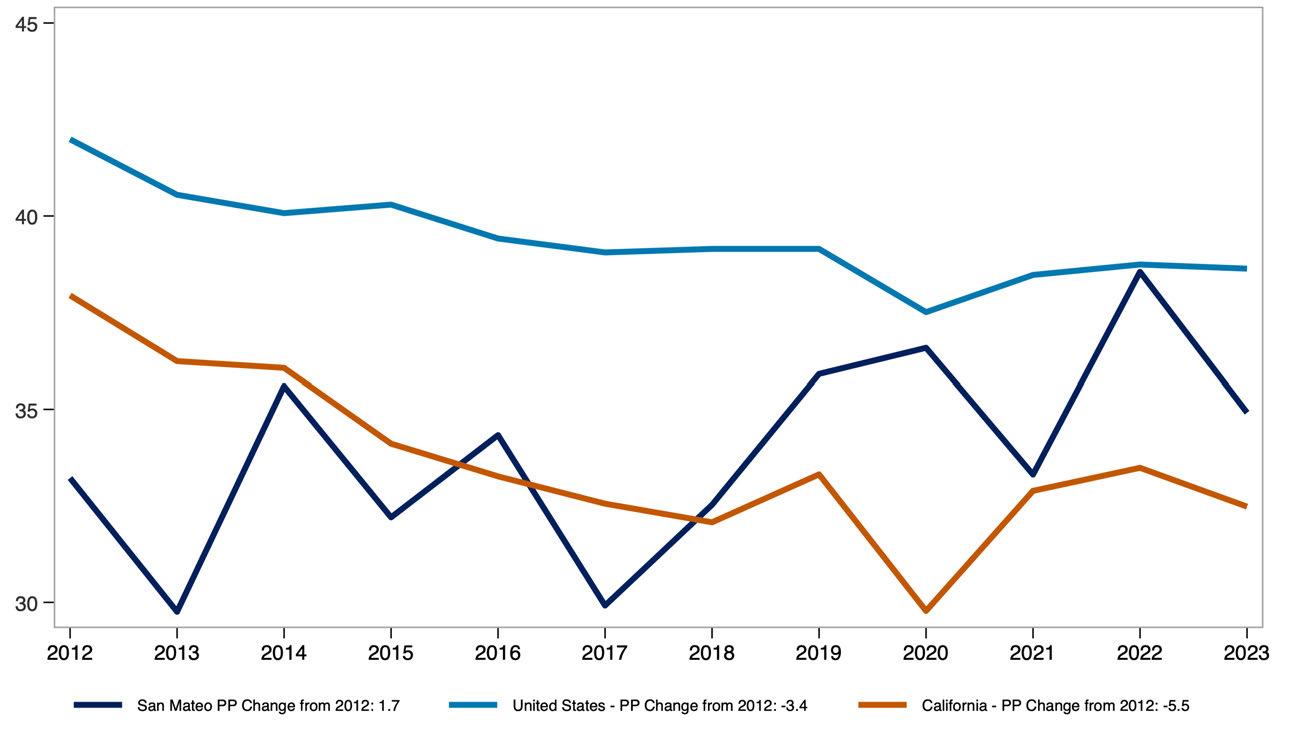
The share of renter households that are single person versus multi-person provides insight into how household size and composition have shifted over time. Demographic Characteristics
Source: American Community Survey Public Use Microdata Sample (PUMS) Analysis by Beacon Economics.
Real median pre-tax income of renter households, measured in 2023 dollars, reflects how renter incomes have changed in purchasing power over time.
Comparing the county to the U.S. highlights how local renter income levels have evolved relative to the national average.
Real Median Renter Pre-Tax Income ($ 2023, 000s)
Source: Public Use Microdata Sample (PUMS) Analysis by Beacon Economics.
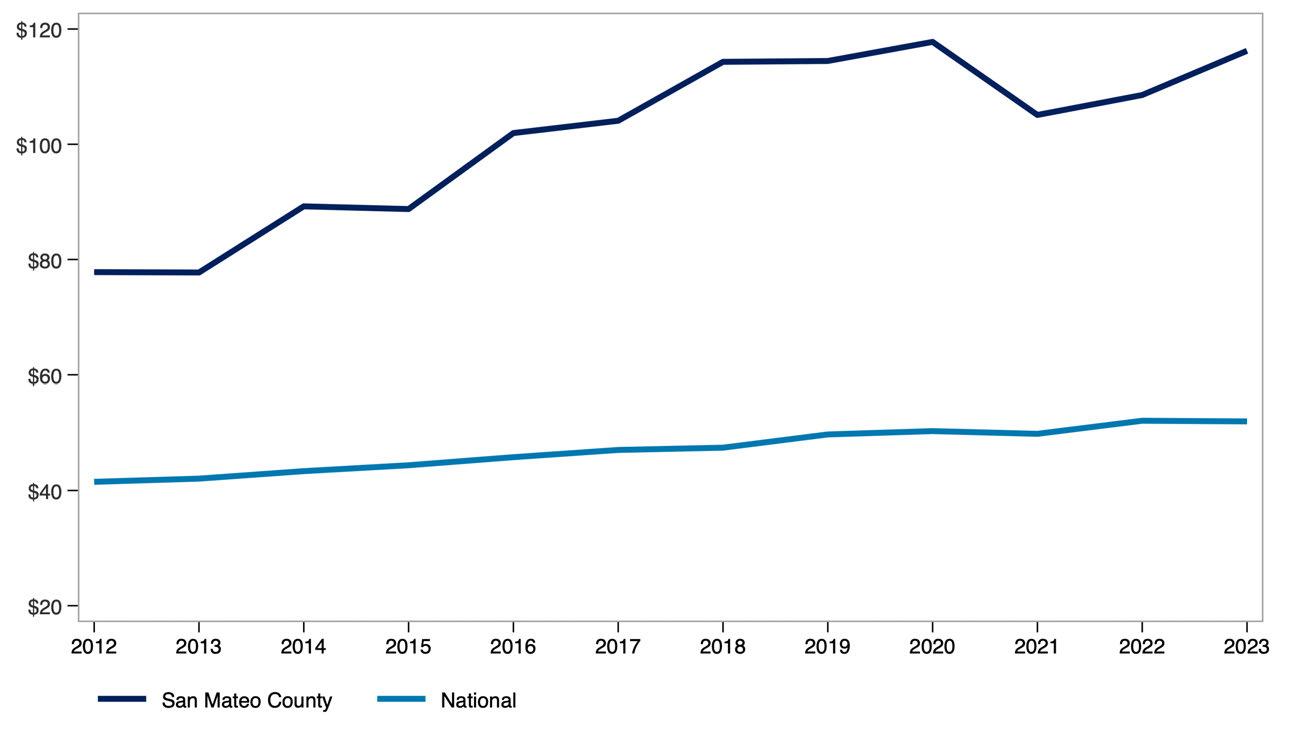
The share of income spent on rent, broken out by renter household type and income level, shows how rent burden varies across the population. This measure compares single-person and multi-person households at the 25th percentile, median, and 75th percentile of the burden distribution, offering insight into how both household size affects housing affordability.
Monthly renter household income before and after rent adjusted for inflation, highlights how much income renters have overall and how much remains after covering housing costs. Presented at the 25th percentile, median, and 75th percentile, this measure provides a view of post-rent income across different points in the income distribution.
Real Monthly Pre/Post-Rent Income for Renter Households in San Mateo County
Source: Public Use Microdata Sample (PUMS). US Bureau of Economic Analysis. Analysis by Beacon Economics. Data are in $ 2023.
STATE OF THE STOCK: COUNTY OF SAN MATEO
The share of renter-occupied housing units by the year the building was built offers insight into the age of the rental housing stock across the county, California, and the United States.
This measure helps illustrate how recently or how long ago rental units were added to each region’s housing supply.
Renter Occupied Housing by Year Built, San Mateo County
Source: 2023 American Community Survey. Analysis by Beacon Economics.
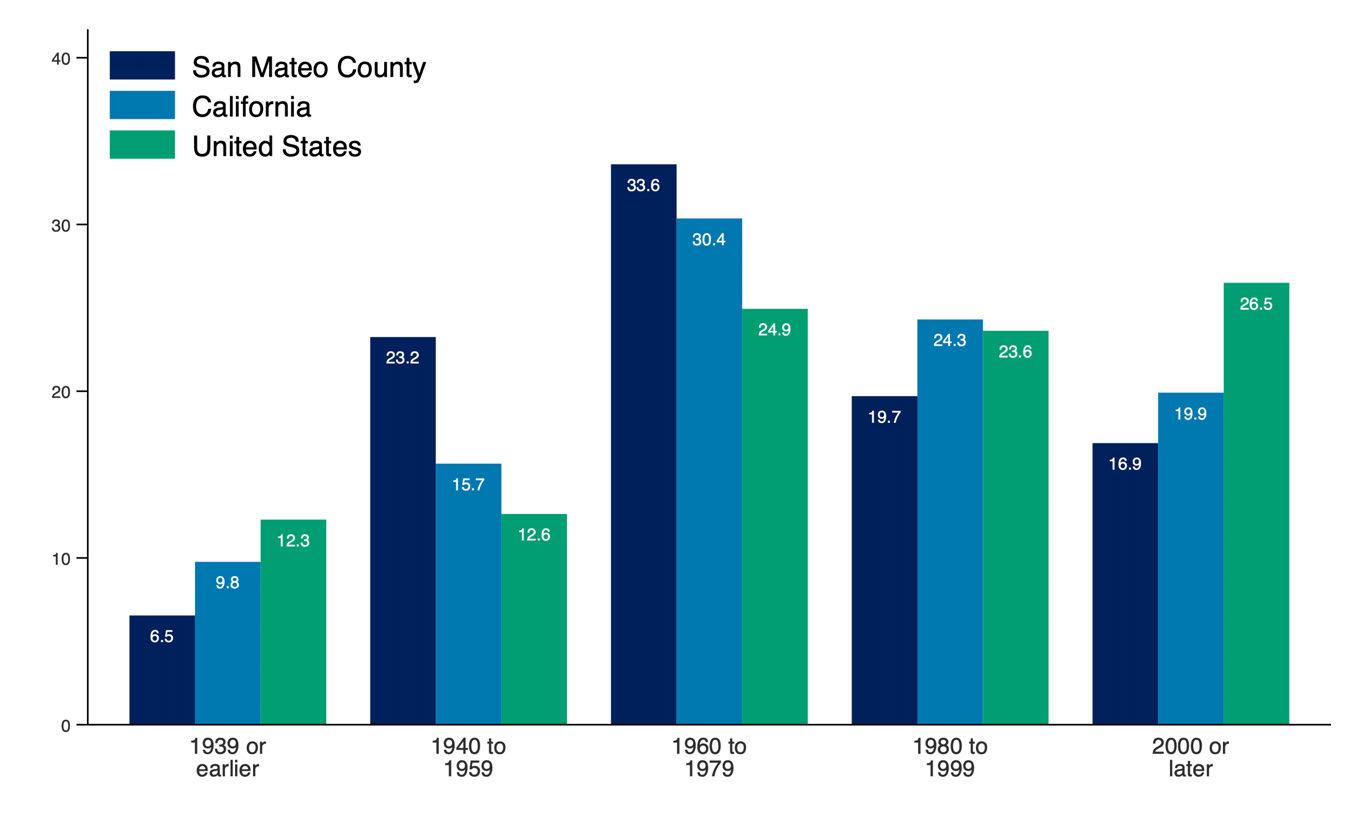
Producer Price Index (PPI) trends for goods and services used in multifamily residential construction reflect how input costs have changed over time. These trends influence the cost and feasibility of developing new rental housing. A broader commodity index is also included to show how construction-specific price movements compare to price trends across all industries.
Producer Price Index by Commodity, United States
Source: U.S. Bureau of Labor Statistics. Analysis by Beacon Economics.
Net Inputs to Multifamily
Residential Construction: Goods, Less Food and Energy
Net Inputs to Multifamily
Residential Construction: Services
All Commodities
Net Inputs to Multifamily
Residential Construction, Excluding Capital Investment, Labor, and Imports
The State of Renters in Santa Barbara County
Renter incomes in Santa Barbara County have grown significantly. Even after adjusting for inflation and subtracting rent, household income has increased by 25.3% over the past decade compared to 21.4% for renters nationwide.
Household composition is shifting as well. The share of single-person renter households in Santa Barbara County has increased by 4.7 percentage points over the past decade, reflecting a broader trend toward smaller household sizes.
Rent burden has remained stable overall. For all renters, the median share of income spent on rent has held steady over the past decade. Among multi-person renter households, rent burden has increased slightly from 31.0% in 2013 to 32.0% in 2023.
STATE OF THE MARKET: COUNTY OF SANTA BARBARA
Asking rent represents the price landlords list for vacant units, rather than what current tenants are paying. When adjusted for inflation, it provides insight into how advertised rents have changed in real terms.
The year-over-year rent growth rate captures the pace at which rents are rising or falling. Together, these measures reflect both the level and volatility of rental prices over time.
Real Asking Rents for Apartments in Santa Barbara County ($ Q4-2024)
Source: US Bureau of Labor Statistics. Moody's Analytics. Analysis by Beacon Economics.
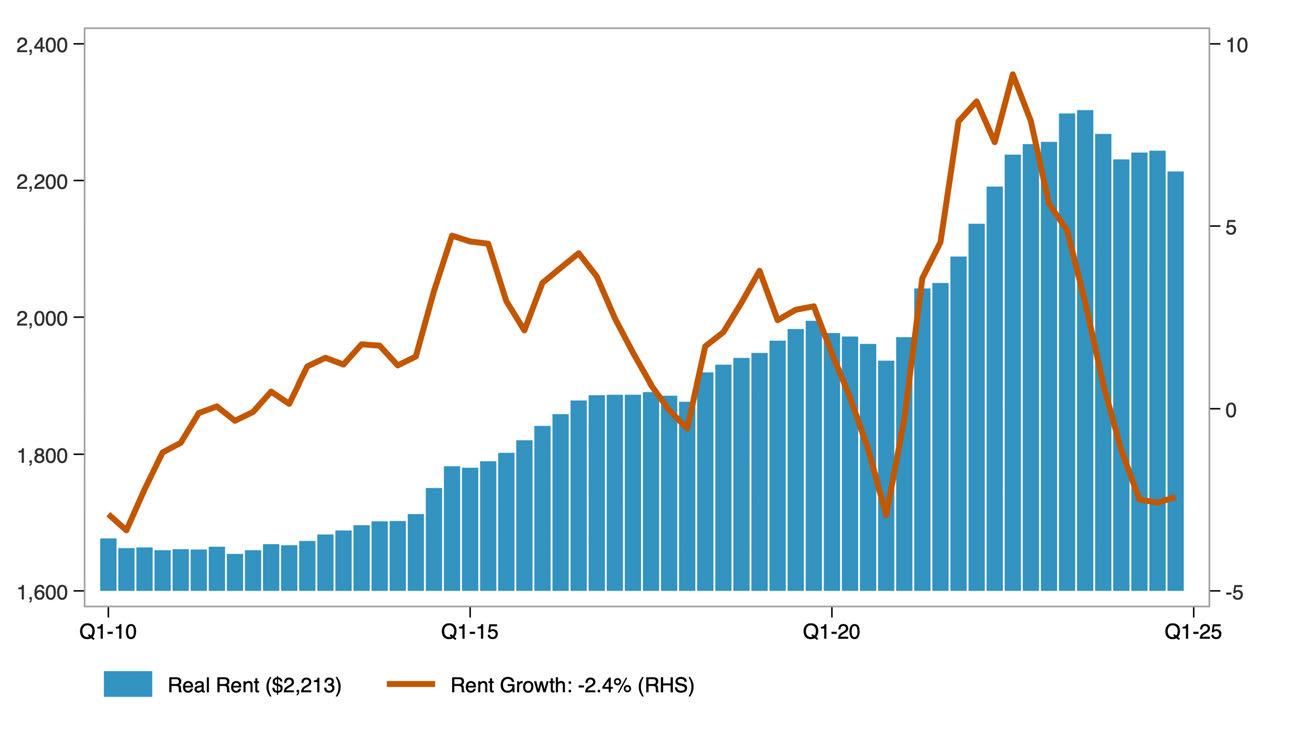
The distribution of real asking rents in the county, adjusted for inflation, shows how advertised rental prices have changed across the market over time. The 25th percentile reflects lower-cost rentals, the median represents the typical rental, and the 75th percentile indicates higher-cost rentals. Together, these measures illustrate how asking rents have changed at multiple price points, not just on average, over the past decade.
Distribution of Real Asking Rents in Santa Barbara County
Source: Public Use Microdata Sample (PUMS). US Bureau of Economic Analysis. Analysis by Beacon Economics. Data are in $ 2023.
The distribution of real contract rents in the county, adjusted for inflation, shows how actual rents paid by tenants have changed across the market over the past decade. Unlike asking rents, contract rents reflect what households are currently paying, offering insight into renters’ real housing costs over time.
Distribution of Real Contract Rents in Santa Barbara County
Source: Public Use Microdata Sample (PUMS). US Bureau of Economic Analysis. Analysis by Beacon Economics. Data are in $ 2023.
The apartment vacancy rate measures the share of rental units that are unoccupied and available for rent at a given time.
Vacancy Rate for Apartments in Santa Barbara County
Source: Moody's Analytics. Analysis by Beacon Economics.
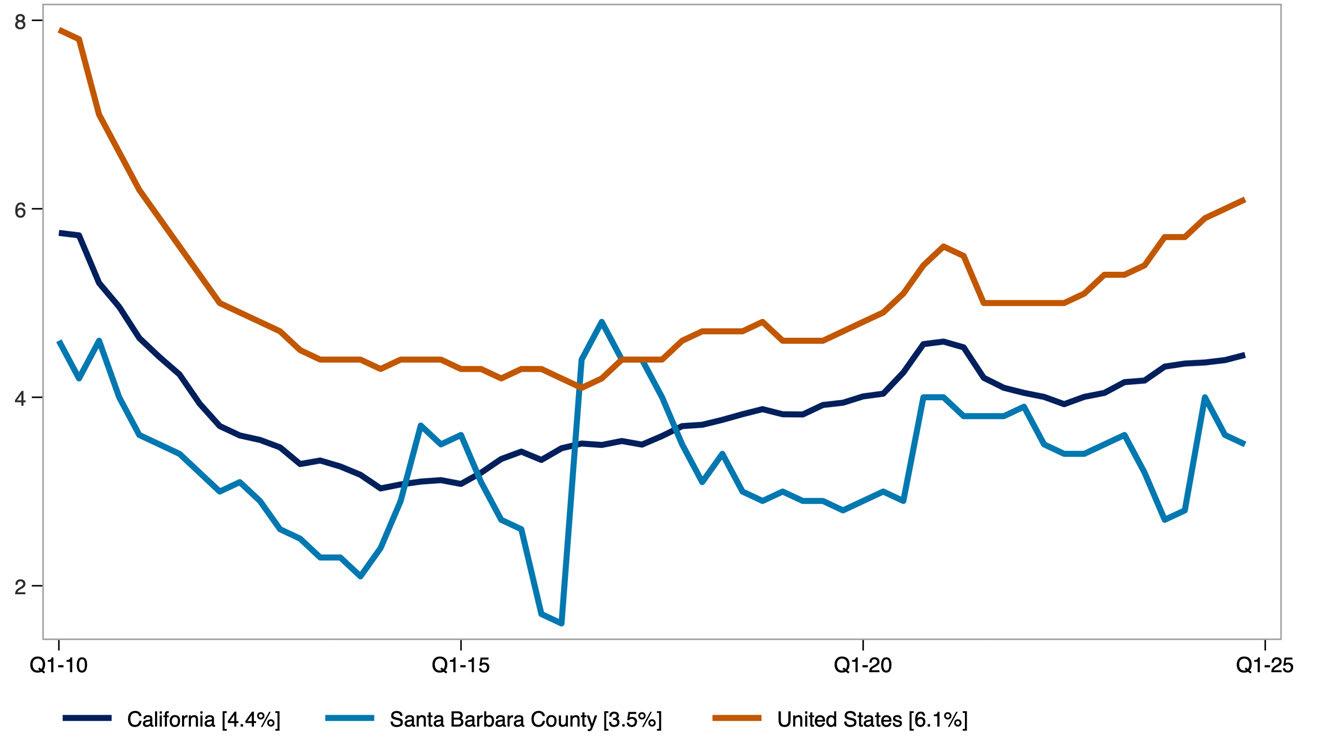
It serves as an indicator of the balance between rental housing supply and demand. Lower vacancy rates typically point to tighter market conditions, while higher rates suggest greater availability.
STATE OF RENTERS: COUNTY OF SANTA BARBARA
Key demographic and socioeconomic characteristics of renter households include household size, poverty status, income distribution, language access, and household composition. Together, these indicators offer a snapshot of how renter households are structured and how those characteristics have shifted over time. The data combine absolute figures, such as the number of renter households, with percentages that reflect household traits, such as the share with children or seniors.
Demographic Characteristics of Santa Barbara County Renter Households.
Source: American Community Survey Public Use Microdata Sample (PUMS) Analysis by Beacon Economics.
The share of single-person renter households who moved into their current home within the past two years reflects residential mobility among renters living alone.
This measure helps illustrate turnover in the rental market and may indicate trends in housing availability and economic stability for solo renters.
Share of Single-Person Renter Households That Have Moved in Previous 2 Years
Source: American Community Survey, Public Use Microdata Sample (PUMS). Analysis by Beacon Economics.

The share of multi-person renter households who moved within the past two years reflects residential mobility among shared or family households.
This measure offers insight into turnover rates and housing stability for renters living with others, whether as families or roommates.
Share of Multi-Person Renter Households That Have Moved in Previous 2 Years
Source: American Community Survey, Public Use Microdata Sample (PUMS). Analysis by Beacon Economics.

The share of renter households that are single person versus multi-person provides insight into how household size and composition have shifted over time.
Demographic Characteristics of Santa Barbara County Renter Households.
Source: American Community Survey Public Use Microdata Sample (PUMS) Analysis by Beacon Economics.
Real median pre-tax income of renter households, measured in 2023 dollars, reflects how renter incomes have changed in purchasing power over time.
Comparing the county to the U.S. highlights how local renter income levels have evolved relative to the national average.
Real Median Renter Pre-Tax Income ($ 2023, 000s)
Source: Public Use Microdata Sample (PUMS) Analysis by Beacon Economics.
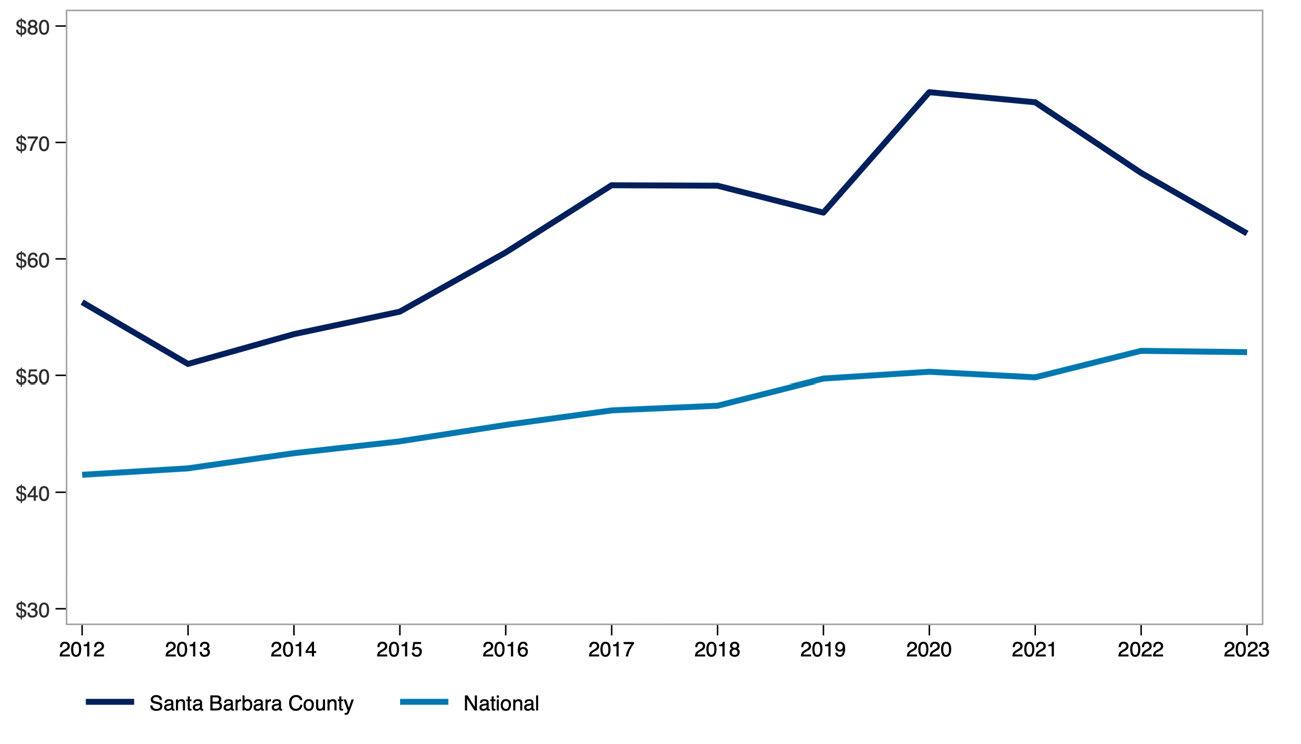
The share of income spent on rent, broken out by renter household type and income level, shows how rent burden varies across the population. This measure compares single-person and multi-person households at the 25th percentile, median, and 75th percentile of the burden distribution, offering insight into how both household size affects housing affordability.
Monthly renter household income before and after rent adjusted for inflation, highlights how much income renters have overall and how much remains after covering housing costs. Presented at the 25th percentile, median, and 75th percentile, this measure provides a view of post-rent income across different points in the income distribution.
Real Monthly Pre/Post-Rent Income for Renter Households in Santa Barbara County
Source: Public Use Microdata Sample (PUMS). US Bureau of Economic Analysis. Analysis by Beacon Economics. Data are in $ 2023.
STATE OF THE STOCK: COUNTY OF SANTA BARBARA
The share of renter-occupied housing units by the year the building was built offers insight into the age of the rental housing stock across the county, California, and the United States.
This measure helps illustrate how recently or how long ago rental units were added to each region’s housing supply.
Renter Occupied Housing by Year Built, Santa Barbara County
Source: 2023 American Community Survey. Analysis by Beacon Economics.
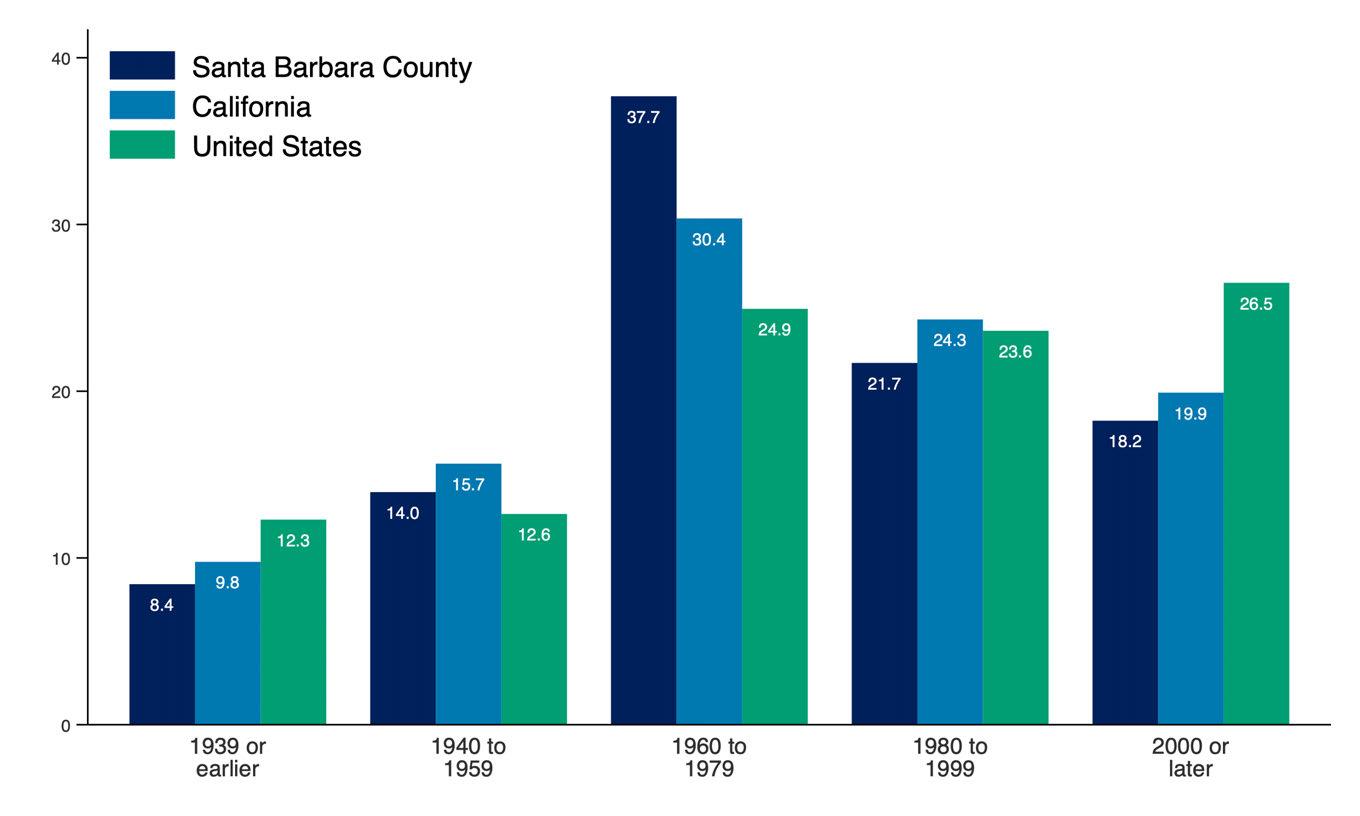
Producer Price Index (PPI) trends for goods and services used in multifamily residential construction reflect how input costs have changed over time. These trends influence the cost and feasibility of developing new rental housing. A broader commodity index is also included to show how construction-specific price movements compare to price trends across all industries.
Producer Price Index by Commodity, United States
Source: U.S. Bureau of Labor Statistics. Analysis by Beacon Economics.
Net Inputs to Multifamily
Residential Construction: Goods, Less Food and Energy
Net Inputs to Multifamily
Residential Construction: Services
All Commodities
Net Inputs to Multifamily
Residential Construction, Excluding Capital Investment, Labor, and Imports
The State of Renters in Santa Clara County
Renter incomes in Santa Clara County have grown significantly. Even after adjusting for inflation and subtracting rent, household income has increased by 53.8% over the past decade compared to 21.4% for renters nationwide.
Household composition is shifting as well. The share of single-person renter households in Santa Clara County has increased by 3.3 percentage points over the past decade, reflecting a broader trend toward smaller household sizes.
Rent burden has remained stable overall. For all renters, the median share of income spent on rent has held steady over the past decade. Among multi-person renter households, rent burden has declined from 26.3% in 2013 to 23.3% in 2023 pointing to modest improvements in affordability for shared households.
STATE OF THE MARKET: COUNTY OF SANTA CLARA
Asking rent represents the price landlords list for vacant units, rather than what current tenants are paying. When adjusted for inflation, it provides insight into how advertised rents have changed in real terms.
The year-over-year rent growth rate captures the pace at which rents are rising or falling. Together, these measures reflect both the level and volatility of rental prices over time.
Real Asking Rents for Apartments in Santa Clara County ($ Q4-2024)
Source: US Bureau of Labor Statistics. Moody's Analytics. Analysis by Beacon Economics.
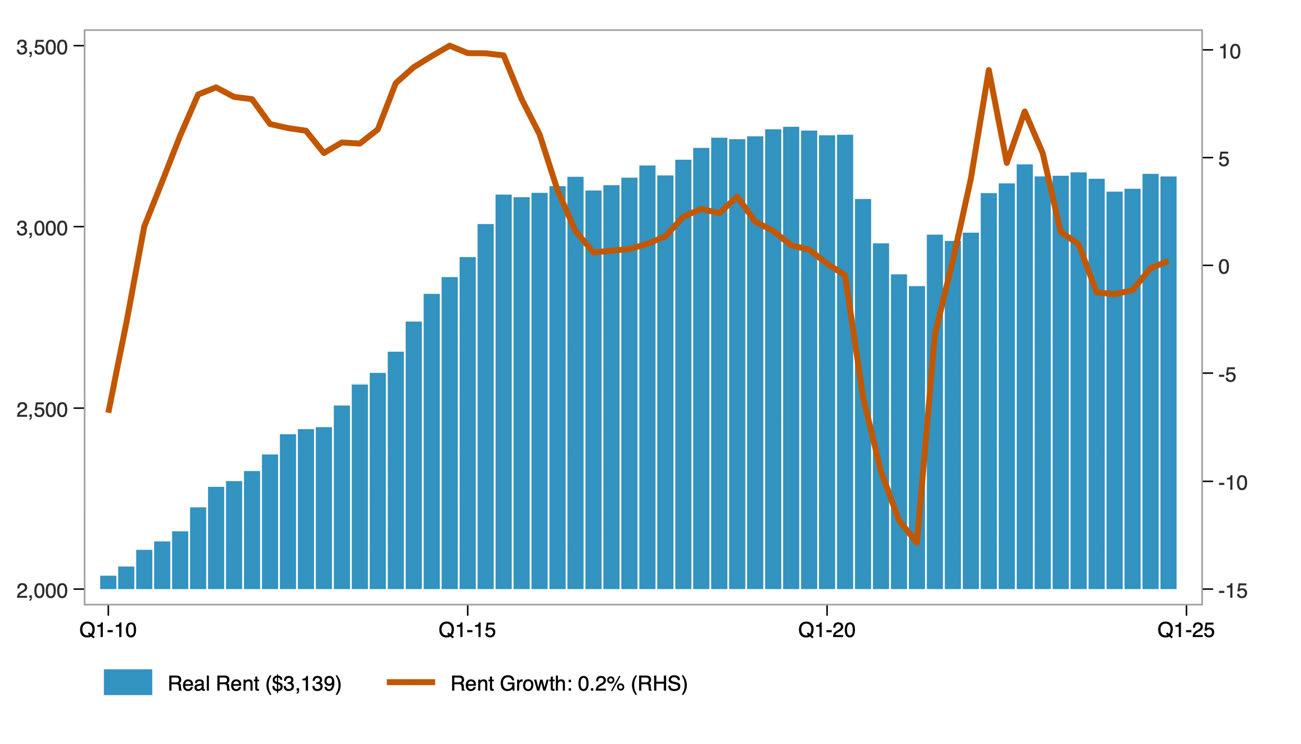
The distribution of real asking rents in the county, adjusted for inflation, shows how advertised rental prices have changed across the market over time. The 25th percentile reflects lower-cost rentals, the median represents the typical rental, and the 75th percentile indicates higher-cost rentals. Together, these measures illustrate how asking rents have changed at multiple price points, not just on average, over the past decade.
Distribution of Real Asking Rents in Santa Clara County
Source: Public Use Microdata Sample (PUMS). US Bureau of Economic Analysis. Analysis by Beacon Economics. Analysis by Beacon Economics. Data are in $ 2023.
The distribution of real contract rents in the county, adjusted for inflation, shows how actual rents paid by tenants have changed across the market over the past decade. Unlike asking rents, contract rents reflect what households are currently paying, offering insight into renters’ real housing costs over time.
Distribution of Real Contract Rents in Santa Clara County
Source: Public Use Microdata Sample (PUMS). US Bureau of Economic Analysis. Analysis by Beacon Economics. Data are in $ 2023.
The apartment vacancy rate measures the share of rental units that are unoccupied and available for rent at a given time.
Vacancy Rate for Apartments in Santa Clara County
Source: Moody's Analytics. Analysis by Beacon Economics.
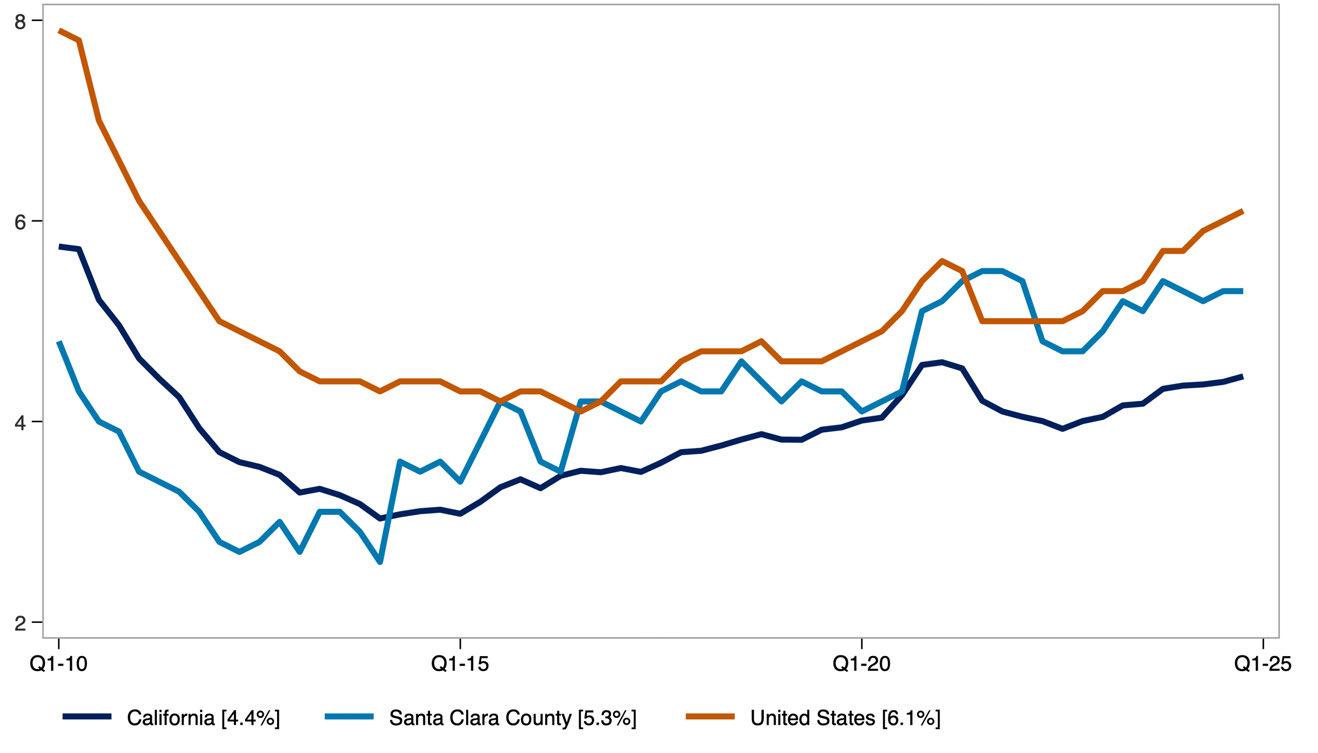
It serves as an indicator of the balance between rental housing supply and demand. Lower vacancy rates typically point to tighter market conditions, while higher rates suggest greater availability.
STATE OF RENTERS: COUNTY OF SANTA CLARA
Key demographic and socioeconomic characteristics of renter households include household size, poverty status, income distribution, language access, and household composition. Together, these indicators offer a snapshot of how renter households are structured and how those characteristics have shifted over time. The data combine absolute figures, such as the number of renter households, with percentages that reflect household traits, such as the share with children or seniors.
Demographic Characteristics of Santa Clara County Renter Households.
Source: American Community Survey Public Use Microdata Sample (PUMS) Analysis by Beacon Economics.
The share of single-person renter households who moved into their current home within the past two years reflects residential mobility among renters living alone.
This measure helps illustrate turnover in the rental market and may indicate trends in housing availability and economic stability for solo renters.
Share of Single-Person Renter Households That Have Moved in Previous 2 Years
Source: American Community Survey, Public Use Microdata Sample (PUMS). Analysis by Beacon Economics.

The share of multi-person renter households who moved within the past two years reflects residential mobility among shared or family households.
This measure offers insight into turnover rates and housing stability for renters living with others, whether as families or roommates.
Share of Multi-Person Renter Households That Have Moved in Previous 2 Years
Source: American Community Survey, Public Use Microdata Sample (PUMS). Analysis by Beacon Economics.
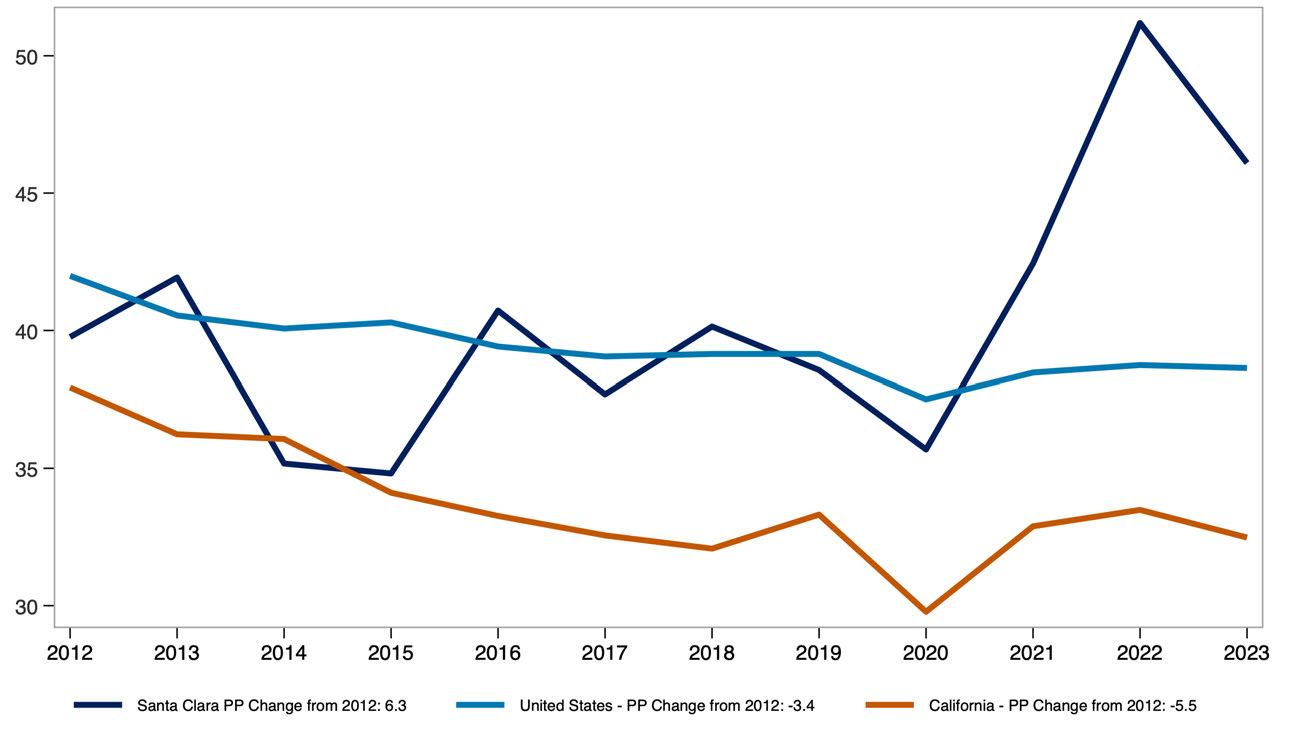
The share of renter households that are single person versus multi-person provides insight into how household size and composition have shifted over time.
Demographic Characteristics of Santa Clara County Renter Households.
Source: American Community Survey Public Use Microdata Sample (PUMS) Analysis by Beacon Economics.
Real median pre-tax income of renter households, measured in 2023 dollars, reflects how renter incomes have changed in purchasing power over time.
Comparing the county to the U.S. highlights how local renter income levels have evolved relative to the national average.
Real Median Renter Pre-Tax Income ($ 2023, 000s)
Source: Public Use Microdata Sample (PUMS) Analysis by Beacon Economics.
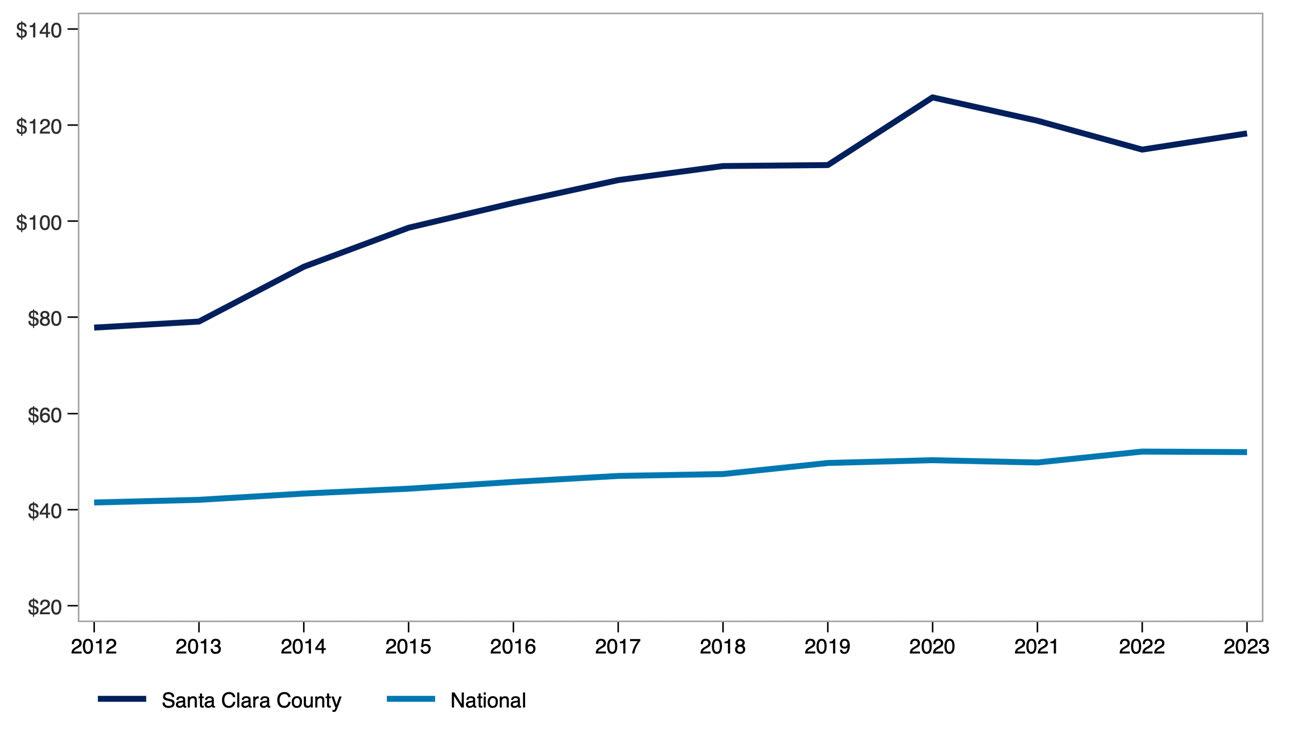
The share of income spent on rent, broken out by renter household type and income level, shows how rent burden varies across the population. This measure compares single-person and multi-person households at the 25th percentile, median, and 75th percentile of the burden distribution, offering insight into how both household size affects housing affordability.
Monthly renter household income before and after rent adjusted for inflation, highlights how much income renters have overall and how much remains after covering housing costs. Presented at the 25th percentile, median, and 75th percentile, this measure provides a view of post-rent income across different points in the income distribution.
Real Monthly Pre/Post-Rent Income for Renter Households in Santa Clara County
Source: Public Use Microdata Sample (PUMS). US Bureau of Economic Analysis. Analysis by Beacon Economics. Data are in $ 2023.
STATE OF THE STOCK: COUNTY OF SANTA CLARA
The share of renter-occupied housing units by the year the building was built offers insight into the age of the rental housing stock across the county, California, and the United States. This measure helps illustrate how recently or how long ago rental units were added to each region’s housing supply.
Renter Occupied Housing by Year Built, Santa Clara County
Source: 2023 American Community Survey. Analysis by Beacon Economics.
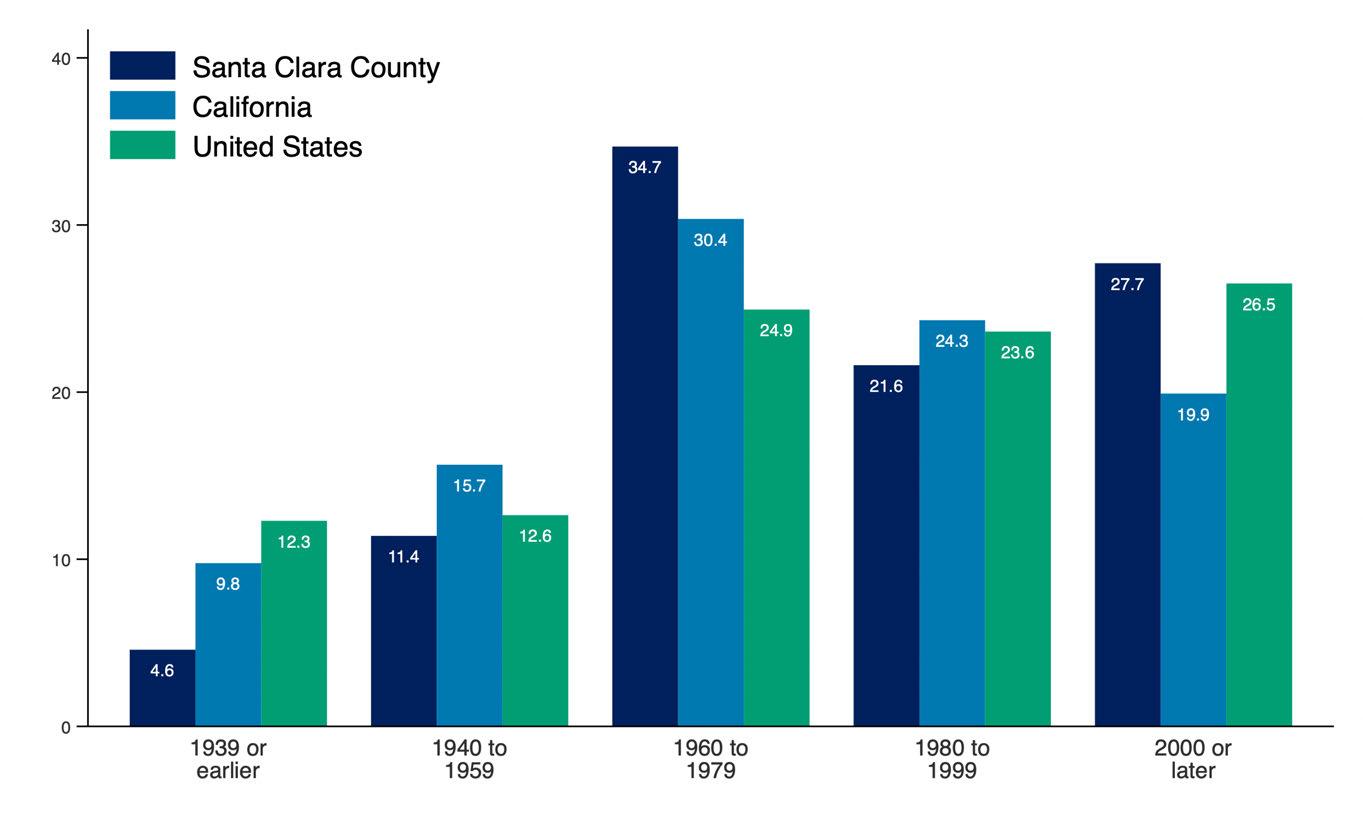
Producer Price Index (PPI) trends for goods and services used in multifamily residential construction reflect how input costs have changed over time. These trends influence the cost and feasibility of developing new rental housing. A broader commodity index is also included to show how construction-specific price movements compare to price trends across all industries.
Producer Price Index by Commodity, United States
Source: U.S. Bureau of Labor Statistics. Analysis by Beacon Economics.
Net Inputs to Multifamily
Residential Construction: Goods, Less Food and Energy
Net Inputs to Multifamily
Residential Construction: Services
All Commodities
Net Inputs to Multifamily
Residential Construction, Excluding Capital Investment, Labor, and Imports
The State of Renters in Solano County
Renter incomes in Solano County have grown significantly. Even after adjusting for inflation and subtracting rent, household income has increased by 31.5% over the past decade compared to 21.4% for renters nationwide.
Household composition is shifting as well. The share of single-person renter households in Solano County has decreased by 0.9 percentage points over the past decade, reflecting a broader trend toward larger household sizes.
Rent burden has remained stable overall. For all renters, the median share of income spent on rent has held steady over the past decade. Among multi-person renter households, rent burden has declined from 29.4% in 2013 to 28.1% in 2023 pointing to modest improvements in affordability for shared households.
STATE OF THE MARKET: COUNTY OF SOLANO
Asking rent represents the price landlords list for vacant units, rather than what current tenants are paying. When adjusted for inflation, it provides insight into how advertised rents have changed in real terms.
The year-over-year rent growth rate captures the pace at which rents are rising or falling. Together, these measures reflect both the level and volatility of rental prices over time.
Real Asking Rents for Apartments in Solano County ($ Q4-2024)
Source: US Bureau of Labor Statistics. Moody's Analytics. Analysis by Beacon Economics.
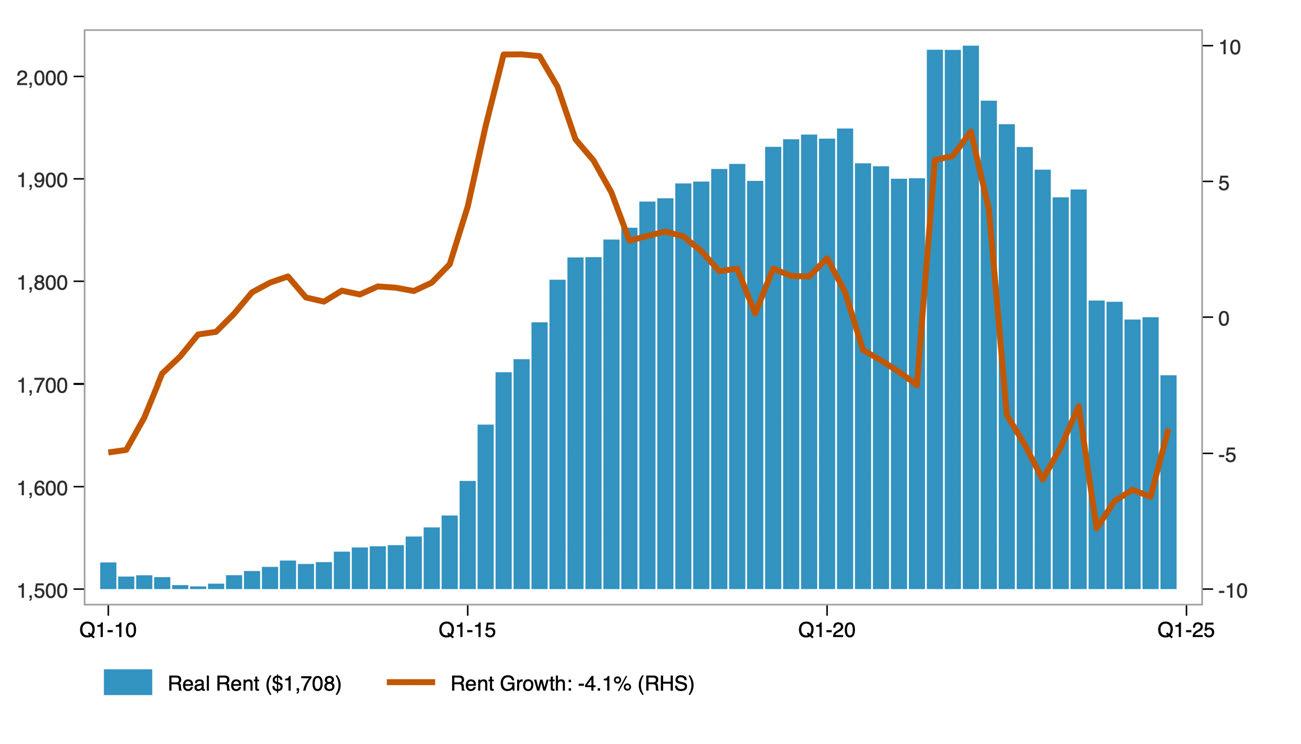
The distribution of real asking rents in the county, adjusted for inflation, shows how advertised rental prices have changed across the market over time. The 25th percentile reflects lower-cost rentals, the median represents the typical rental, and the 75th percentile indicates higher-cost rentals. Together, these measures illustrate how asking rents have changed at multiple price points, not just on average, over the past decade.
Distribution of Real Asking Rents in Solano County
Source: Public Use Microdata Sample (PUMS). US Bureau of Economic Analysis. Analysis by Beacon Economics. Data are in $ 2023.
The distribution of real contract rents in the county, adjusted for inflation, shows how actual rents paid by tenants have changed across the market over the past decade. Unlike asking rents, contract rents reflect what households are currently paying, offering insight into renters’ real housing costs over time.
Distribution of Real Contract Rents in Solano County
Source: Public Use Microdata Sample (PUMS). US Bureau of Economic Analysis. Analysis by Beacon Economics. Data are in $ 2023.
The apartment vacancy rate measures the share of rental units that are unoccupied and available for rent at a given time.
Vacancy Rate for Apartments in Solano County
Source: Moody's Analytics. Analysis by Beacon Economics.
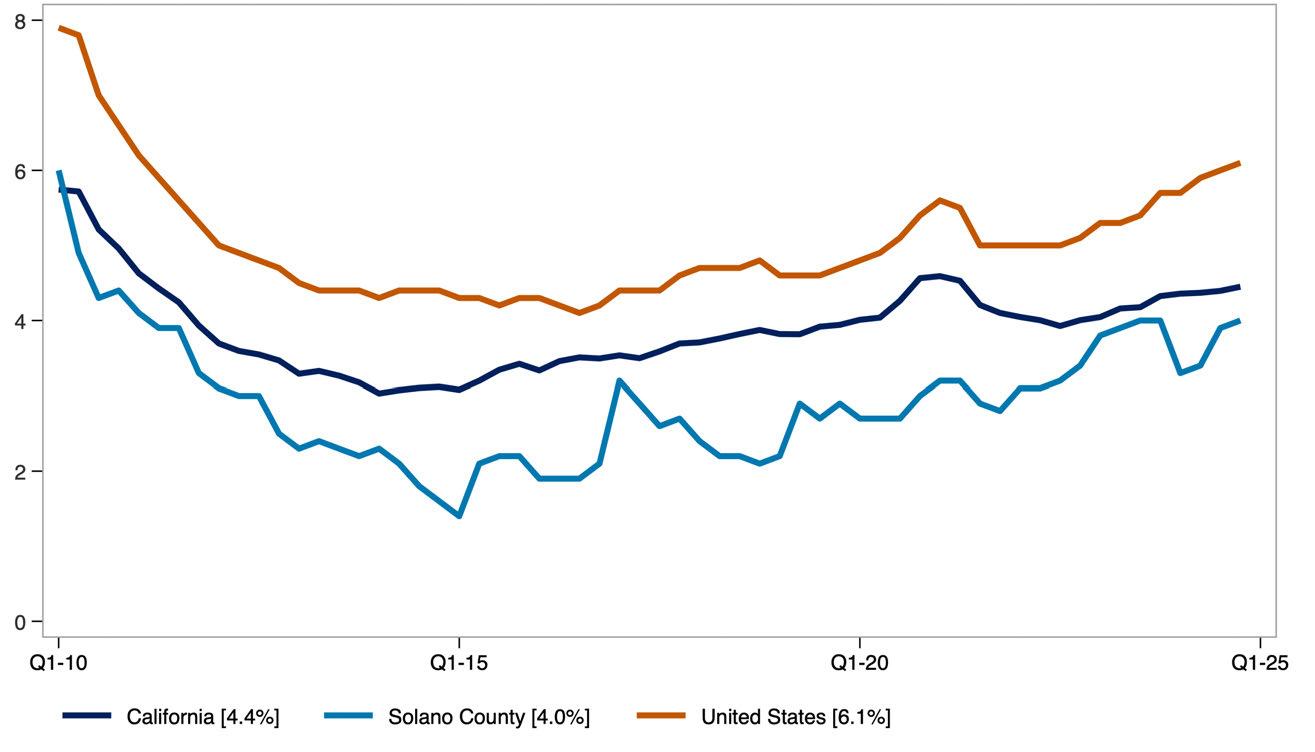
It serves as an indicator of the balance between rental housing supply and demand. Lower vacancy rates typically point to tighter market conditions, while higher rates suggest greater availability.
STATE OF RENTERS: COUNTY OF SOLANO
Key demographic and socioeconomic characteristics of renter households include household size, poverty status, income distribution, language access, and household composition. Together, these indicators offer a snapshot of how renter households are structured and how those characteristics have shifted over time. The data combine absolute figures, such as the number of renter households, with percentages that reflect household traits, such as the share with children or seniors.
Demographic Characteristics of Solano County Renter Households.
Source: American Community Survey Public Use Microdata Sample (PUMS) Analysis by Beacon Economics.
The share of single-person renter households who moved into their current home within the past two years reflects residential mobility among renters living alone.
This measure helps illustrate turnover in the rental market and may indicate trends in housing availability and economic stability for solo renters.
Share of Single-Person Renter Households That Have Moved in Previous 2 Years
Source: American Community Survey, Public Use Microdata Sample (PUMS). Analysis by Beacon Economics.
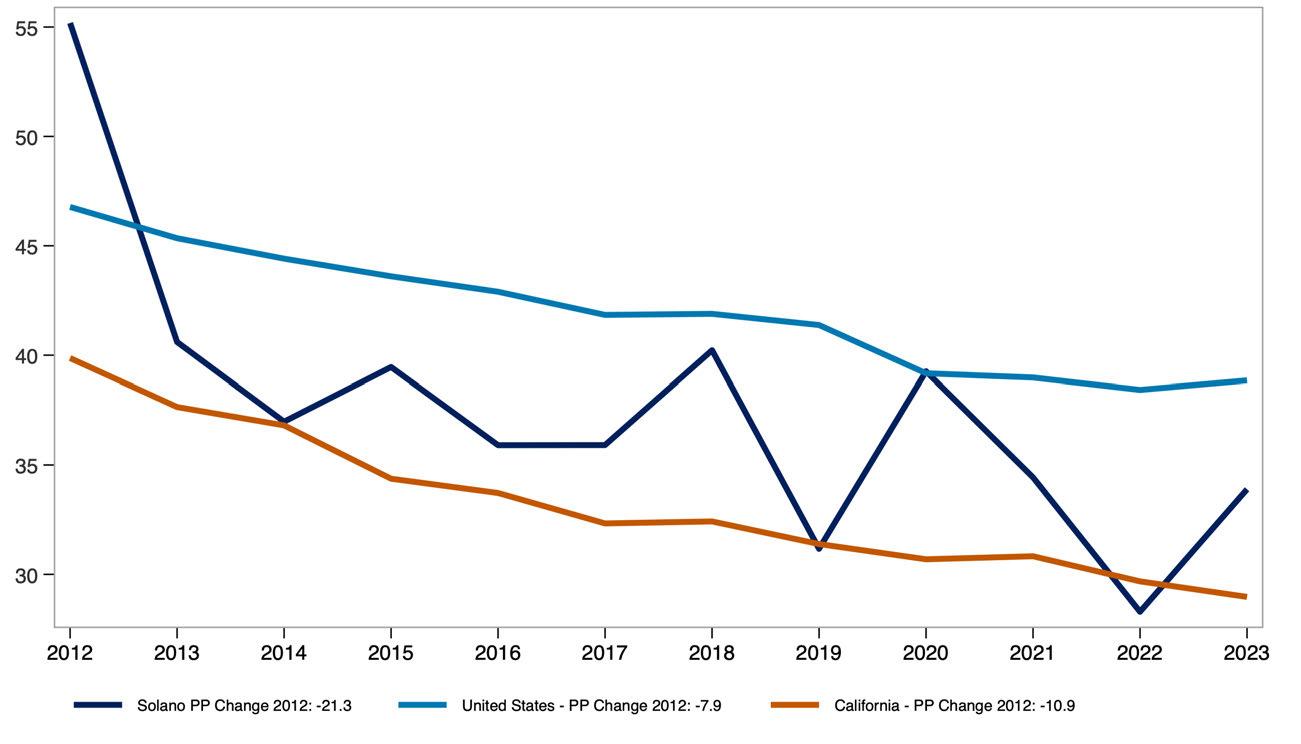
The share of multi-person renter households who moved within the past two years reflects residential mobility among shared or family households.
This measure offers insight into turnover rates and housing stability for renters living with others, whether as families or roommates.
Share of Multi-Person Renter Households That Have Moved in Previous 2 Years
Source: American Community Survey, Public Use Microdata Sample (PUMS). Analysis by Beacon Economics.
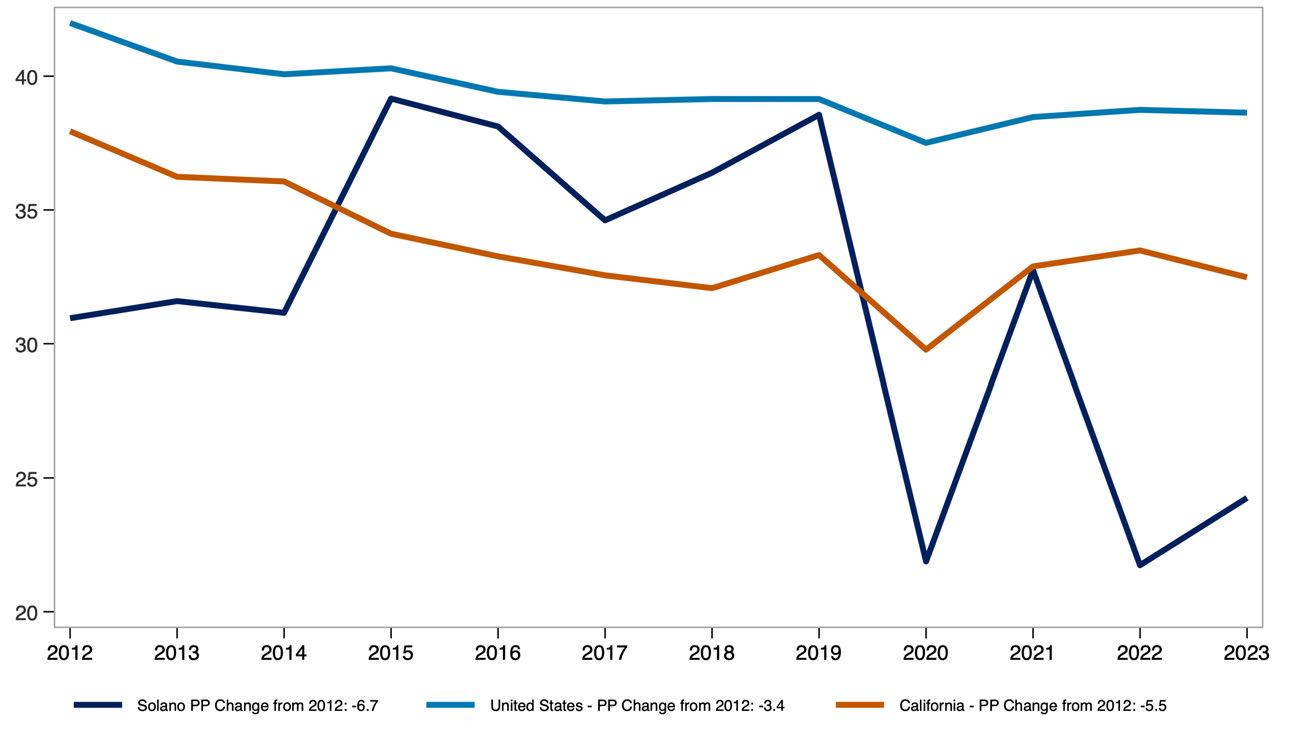
The share of renter households that are single person versus multi-person provides insight into how household size and composition have shifted over time.
Demographic Characteristics of
County Renter Households.
Source: American Community Survey Public Use Microdata Sample (PUMS) Analysis by Beacon Economics.
Real median pre-tax income of renter households, measured in 2023 dollars, reflects how renter incomes have changed in purchasing power over time.
Comparing the county to the U.S. highlights how local renter income levels have evolved relative to the national average.
Real Median Renter Pre-Tax Income ($ 2023, 000s)
Source: Public Use Microdata Sample (PUMS) Analysis by Beacon Economics.
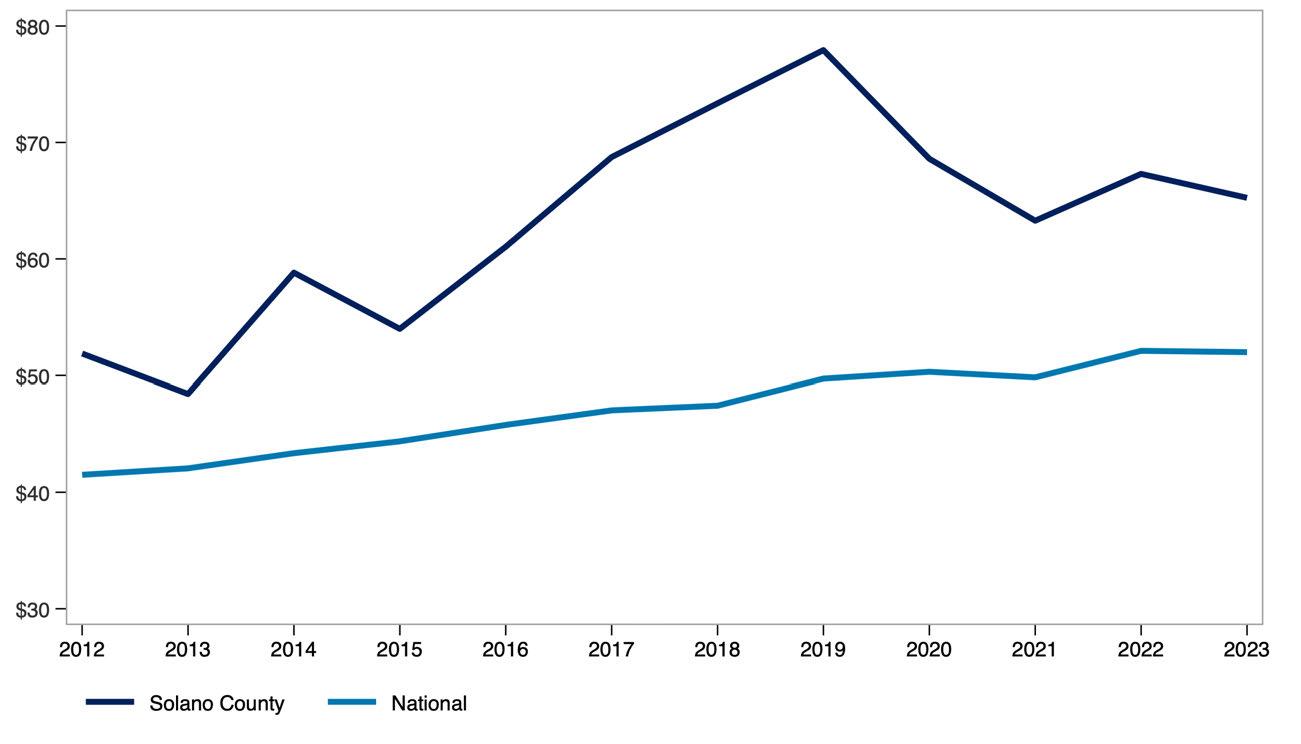
The share of income spent on rent, broken out by renter household type and income level, shows how rent burden varies across the population. This measure compares single-person and multi-person households at the 25th percentile, median, and 75th percentile of the burden distribution, offering insight into how both household size affects housing affordability. Share of Income
Monthly renter household income before and after rent adjusted for inflation, highlights how much income renters have overall and how much remains after covering housing costs. Presented at the 25th percentile, median, and 75th percentile, this measure provides a view of post-rent income across different points in the income distribution.
Real Monthly Pre/Post-Rent Income for Renter Households in Solano County
Source: Public Use Microdata Sample (PUMS). US Bureau of Economic Analysis. Analysis by Beacon Economics. Data are in $ 2023.
STATE OF THE STOCK: COUNTY OF SOLANO
The share of renter-occupied housing units by the year the building was built offers insight into the age of the rental housing stock across the county, California, and the United States.
This measure helps illustrate how recently or how long ago rental units were added to each region’s housing supply.
Renter Occupied Housing by Year Built, Solano County
Source: 2023 American Community Survey. Analysis by Beacon Economics.

Producer Price Index (PPI) trends for goods and services used in multifamily residential construction reflect how input costs have changed over time. These trends influence the cost and feasibility of developing new rental housing. A broader commodity index is also included to show how construction-specific price movements compare to price trends across all industries.
Producer Price Index by Commodity, United States
Source: U.S. Bureau of Labor Statistics. Analysis by Beacon Economics.
Net Inputs to Multifamily
Residential Construction: Goods, Less Food and Energy
Net Inputs to Multifamily
Residential Construction: Services
All Commodities
Net Inputs to Multifamily
Residential Construction, Excluding Capital Investment, Labor, and Imports
The State of Renters in Sonoma County
Renter incomes in Sonoma County have grown significantly. Even after adjusting for inflation and subtracting rent, household income has increased by 33.3% over the past decade compared to 21.4% for renters nationwide.
Household composition is shifting as well. The share of single-person renter households in Sonoma County has increased by 2.4 percentage points over the past decade, reflecting a broader trend toward smaller household sizes.
Rent burden has remained stable overall. For all renters, the median share of income spent on rent has held steady over the past decade. Among multi-person renter households, rent burden has increased slightly—from 26.8% in 2013 to 27.2% in 2023.
STATE OF THE MARKET: COUNTY OF SONOMA
Asking rent represents the price landlords list for vacant units, rather than what current tenants are paying. When adjusted for inflation, it provides insight into how advertised rents have changed in real terms
The year-over-year rent growth rate captures the pace at which rents are rising or falling. Together, these measures reflect both the level and volatility of rental prices over time.
Real Asking Rents for Apartments in Sonoma County ($ Q4-2024)
Source: US Bureau of Labor Statistics. Moody's Analytics. Analysis by Beacon Economics.
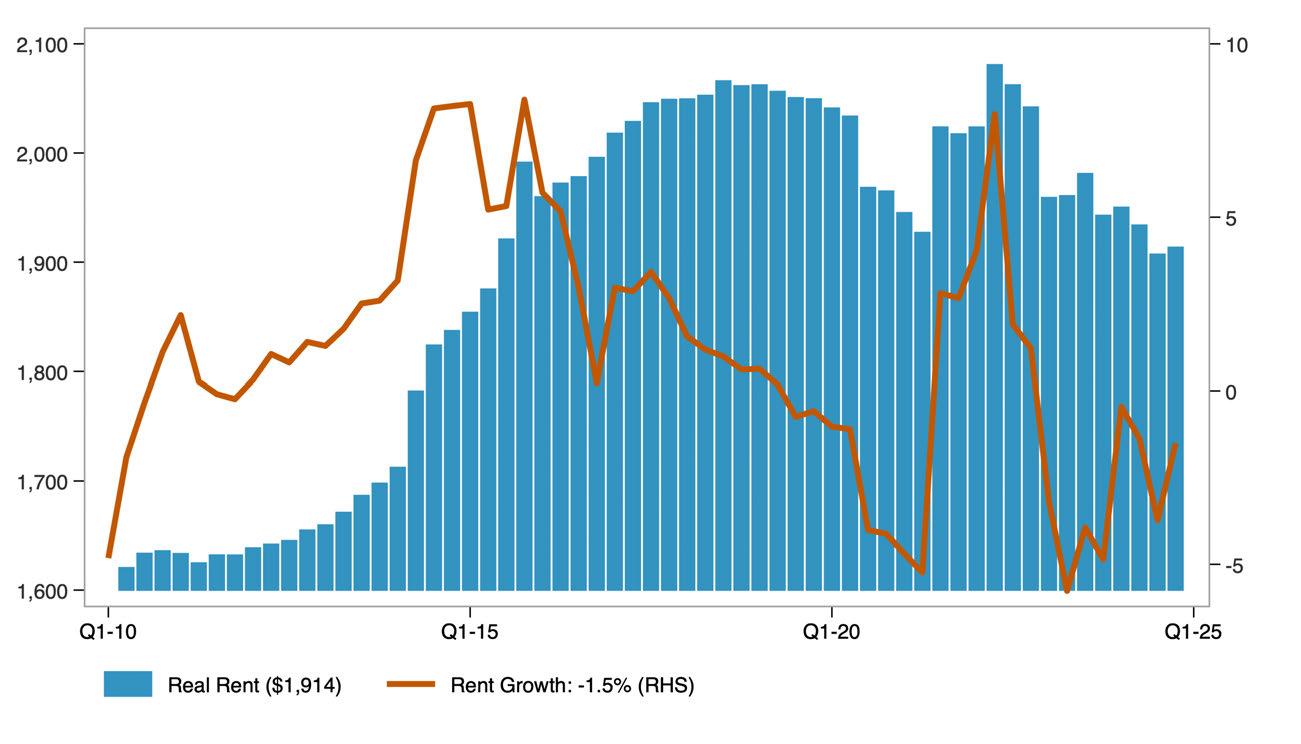
The distribution of real asking rents in the county, adjusted for inflation, shows how advertised rental prices have changed across the market over time. The 25th percentile reflects lower-cost rentals, the median represents the typical rental, and the 75th percentile indicates higher-cost rentals. Together, these measures illustrate how asking rents have changed at multiple price points, not just on average, over the past decade.
Distribution of Real Asking Rents in Sonoma County
Source: Public Use Microdata Sample (PUMS). US Bureau of Economic Analysis. Analysis by Beacon Economics. Data are in $ 2023.
The distribution of real contract rents in the county, adjusted for inflation, shows how actual rents paid by tenants have changed across the market over the past decade. Unlike asking rents, contract rents reflect what households are currently paying, offering insight into renters’ real housing costs over time.
Distribution of Real Contract Rents in Sonoma County
Source: Public Use Microdata Sample (PUMS). US Bureau of Economic Analysis. Analysis by Beacon Economics. Data are in $ 2023.
The apartment vacancy rate measures the share of rental units that are unoccupied and available for rent at a given time.
Vacancy Rate for Apartments in Sonoma County
Source: Moody's Analytics. Analysis by Beacon Economics.

It serves as an indicator of the balance between rental housing supply and demand. Lower vacancy rates typically point to tighter market conditions, while higher rates suggest greater availability.
STATE OF RENTERS: COUNTY OF SONOMA
Key demographic and socioeconomic characteristics of renter households include household size, poverty status, income distribution, language access, and household composition. Together, these indicators offer a snapshot of how renter households are structured and how those characteristics have shifted over time. The data combine absolute figures, such as the number of renter households, with percentages that reflect household traits, such as the share with children or seniors.
Demographic Characteristics of Sonoma County Renter Households.
Source: American Community Survey Public Use Microdata Sample (PUMS) Analysis by Beacon Economics.
The share of single-person renter households who moved into their current home within the past two years reflects residential mobility among renters living alone.
This measure helps illustrate turnover in the rental market and may indicate trends in housing availability and economic stability for solo renters.
Share of Single-Person Renter Households That Have Moved in Previous 2 Years
Source: American Community Survey, Public Use Microdata Sample (PUMS). Analysis by Beacon Economics.
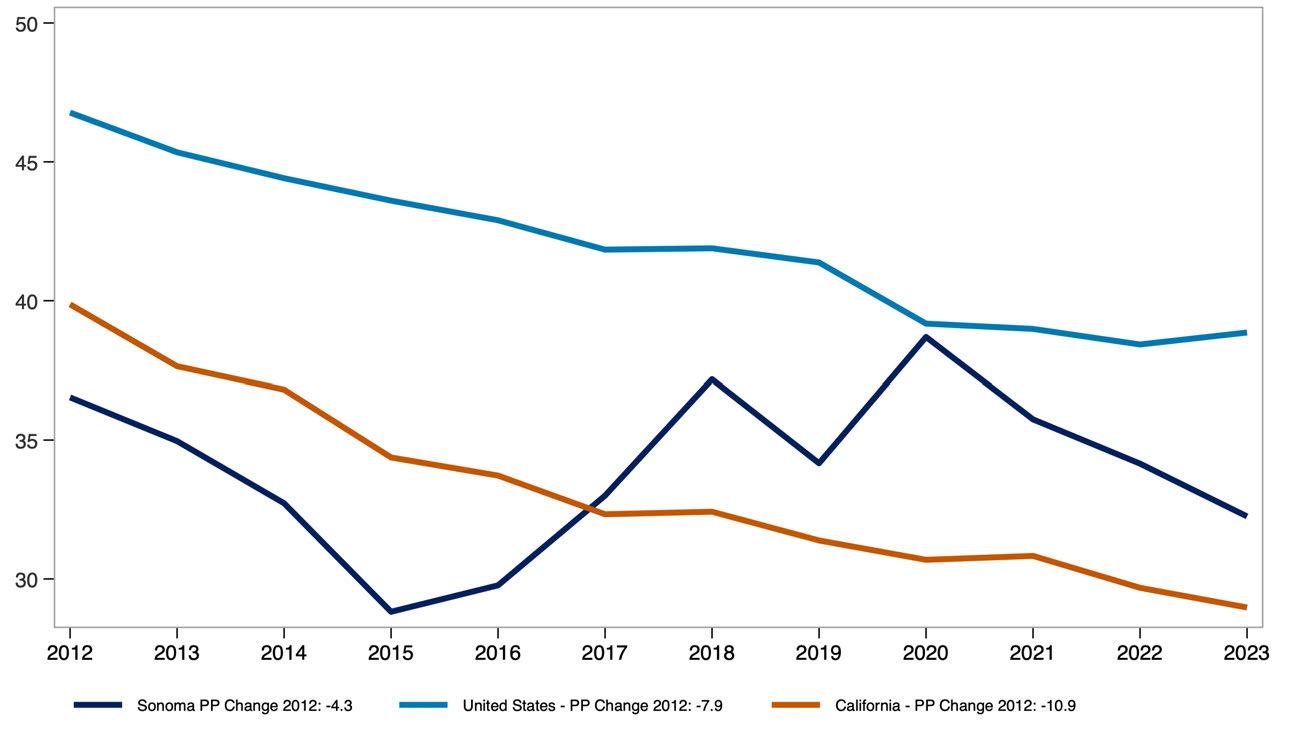
The share of multi-person renter households who moved within the past two years reflects residential mobility among shared or family households.
This measure offers insight into turnover rates and housing stability for renters living with others, whether as families or roommates.
Share of Multi-Person Renter Households That Have Moved in Previous 2 Years
Source: American Community Survey, Public Use Microdata Sample (PUMS). Analysis by Beacon Economics.
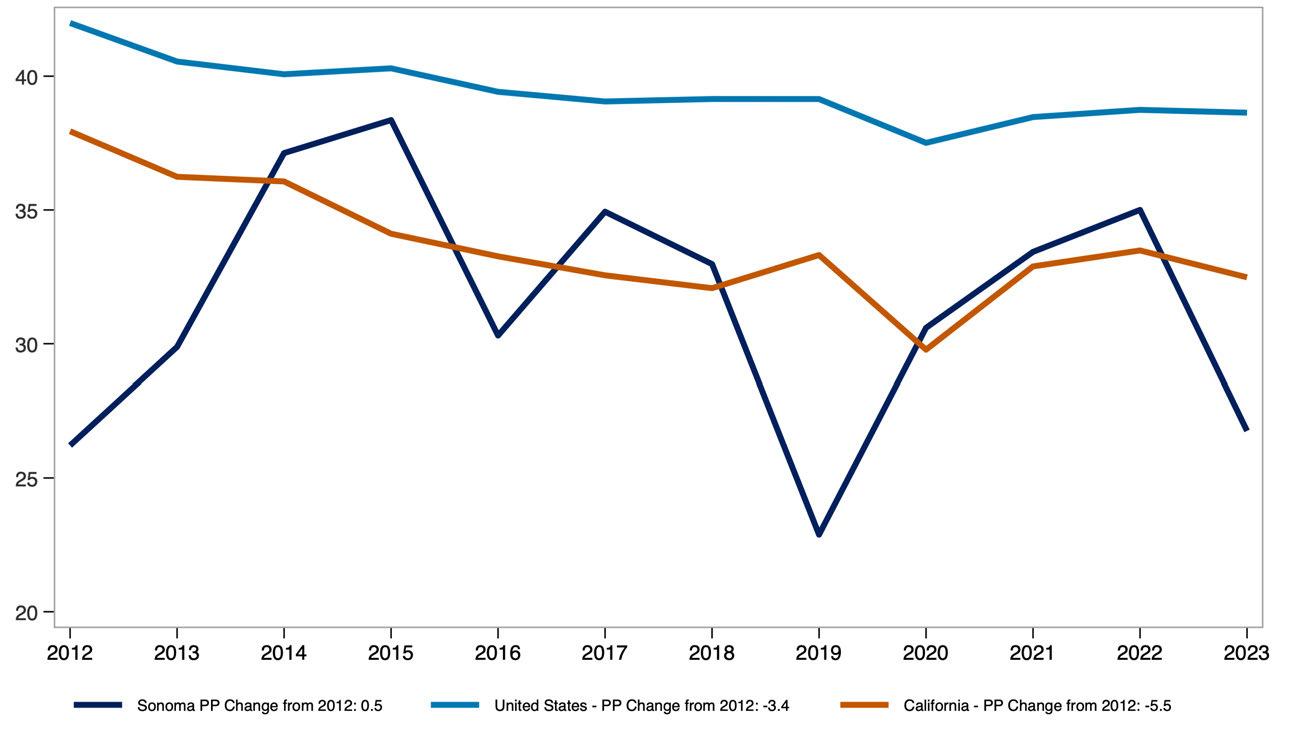
The share of renter households that are single person versus multi-person provides insight into how household size and composition have shifted over time.
Source: American Community Survey Public Use Microdata Sample (PUMS) Analysis by Beacon Economics.
Real median pre-tax income of renter households, measured in 2023 dollars, reflects how renter incomes have changed in purchasing power over time.
Comparing the county to the U.S. highlights how local renter income levels have evolved relative to the national average.
Real Median Renter Pre-Tax Income ($ 2023, 000s)
Source: Public Use Microdata Sample (PUMS) Analysis by Beacon Economics.
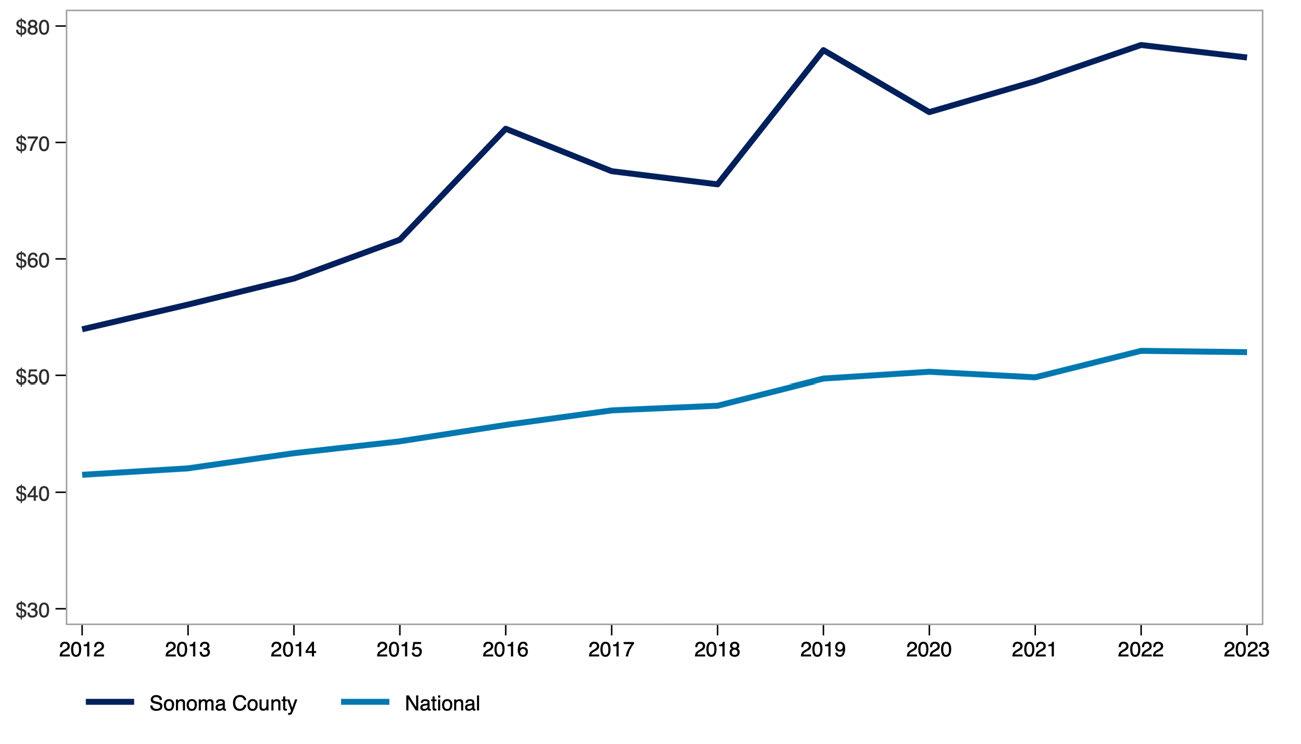
The share of income spent on rent, broken out by renter household type and income level, shows how rent burden varies across the population. This measure compares single-person and multi-person households at the 25th percentile, median, and 75th percentile of the burden distribution, offering insight into how both household size affects housing affordability.
Monthly renter household income before and after rent adjusted for inflation, highlights how much income renters have overall and how much remains after covering housing costs. Presented at the 25th percentile, median, and 75th percentile, this measure provides a view of post-rent income across different points in the income distribution.
Real Monthly Pre/Post-Rent Income for Renter Households in Sonoma County
Source: Public Use Microdata Sample (PUMS). US Bureau of Economic Analysis. Analysis by Beacon Economics. Data are in $ 2023.
STATE OF THE STOCK: COUNTY OF SONOMA
The share of renter-occupied housing units by the year the building was built offers insight into the age of the rental housing stock across the county, California, and the United States. This measure helps illustrate how recently or how long ago rental units were added to each region’s housing supply.
Renter
Occupied Housing by Year Built, Sonoma County
Source: 2023 American Community Survey. Analysis by Beacon Economics.
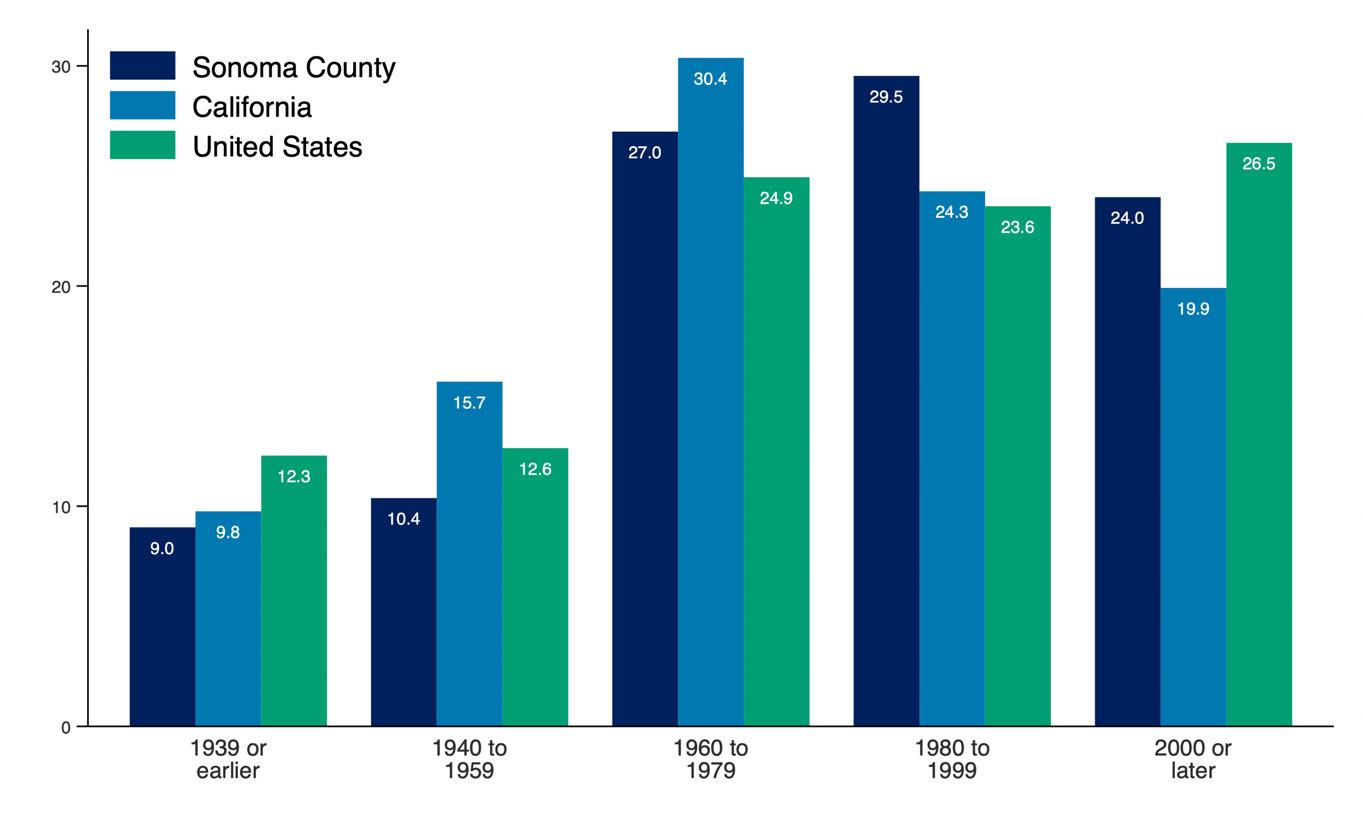
Producer Price Index (PPI) trends for goods and services used in multifamily residential construction reflect how input costs have changed over time. These trends influence the cost and feasibility of developing new rental housing. A broader commodity index is also included to show how construction-specific price movements compare to price trends across all industries.
Producer Price Index by Commodity, United States
Source: U.S. Bureau of Labor Statistics. Analysis by Beacon Economics.
Net Inputs to Multifamily
Residential Construction: Goods, Less Food and Energy
Net Inputs to Multifamily
Residential Construction: Services
All Commodities
Net Inputs to Multifamily
Residential Construction, Excluding Capital Investment, Labor, and Imports
The State of Renters in Stanislaus County
Renter incomes in Stanislaus County have grown significantly. Even after adjusting for inflation and subtracting rent, household income has increased by 74.4% over the past decade compared to 21.4% for renters nationwide.
Household composition is shifting as well. The share of single-person renter households in Stanislaus County has decreased by 1.0 percentage points over the past decade, reflecting a broader trend toward larger household sizes.
Rent burden has remained stable overall. For all renters, the median share of income spent on rent has held steady over the past decade. Among multi-person renter households, rent burden has declined from 27.7% in 2013 to 23.2% in 2023 pointing to modest improvements in affordability for shared households.
STATE OF THE MARKET: COUNTY OF STANISLAUS
Asking rent represents the price landlords list for vacant units, rather than what current tenants are paying. When adjusted for inflation, it provides insight into how advertised rents have changed in real terms.
The year-over-year rent growth rate captures the pace at which rents are rising or falling. Together, these measures reflect both the level and volatility of rental prices over time.
Real Asking Rents for Apartments in Stanislaus County ($ Q4-2024)
Source: US Bureau of Labor Statistics. Moody's Analytics. Analysis by Beacon Economics.
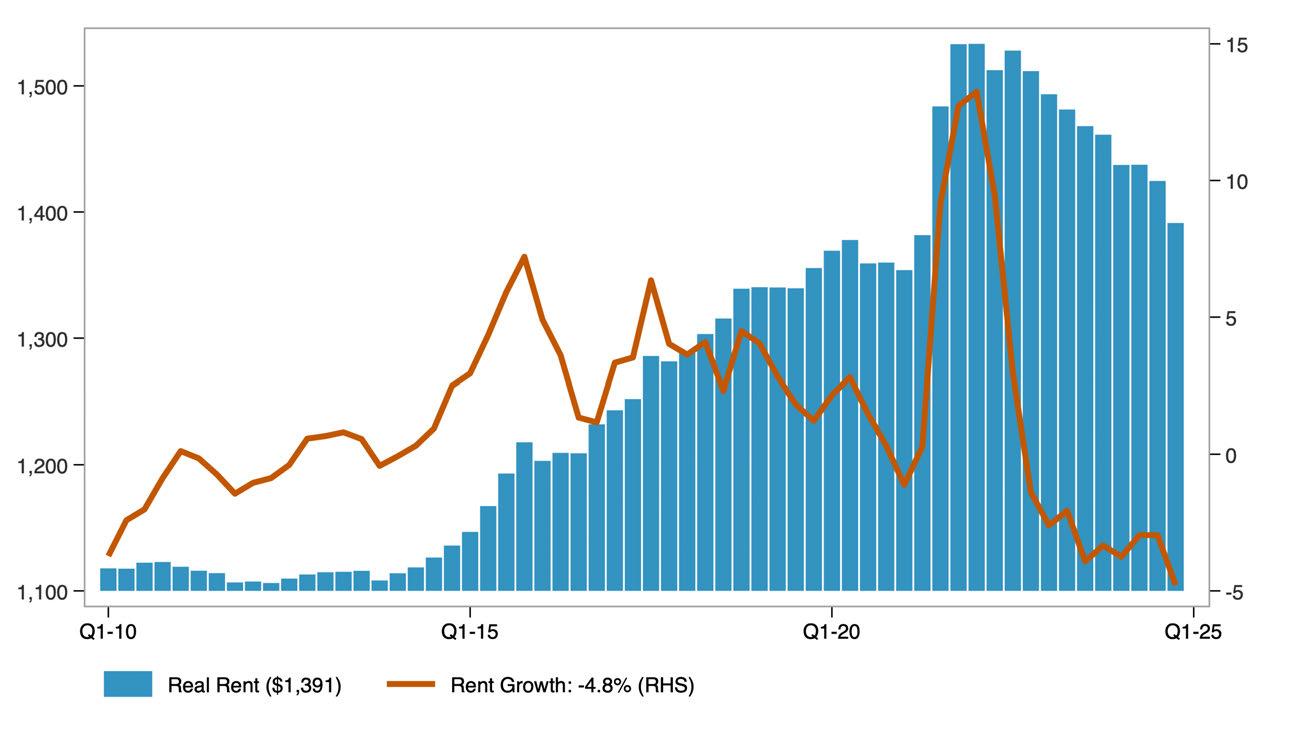
The distribution of real asking rents in the county, adjusted for inflation, shows how advertised rental prices have changed across the market over time. The 25th percentile reflects lower-cost rentals, the median represents the typical rental, and the 75th percentile indicates higher-cost rentals. Together, these measures illustrate how asking rents have changed at multiple price points, not just on average, over the past decade.
Distribution of Real Asking Rents in Stanislaus County
Source: Public Use Microdata Sample (PUMS). US Bureau of Economic Analysis. Analysis by Beacon Economics. Data are in $ 2023.
The distribution of real contract rents in the county, adjusted for inflation, shows how actual rents paid by tenants have changed across the market over the past decade. Unlike asking rents, contract rents reflect what households are currently paying, offering insight into renters’ real housing costs over time.
Distribution of Real Contract Rents in Stanislaus County
Source: Public Use Microdata Sample (PUMS). US Bureau of Economic Analysis. Analysis by Beacon Economics Data are in $ 2023.
The apartment vacancy rate measures the share of rental units that are unoccupied and available for rent at a given time.
Vacancy Rate for Apartments in Stanislaus County
Source: Moody's Analytics. Analysis by Beacon Economics.

It serves as an indicator of the balance between rental housing supply and demand. Lower vacancy rates typically point to tighter market conditions, while higher rates suggest greater availability.
STATE OF RENTERS: COUNTY OF STANISLAUS
Key demographic and socioeconomic characteristics of renter households include household size, poverty status, income distribution, language access, and household composition. Together, these indicators offer a snapshot of how renter households are structured and how those characteristics have shifted over time. The data combine absolute figures, such as the number of renter households, with percentages that reflect household traits, such as the share with children or seniors.
Demographic Characteristics of Stanislaus County Renter Households.
Source: American Community Survey Public Use Microdata Sample (PUMS) Analysis by Beacon Economics.
The share of single-person renter households who moved into their current home within the past two years reflects residential mobility among renters living alone.
This measure helps illustrate turnover in the rental market and may indicate trends in housing availability and economic stability for solo renters.
Share of Single-Person Renter Households That Have Moved in Previous 2 Years
Source: American Community Survey, Public Use Microdata Sample (PUMS). Analysis by Beacon Economics.
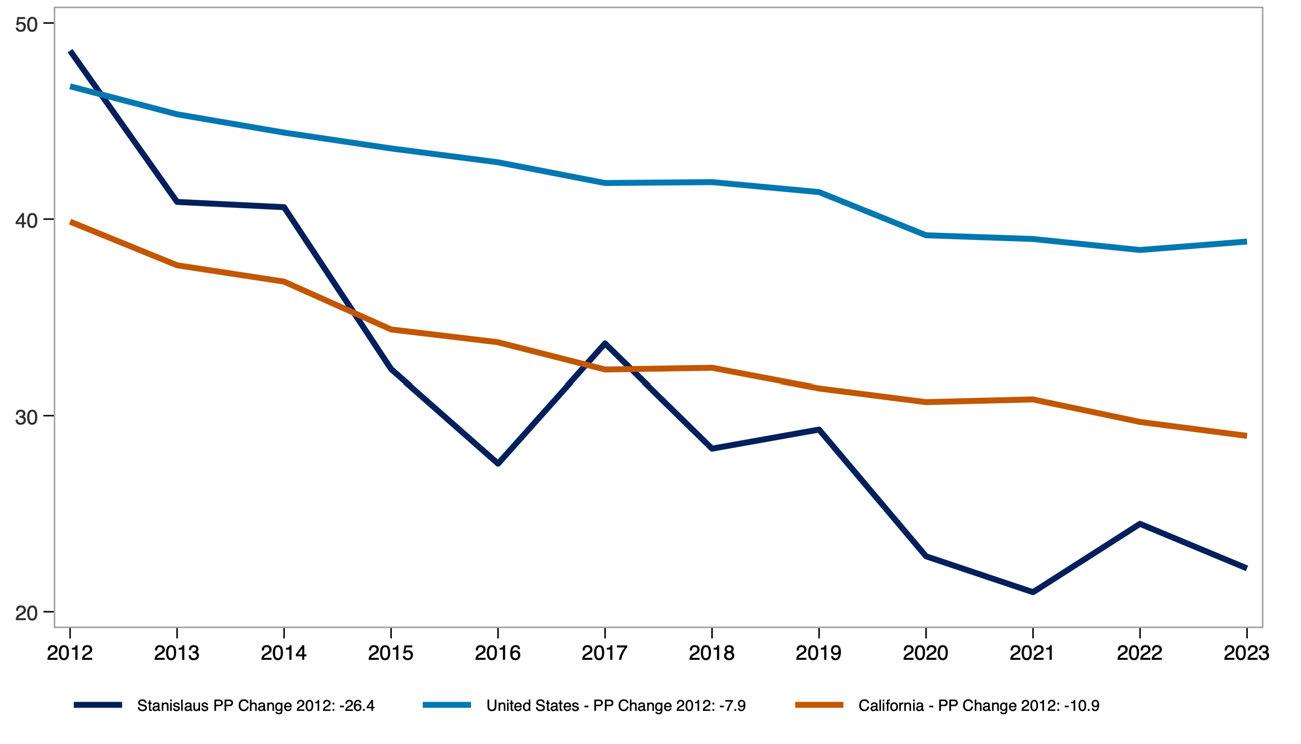
The share of multi-person renter households who moved within the past two years reflects residential mobility among shared or family households.
This measure offers insight into turnover rates and housing stability for renters living with others, whether as families or roommates.
Share of Multi-Person Renter Households That Have Moved in Previous 2 Years
Source: American Community Survey, Public Use Microdata Sample (PUMS). Analysis by Beacon Economics.
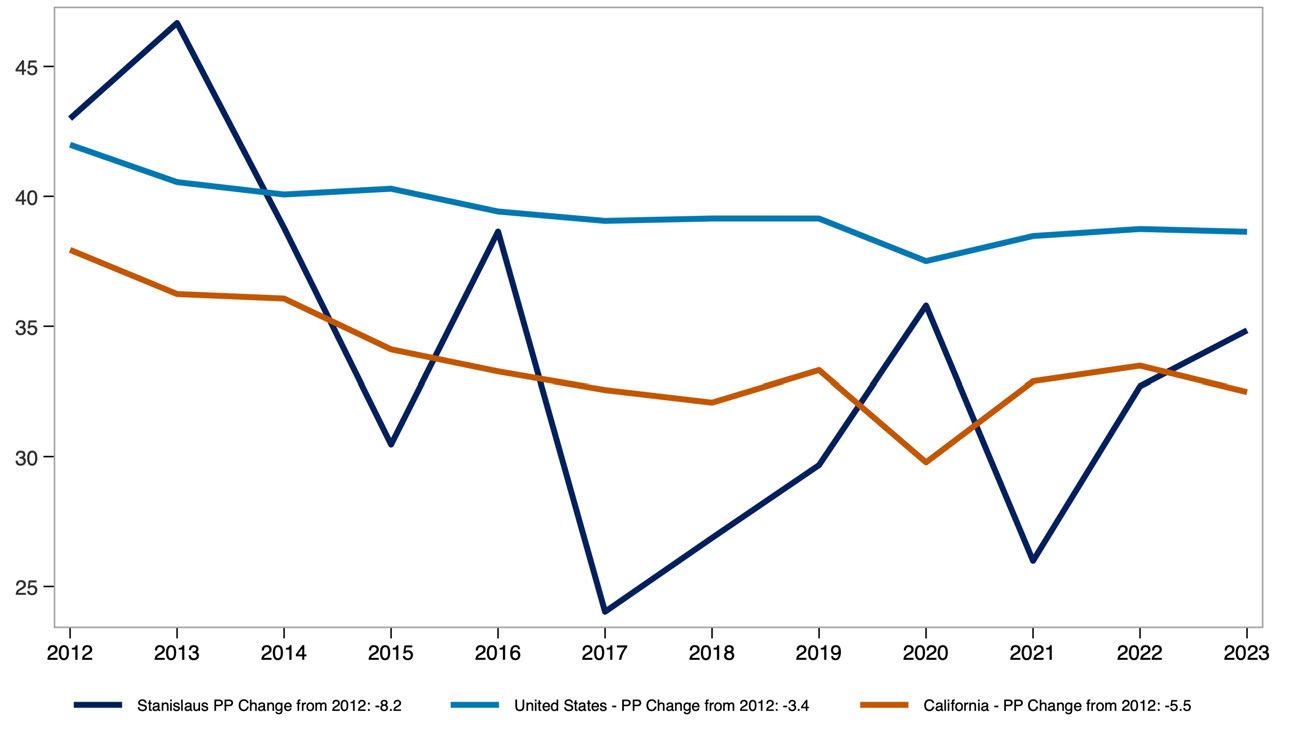
The share of renter households that are single person versus multi-person provides insight into how household size and composition have shifted over time.
Source: American Community Survey Public Use Microdata Sample (PUMS) Analysis by Beacon Economics.
Real median pre-tax income of renter households, measured in 2023 dollars, reflects how renter incomes have changed in purchasing power over time.
Comparing the county to the U.S. highlights how local renter income levels have evolved relative to the national average.
Real Median Renter Pre-Tax Income ($ 2023, 000s)
Source: Public Use Microdata Sample (PUMS) Analysis by Beacon Economics.
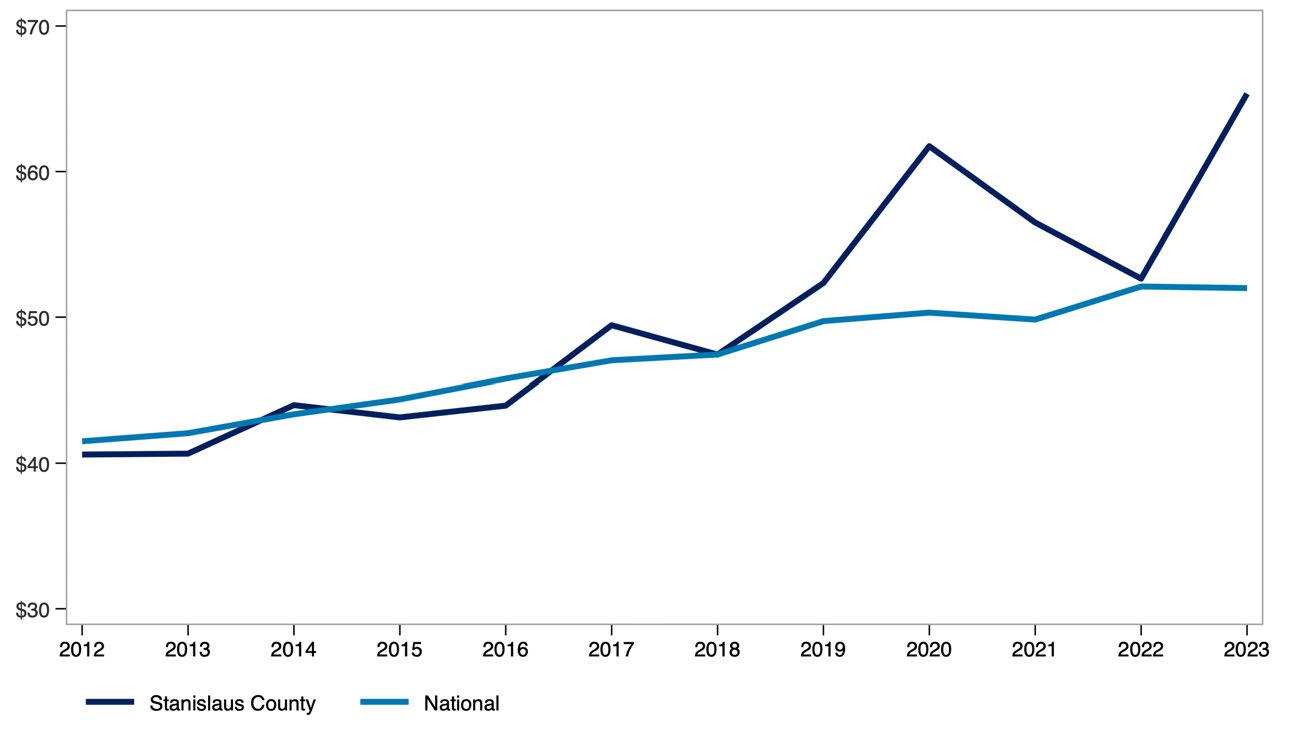
The share of income spent on rent, broken out by renter household type and income level, shows how rent burden varies across the population. This measure compares single-person and multi-person households at the 25th percentile, median, and 75th percentile of the burden distribution, offering insight into how both household size affects housing affordability.
Monthly renter household income before and after rent adjusted for inflation, highlights how much income renters have overall and how much remains after covering housing costs. Presented at the 25th percentile, median, and 75th percentile, this measure provides a view of post-rent income across different points in the income distribution.
Real Monthly Pre/Post-Rent Income for Renter Households in Stanislaus County
Source: Public Use Microdata Sample (PUMS). US Bureau of Economic Analysis. Analysis by Beacon Economics. Data are in $ 2023.
STATE OF THE STOCK: COUNTY OF STANISLAUS
The share of renter-occupied housing units by the year the building was built offers insight into the age of the rental housing stock across the county, California, and the United States. This measure helps illustrate how recently or how long ago rental units were added to each region’s housing supply.
Renter Occupied Housing by Year Built, Stanislaus County
Source: 2023 American Community Survey. Analysis by Beacon Economics.

Producer Price Index (PPI) trends for goods and services used in multifamily residential construction reflect how input costs have changed over time. These trends influence the cost and feasibility of developing new rental housing. A broader commodity index is also included to show how construction-specific price movements compare to price trends across all industries.
Producer Price Index by Commodity, United States
Source: U.S. Bureau of Labor Statistics. Analysis by Beacon Economics.
Net Inputs to Multifamily
Residential Construction: Goods, Less Food and Energy
Net Inputs to Multifamily
Residential Construction: Services
All Commodities
Net Inputs to Multifamily
Residential Construction, Excluding Capital Investment, Labor, and Imports
The State of Renters in Tulare County
Renter incomes in Tulare County have grown significantly. Even after adjusting for inflation and subtracting rent, household income has increased by 46.2% over the past decade compared to 21.4% for renters nationwide.
Household composition is shifting as well. The share of single-person renter households in Tulare County has decreased by 0.5 percentage points over the past decade, reflecting a broader trend toward larger household sizes.
Rent burden has remained stable overall. For all renters, the median share of income spent on rent has held steady over the past decade. Among multi-person renter households, rent burden has declined from 26.2% in 2013 to 22.0% in 2023 pointing to modest improvements in affordability for shared households.
STATE OF THE MARKET: COUNTY OF TULARE
Asking rent represents the price landlords list for vacant units, rather than what current tenants are paying. When adjusted for inflation, it provides insight into how advertised rents have changed in real terms.
The year-over-year rent growth rate captures the pace at which rents are rising or falling. Together, these measures reflect both the level and volatility of rental prices over time.
Real Asking Rents for Apartments in Tulare County ($ Q4-2024)
Source: US Bureau of Labor Statistics. Moody's Analytics. Analysis by Beacon Economics.
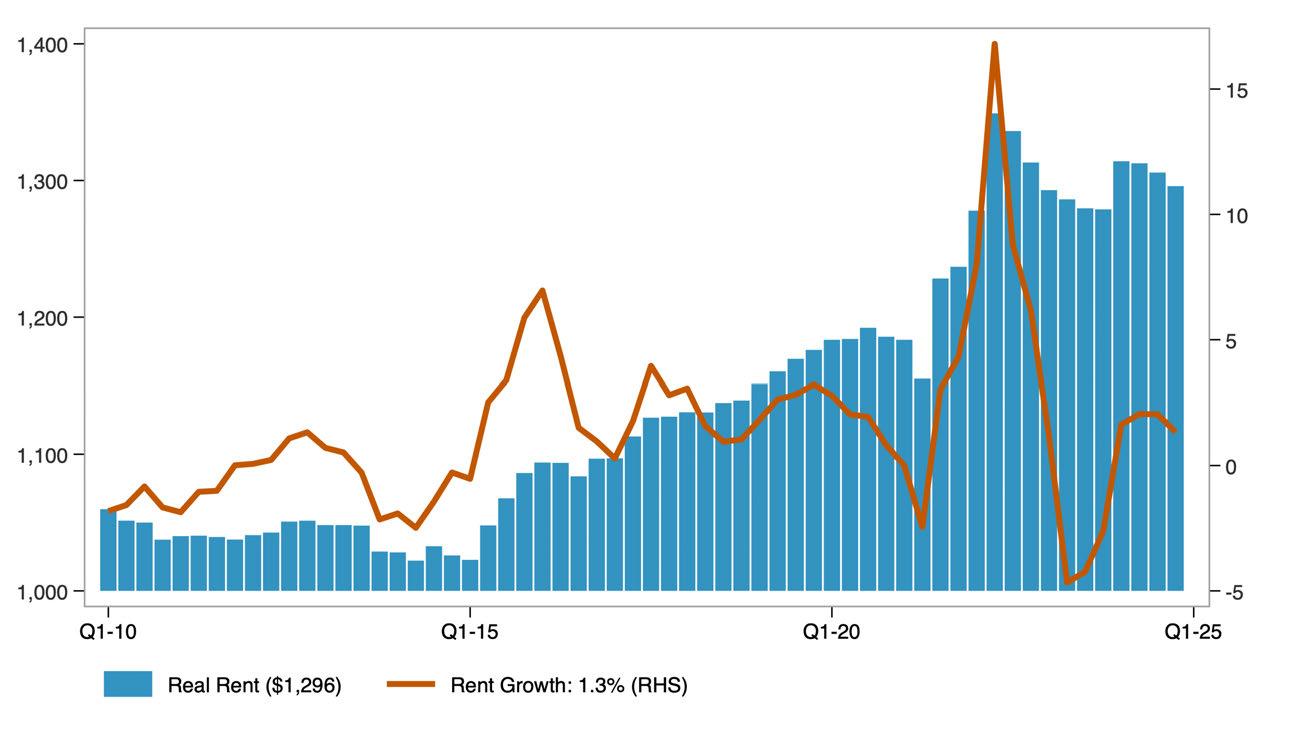
The distribution of real asking rents in the county, adjusted for inflation, shows how advertised rental prices have changed across the market over time. The 25th percentile reflects lower-cost rentals, the median represents the typical rental, and the 75th percentile indicates higher-cost rentals. Together, these measures illustrate how asking rents have changed at multiple price points, not just on average, over the past decade.
Distribution of Real Asking Rents in Tulare County
Source: Public Use Microdata Sample (PUMS). US Bureau of Economic Analysis. Analysis by Beacon Economics. Data are in $ 2023.
The distribution of real contract rents in the county, adjusted for inflation, shows how actual rents paid by tenants have changed across the market over the past decade. Unlike asking rents, contract rents reflect what households are currently paying, offering insight into renters’ real housing costs over time.
Distribution of Real Contract Rents in Tulare County
Source: Public Use Microdata Sample (PUMS). US Bureau of Economic Analysis. Analysis by Beacon Economics. Data are in $ 2023.
The apartment vacancy rate measures the share of rental units that are unoccupied and available for rent at a given time.
Vacancy Rate for Apartments in Tulare County
Source: Moody's Analytics. Analysis by Beacon Economics.
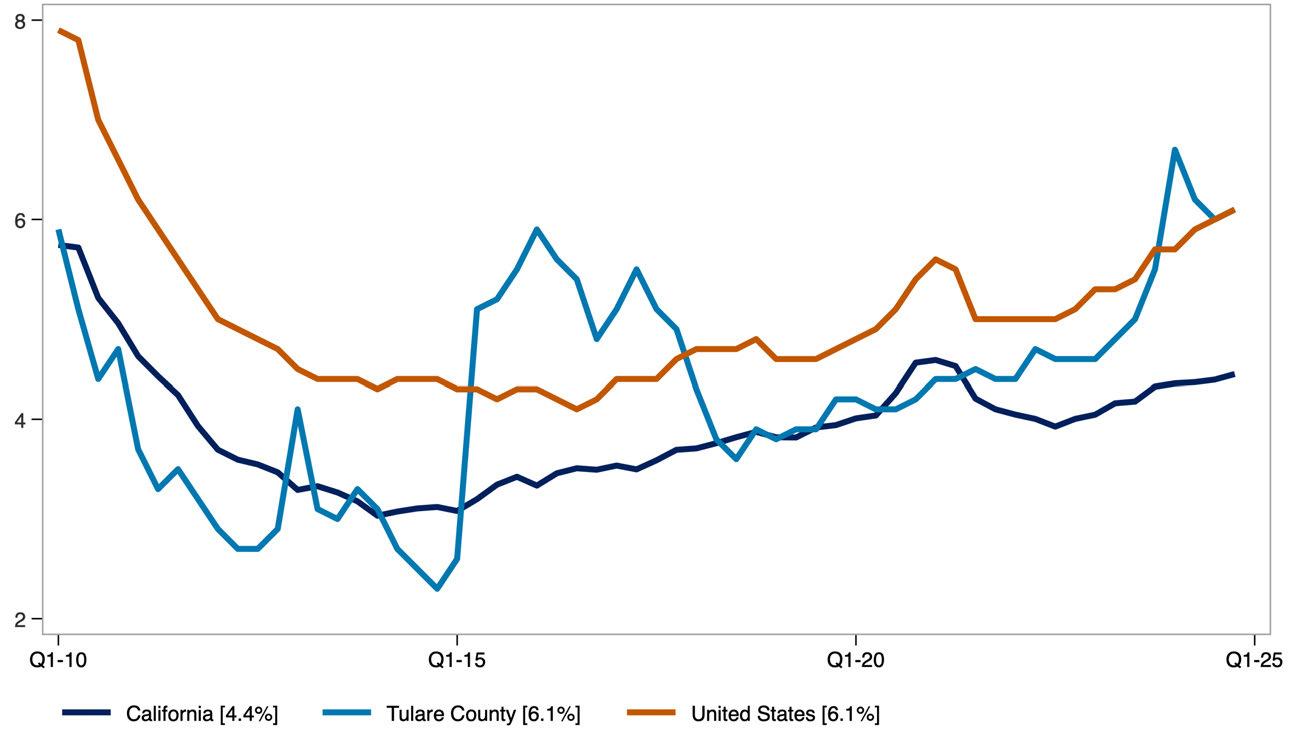
It serves as an indicator of the balance between rental housing supply and demand. Lower vacancy rates typically point to tighter market conditions, while higher rates suggest greater availability.
STATE OF RENTERS: COUNTY OF TULARE
Key demographic and socioeconomic characteristics of renter households include household size, poverty status, income distribution, language access, and household composition. Together, these indicators offer a snapshot of how renter households are structured and how those characteristics have shifted over time. The data combine absolute figures, such as the number of renter households, with percentages that reflect household traits, such as the share with children or seniors.
Demographic Characteristics of Tulare County Renter Households.
Source: American Community Survey Public Use Microdata Sample (PUMS) Analysis by Beacon Economics.
The share of single-person renter households who moved into their current home within the past two years reflects residential mobility among renters living alone.
This measure helps illustrate turnover in the rental market and may indicate trends in housing availability and economic stability for solo renters.
Share of Single-Person Renter Households That Have Moved in Previous 2 Years
Source: American Community Survey, Public Use Microdata Sample (PUMS). Analysis by Beacon Economics.
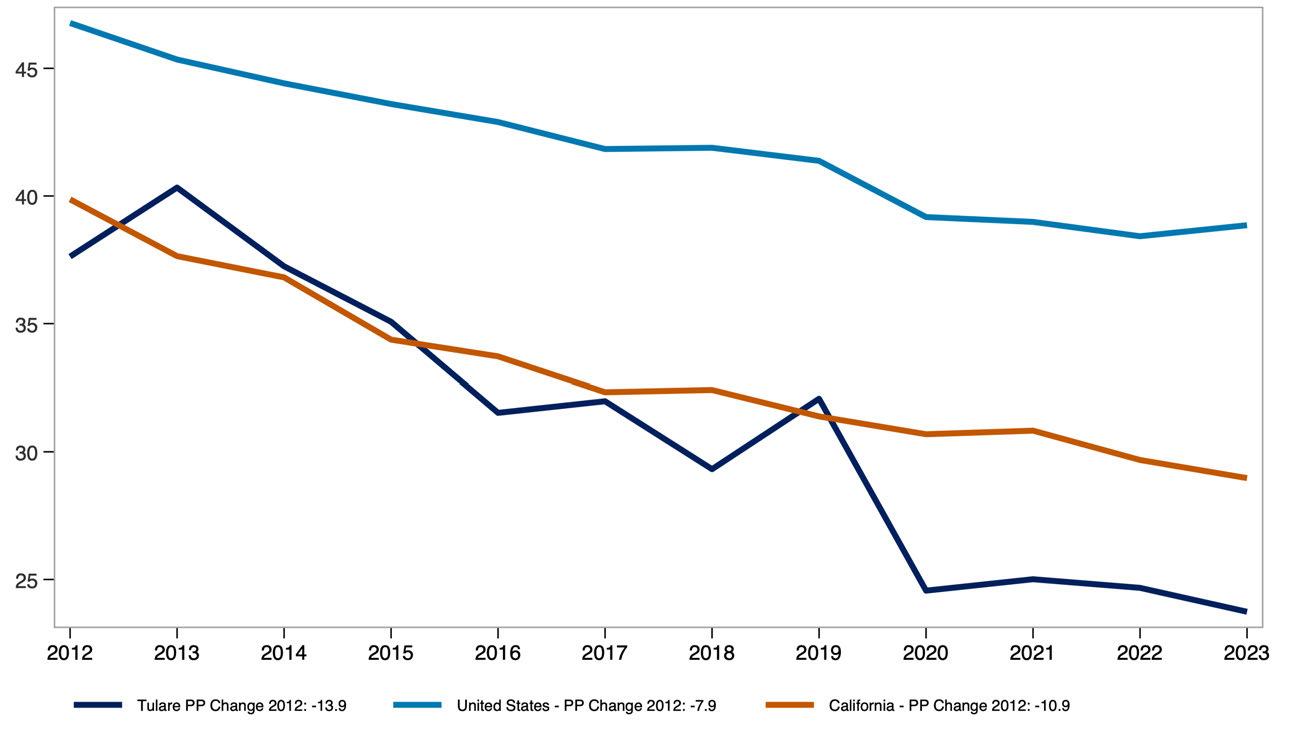
The share of multi-person renter households who moved within the past two years reflects residential mobility among shared or family households.
This measure offers insight into turnover rates and housing stability for renters living with others, whether as families or roommates.
Share of Multi-Person Renter Households That Have Moved in Previous 2 Years
Source: American Community Survey, Public Use Microdata Sample (PUMS). Analysis by Beacon Economics.
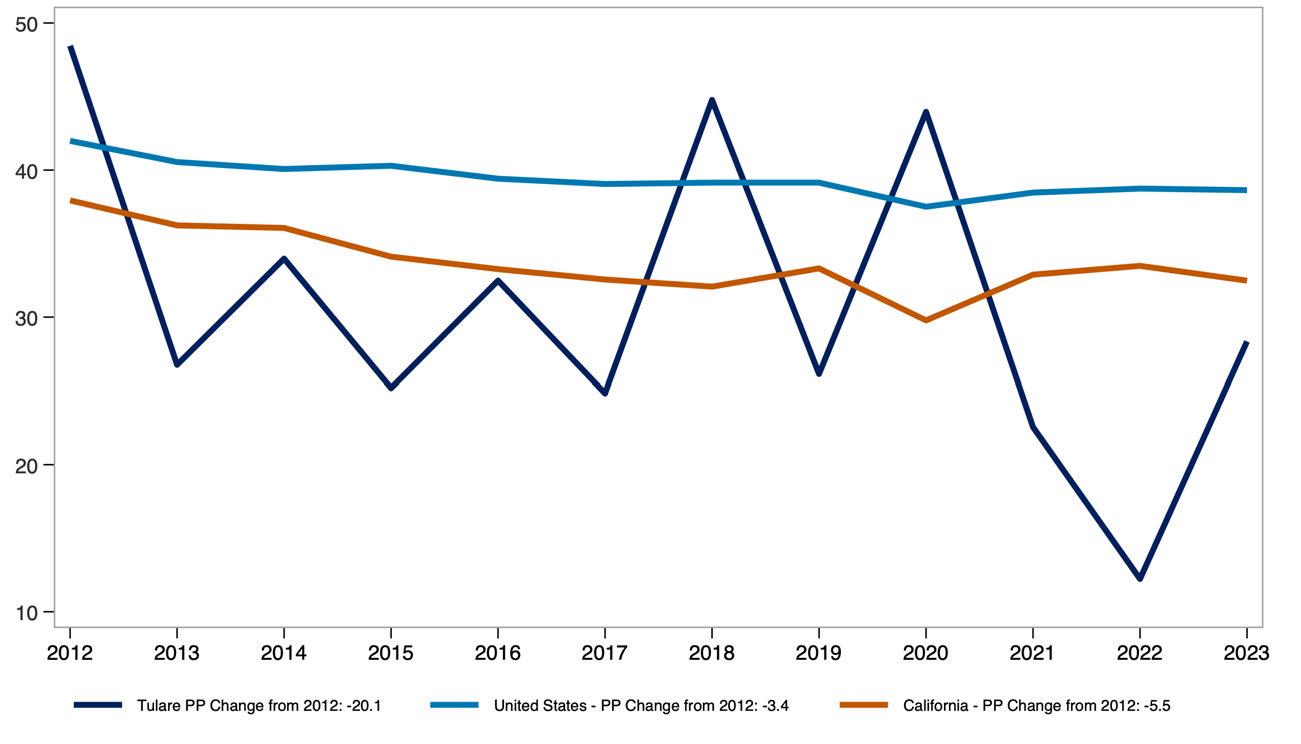
The share of renter households that are single person versus multi-person provides insight into how household size and composition have shifted over time.
Demographic Characteristics of Tulare County Renter Households.
Source: American Community Survey Public Use Microdata Sample (PUMS) Analysis by Beacon Economics.
Real median pre-tax income of renter households, measured in 2023 dollars, reflects how renter incomes have changed in purchasing power over time.
Comparing the county to the U.S. highlights how local renter income levels have evolved relative to the national average.
Real Median Renter Pre-Tax Income ($ 2023, 000s)
Source: Public Use Microdata Sample (PUMS) Analysis by Beacon Economics.
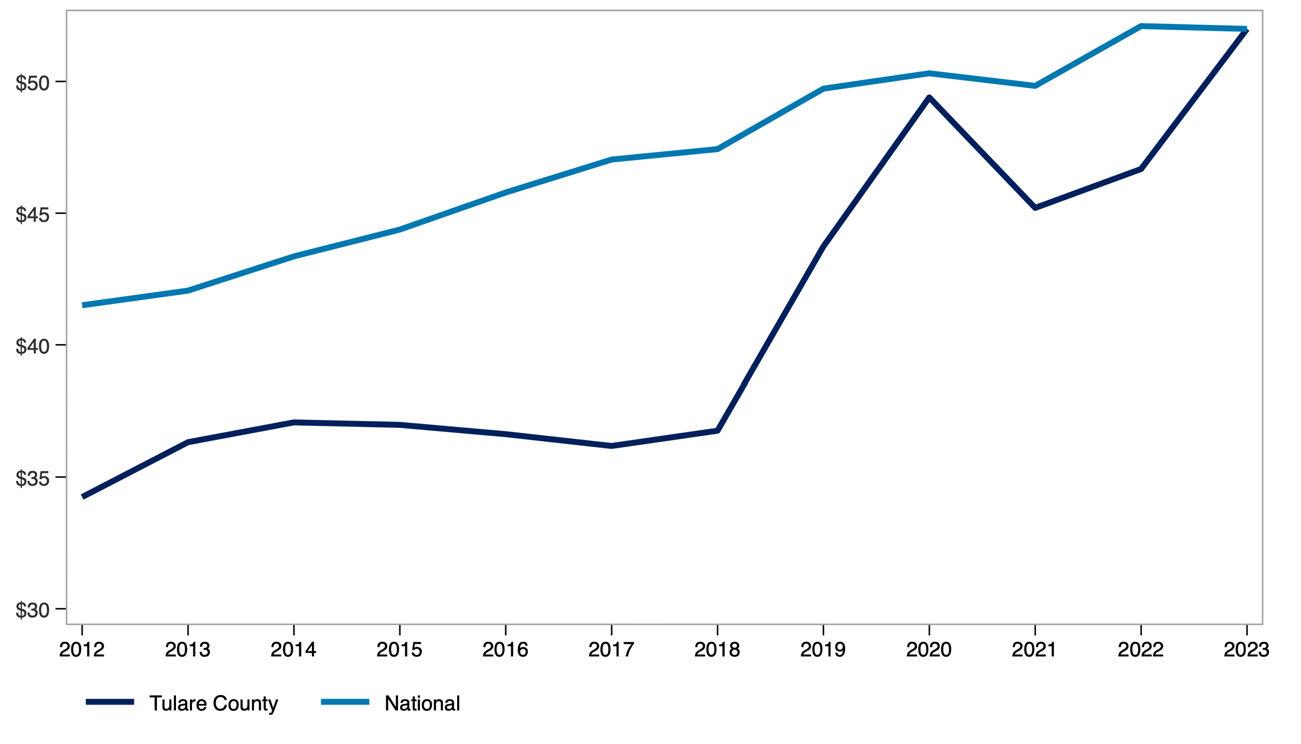
The share of income spent on rent, broken out by renter household type and income level, shows how rent burden varies across the population. This measure compares single-person and multi-person households at the 25th percentile, median, and 75th percentile of the burden distribution, offering insight into how both household size affects housing affordability. Share of
Monthly renter household income before and after rent adjusted for inflation, highlights how much income renters have overall and how much remains after covering housing costs. Presented at the 25th percentile, median, and 75th percentile, this measure provides a view of post-rent income across different points in the income distribution.
Real
Monthly Pre/Post-Rent Income for Renter Households in Tulare County
Source: Public Use Microdata Sample (PUMS). US Bureau of Economic Analysis. Analysis by Beacon Economics. Data are in $ 2023.
STATE OF THE STOCK: COUNTY OF TULARE
The share of renter-occupied housing units by the year the building was built offers insight into the age of the rental housing stock across the county, California, and the United States. This measure helps illustrate how recently or how long ago rental units were added to each region’s housing supply.
Renter Occupied Housing by Year Built, Tulare County
Source: 2023 American Community Survey. Analysis by Beacon Economics.
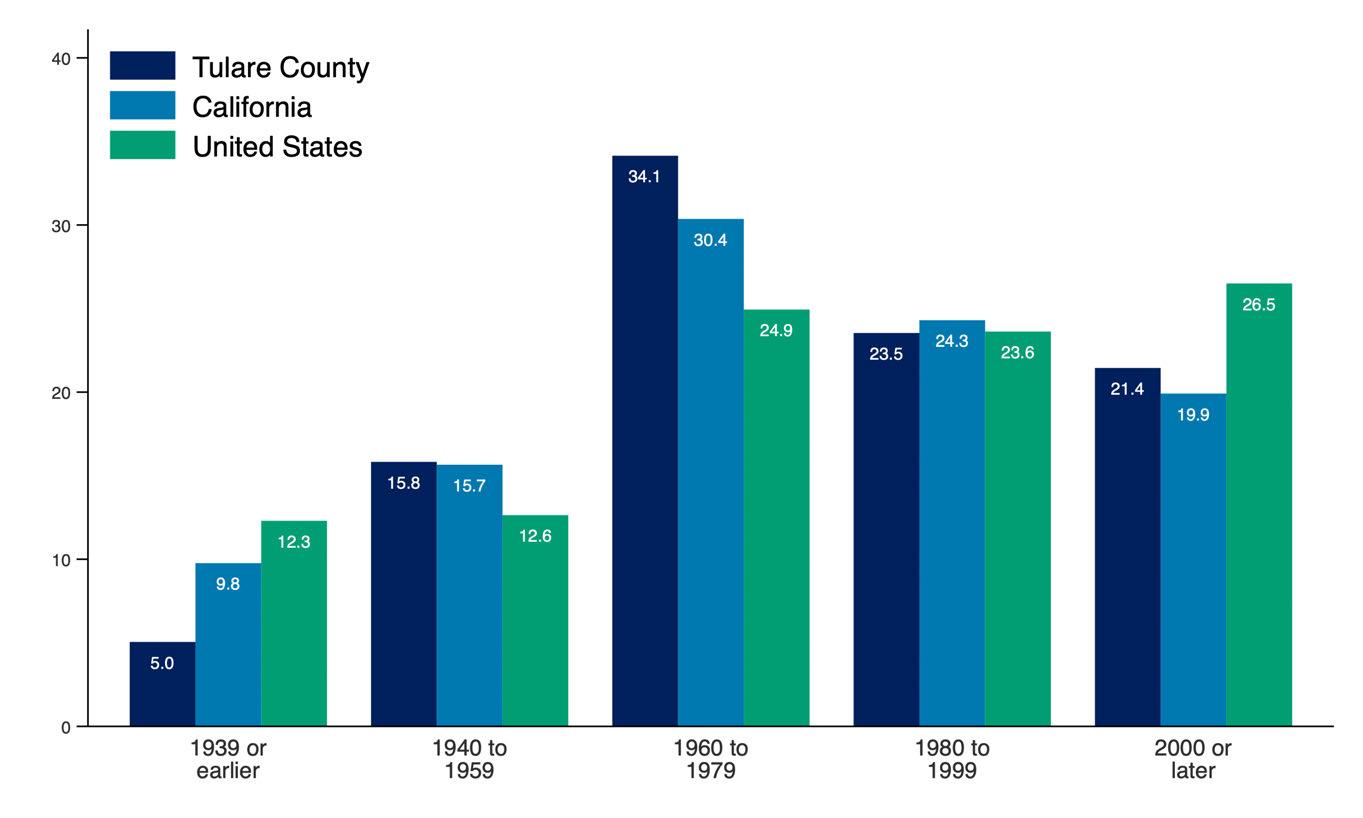
Producer Price Index (PPI) trends for goods and services used in multifamily residential construction reflect how input costs have changed over time. These trends influence the cost and feasibility of developing new rental housing. A broader commodity index is also included to show how construction-specific price movements compare to price trends across all industries.
Producer Price Index by Commodity, United States
Source: U.S. Bureau of Labor Statistics. Analysis by Beacon Economics.
Net Inputs to Multifamily
Residential Construction: Goods, Less Food and Energy
Net Inputs to Multifamily
Residential Construction: Services
All Commodities
Net Inputs to Multifamily
Residential Construction, Excluding Capital Investment, Labor, and Imports
The State of Renters in Ventura County
Renter incomes in Ventura County have grown significantly. Even after adjusting for inflation and subtracting rent, household income has increased by 30.3% over the past decade compared to 21.4% for renters nationwide.
Household composition is shifting as well. The share of single-person renter households in Ventura County has decreased by 0.2 percentage points over the past decade, reflecting a broader trend toward larger household sizes.
Rent burden has remained stable overall. For all renters, the median share of income spent on rent has held steady over the past decade. Among multi-person renter households, rent burden has declined from 29.6% in 2013 to 27.9% in 2023 pointing to modest improvements in affordability for shared households.
STATE OF THE MARKET: COUNTY OF VENTURA
Asking rent represents the price landlords list for vacant units, rather than what current tenants are paying. When adjusted for inflation, it provides insight into how advertised rents have changed in real terms.
The year-over-year rent growth rate captures the pace at which rents are rising or falling. Together, these measures reflect both the level and volatility of rental prices over time.
Real Asking Rents for Apartments in Ventura County ($ Q4-2024)
Source: US Bureau of Labor Statistics. Moody's Analytics. Analysis by Beacon Economics.
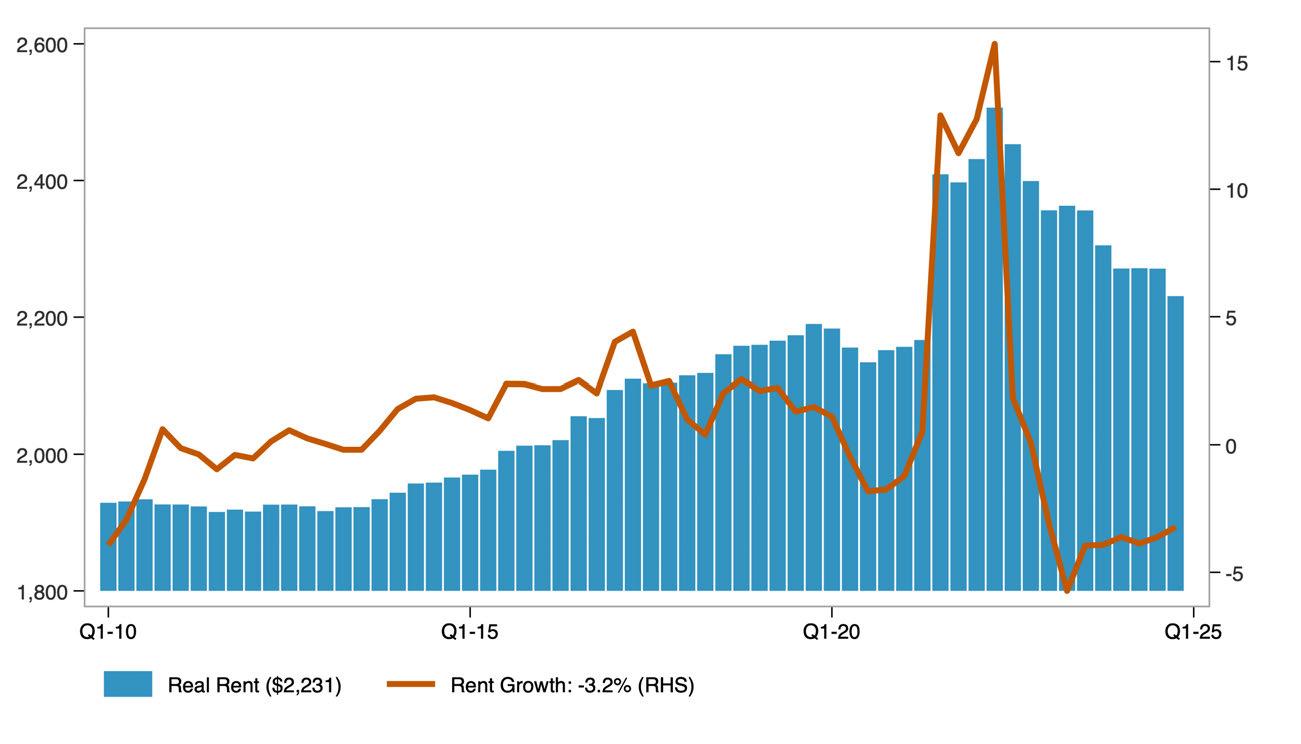
The distribution of real asking rents in the county, adjusted for inflation, shows how advertised rental prices have changed across the market over time. The 25th percentile reflects lower-cost rentals, the median represents the typical rental, and the 75th percentile indicates higher-cost rentals. Together, these measures illustrate how asking rents have changed at multiple price points, not just on average, over the past decade.
Distribution of Real Asking Rents in
Source: Public Use Microdata Sample (PUMS). US Bureau of Economic Analysis. Analysis by Beacon Economics. Data are in $ 2023.
The distribution of real contract rents in the county, adjusted for inflation, shows how actual rents paid by tenants have changed across the market over the past decade. Unlike asking rents, contract rents reflect what households are currently paying, offering insight into renters’ real housing costs over time.
Distribution of Real Contract Rents in Ventura County
Source: Public Use Microdata Sample (PUMS). US Bureau of Economic Analysis. Analysis by Beacon Economics. Data are in $ 2023.
The apartment vacancy rate measures the share of rental units that are unoccupied and available for rent at a given time.
Vacancy Rate for Apartments in Ventura County
Source: Moody's Analytics. Analysis by Beacon Economics.
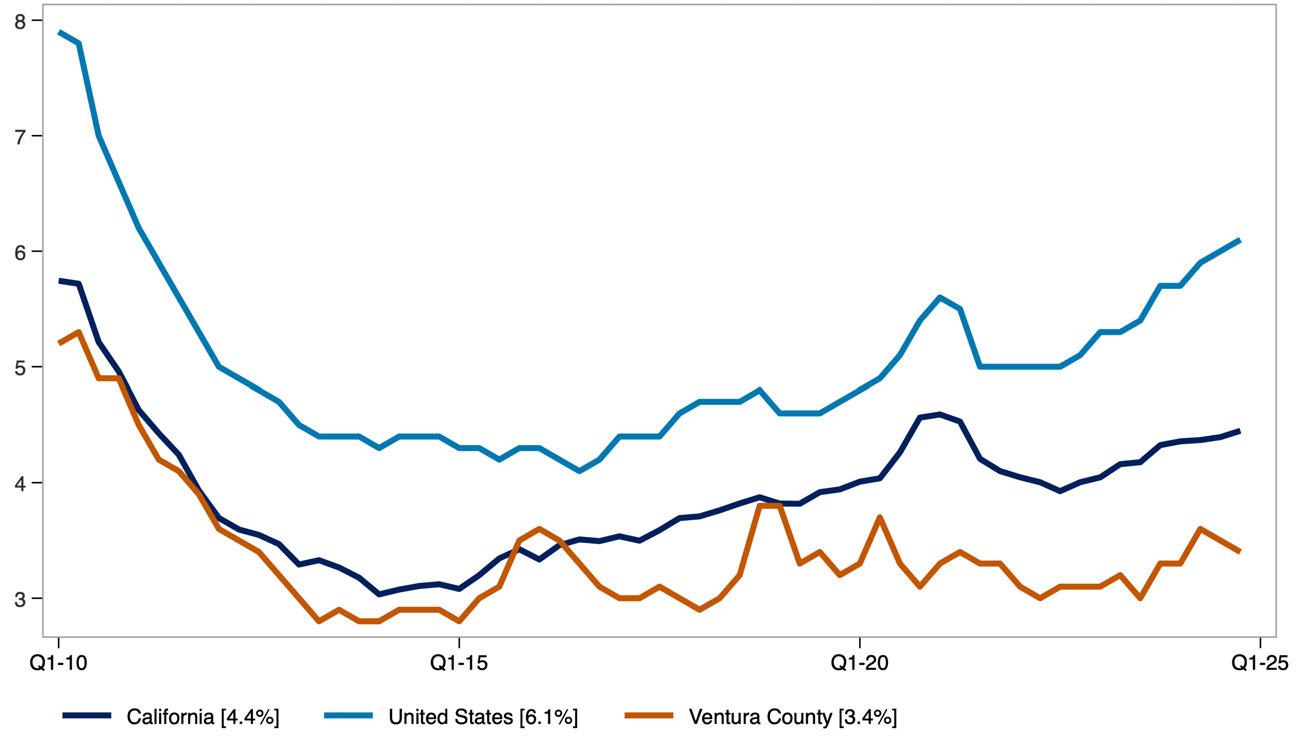
It serves as an indicator of the balance between rental housing supply and demand. Lower vacancy rates typically point to tighter market conditions, while higher rates suggest greater availability.
STATE OF RENTERS: COUNTY OF VENTURA
Key demographic and socioeconomic characteristics of renter households include household size, poverty status, income distribution, language access, and household composition. Together, these indicators offer a snapshot of how renter households are structured and how those characteristics have shifted over time. The data combine absolute figures, such as the number of renter households, with percentages that reflect household traits, such as the share with children or seniors.
Demographic Characteristics of Ventura County Renter Households.
Source: American Community Survey Public Use Microdata Sample (PUMS) Analysis by Beacon Economics.
The share of single-person renter households who moved into their current home within the past two years reflects residential mobility among renters living alone.
This measure helps illustrate turnover in the rental market and may indicate trends in housing availability and economic stability for solo renters.
Share of Single-Person Renter Households That Have Moved in Previous 2 Years
Source: American Community Survey, Public Use Microdata Sample (PUMS). Analysis by Beacon Economics.
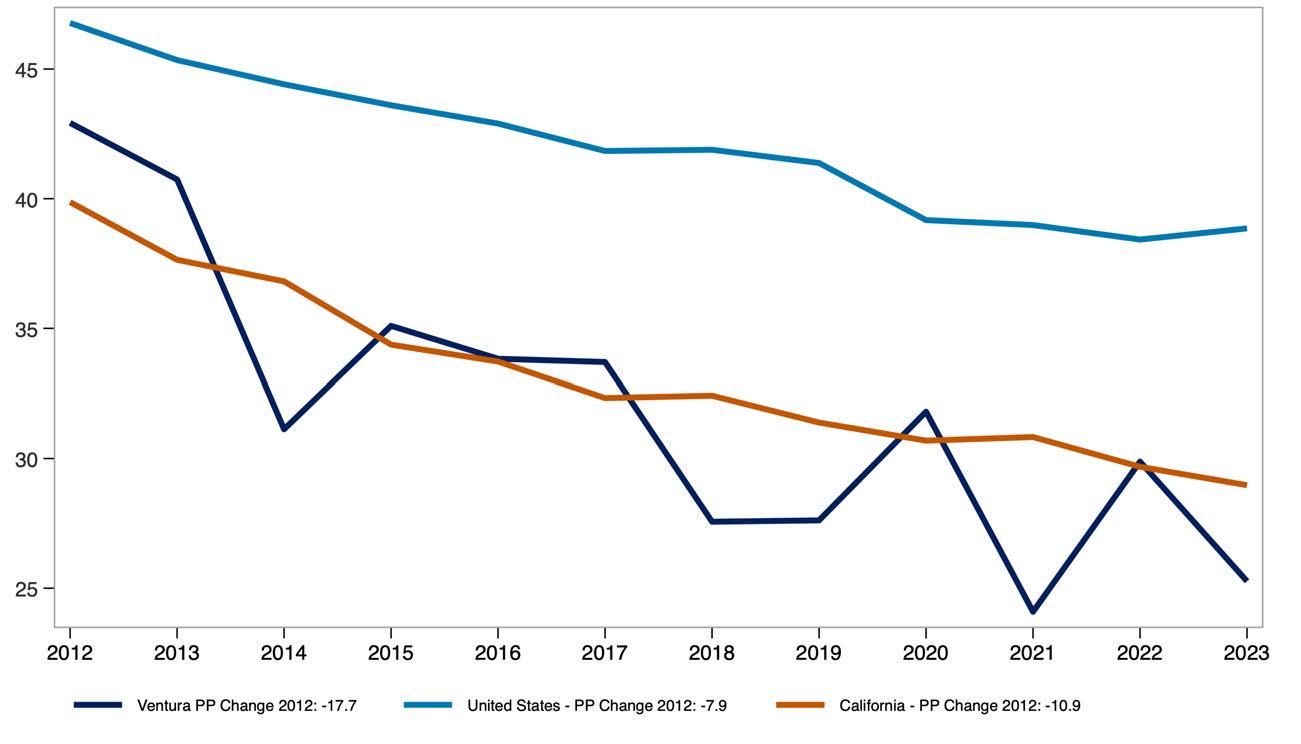
The share of multi-person renter households who moved within the past two years reflects residential mobility among shared or family households.
This measure offers insight into turnover rates and housing stability for renters living with others, whether as families or roommates.
Share of Multi-Person Renter Households That Have Moved in Previous 2 Years
Source: American Community Survey, Public Use Microdata Sample (PUMS). Analysis by Beacon Economics.
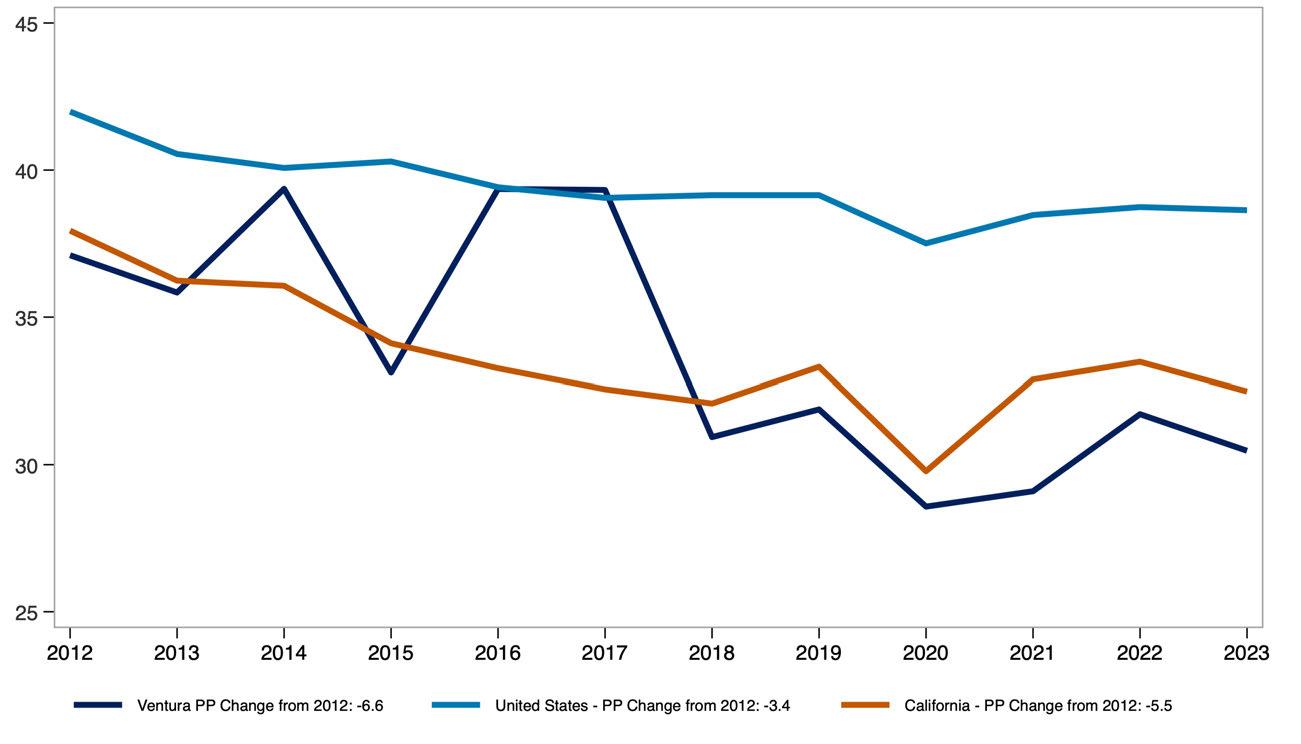
The share of renter households that are single person versus multi-person provides insight into how household size and composition have shifted over time.
Demographic Characteristics
Source: American Community Survey Public Use Microdata Sample (PUMS) Analysis by Beacon Economics.
Real median pre-tax income of renter households, measured in 2023 dollars, reflects how renter incomes have changed in purchasing power over time.
Comparing the county to the U.S. highlights how local renter income levels have evolved relative to the national average.
Real Median Renter Pre-Tax Income ($ 2023, 000s)
Source: Public Use Microdata Sample (PUMS) Analysis by Beacon Economics.
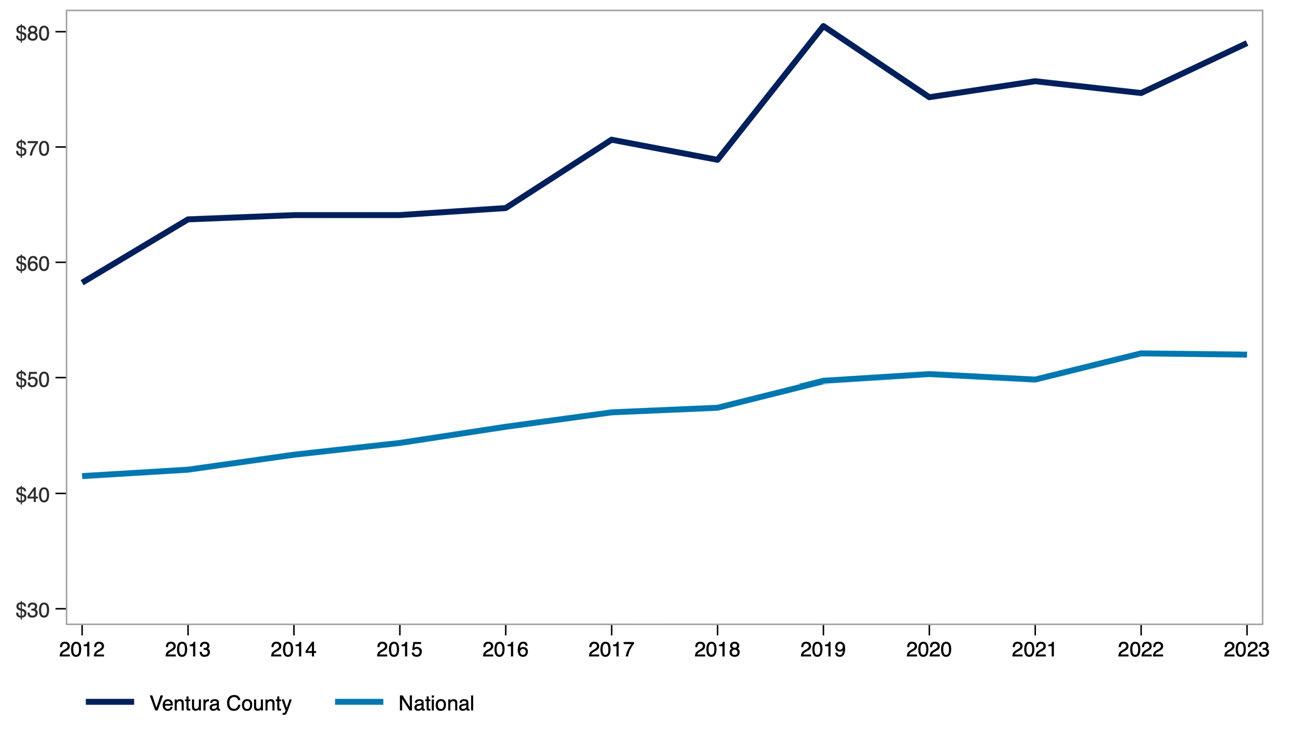
The share of income spent on rent, broken out by renter household type and income level, shows how rent burden varies across the population. This measure compares single-person and multi-person households at the 25th percentile, median, and 75th percentile of the burden distribution, offering insight into how both household size affects housing affordability.
Monthly renter household income before and after rent adjusted for inflation, highlights how much income renters have overall and how much remains after covering housing costs. Presented at the 25th percentile, median, and 75th percentile, this measure provides a view of post-rent income across different points in the income distribution.
Real Monthly Pre/Post-Rent Income for Renter Households in Ventura County
Source: Public Use Microdata Sample (PUMS). US Bureau of Economic Analysis. Analysis by Beacon Economics. Data are in $ 2023.
STATE OF THE STOCK: COUNTY OF VENTURA
The share of renter-occupied housing units by the year the building was built offers insight into the age of the rental housing stock across the county, California, and the United States. This measure helps illustrate how recently or how long ago rental units were added to each region’s housing supply.
Renter Occupied Housing by Year Built, Ventura County
Source: 2023 American Community Survey. Analysis by Beacon Economics.

Producer Price Index (PPI) trends for goods and services used in multifamily residential construction reflect how input costs have changed over time. These trends influence the cost and feasibility of developing new rental housing. A broader commodity index is also included to show how construction-specific price movements compare to price trends across all industries.
Producer Price Index by Commodity, United States
Source: U.S. Bureau of Labor Statistics. Analysis by Beacon Economics.
Net Inputs to Multifamily
Residential Construction: Goods, Less Food and Energy
Net Inputs to Multifamily
Residential Construction: Services
All Commodities
Net Inputs to Multifamily
Residential Construction, Excluding Capital Investment, Labor, and Imports