Report of Independent Auditors
The Board of Commissioners
Public Utility District No. 1 of Pend Oreille County Newport, Washington
Report on the Audit of the Financial Statements
Opinions
We have audited the financial statements of Public Utility District No. 1 of Pend Oreille County, Washington (the District), which comprise the District’s combined statements of net position as of December 31, 2023 and 2022, the related combined statements of revenues, expenses, and c hanges in net position, and cash flows for the years ended December 31, 2023 and 2022, the individual statements of net position of the Electric, Box Canyon Production, Water, and Community Network Systems as of December 31, 2023, and the related individual statements of revenues, expenses, and changes in net position and cash flows for the Electric, Box Canyon Production, Water, and Community Network Systems for the year ended December 31, 2023, and the related notes to the financial statements.
In our opinion, the accompanying financial statements referred to above present fairly, in all material respects, the combined financial position of the District as of December 31, 2023 and 2022, and the individual financial positions of the Electric, Box Canyon Production, Water, and Community Network Systems for the year ended December 31, 2023, and the respective changes in financial position and, where applicable, cash flows thereof for the years then ended in accordance with accounting principles generally accepted in the United States of America.
Basis for Opinions
We conducted our audits in accordance with auditing standards generally accepted in the United States of America (GAAS) and the standards applicable to financial audits contained in Government Auditing Standards (Government Auditing Standards), issued by the Comptroller General of the Un ited States. Our responsibilities under those standards are further described in the Auditor’s Responsibilities for the Audit of the Financial Statements section of our report. We are required to be independent of the District and to meet our other ethical responsibilities, in accordance with the relevant ethical requirements relating to our audit. We believe that the audit evidence we have obtained is sufficient and appropriate to provide a basis for our audit opinions.
Responsibilities of Management for the Financial Statements
Management is responsible for the preparation and fair presentation of the financial statements in accordance with accounting principles generally accepted in the United States of America, and for the design, implementation, and maintenance of internal control relevant to the preparation and fair presentation of financial statements that are free from material misstatement, whether due to fraud or error.
In preparing the financial statements, management is required to evaluate whether there are conditions or events, considered in the aggregate, that raise substantial doubt about the District’s ability to continue as a going concern for 12 months beyond the financial statement date, including any currently known information that may raise substantial doubt shortly thereafter.
Auditor’s Responsibilities for the Audit of the Financial Statements
Our objectives are to obtain reasonable assurance about whether the financial statements as a whole are free from material misstatement, whether due to fraud or error, and to issue an auditor’s report that includes our opinions. Reasonable assurance is a high level of assurance but is not absolute assurance and therefore is not a guarantee that an audit conducted in accordance with GAAS and Government Auditing Standards will always detect a material misstatement when it exists. The risk of not detecting a material misstatement resulting from fraud is higher than for one resulting from error, as fraud may involve collusion, forgery, intentional omissions, misrepresentations, or the override of internal control. Misstatements are considered material if there is a substantial likelihood that, individually or in the aggregate, they would influence the judgment made by a reasonable user based on the financial statements.
8 1

In performing an audit in accordance with GAAS and Government Auditing Standards, we
Exercise professional judgment and maintain professional skepticism throughout the audit.
Identify and assess the risks of material misstatement of the financial statements, whether due to fraud or error, and design and perform audit procedures responsive to those risks. Such procedures include examining, on a test basis, evidence regarding the amounts and disclosures in the financial statements.
Obtain an understanding of internal control relevant to the audit in order to design audit procedures that are appropriate in the circumstances, but not for the purpose of expressing an opinion on the effectiveness of District’s internal control. Accordingly, no such opinion is expressed.
Evaluate the appropriateness of accounting policies used and the reasonableness of significant accounting estimates made by management, as well as evaluate t he overall presentation of the financial statements.
Conclude whether, in our judgment, there are conditions or events, considered in the aggregate, that raise substantial doubt about District’s ability to continue as a going concern for a reasonable period of time.
We are required to communicate with those charged wi th governance regarding, among other matters, the planned scope and timing of the audit, significant audit findings, and certain internal control–related matters that we identified during the audit.
Required Supplementary Information
Accounting principles generally accepted in the United States of America require that accompanying management’s discussion and analysis, schedule of proportionate share of net pension liability (asset), and schedule of employer contributions be presented to supplement the basic financial statements. Such information is the responsibility of management and, although not a part of the basic financial statements, is required by the Governmental Accounting Standards Board who considers it to be an essential part of financial reporting for placing the basic financial statements in an appropriate operational, economic, or historical context. We have applied certain limited procedures to the required supplementary information in accordance with auditing standards generally accepted in the United States of America, which consisted of inquiries of management about the methods of preparing the information and comparing the information for consistency with management's responses to our inquiries, the basic fi nancial statements, and other knowledge we obtained during our audit of the basic financial statements. We do not express an opinion or provide any assurance on the information because the limited procedures do not provide us with sufficient evidence to express an opinion or provide any assurance.
Supplementary Information
Our audit was conducted for the purpose of forming opinions on the financial statements that collectively comprise the District's basic financial statements. The supplemental schedules of Electric System – revenue, customer, and energy statistics, Electric System – senior lien parity debt service coverage, Box Canyon Production System – senior lien parity debt service coverage, and Community Network System – senior lien parity debt service coverage are presented for purposes of additional analysis and are not a required part of the basic financial statements. Such information has not been subjected to the auditing procedures applied in the audit of the basic financial statements, and, accordingly, we express no opinion on it.
Other Reporting Required by Government Auditing Standards
In accordance with Government Auditing Standards , we have also issued our report dated March 29, 2024, on our consideration of District’s internal control over financial reporting and on our tests of its compliance with certain provisions of laws, regulations, contracts, and grant agreements and other matters. The purpose of that report is solely to describe the scope of our testing of internal control over financial reporting and compliance and the results of that testing, and not to provide an opinion on the effectiveness of District’s internal control over financial reporting or on compliance. That report is an integral par t of an audit performed in accordance with Government Auditing Standards in considering District’s internal control over financial reporting and compliance.

Everett, Washington March 29, 2024
9
Management’s Discussion and Analysis
Public Utility District No. 1 of Pend Oreille County
The financial management of Public Utility District No. 1 of Pend Oreille County, Washington (the District) offers readers of these financial statements this overview and summary analysis of the financial activities of the District for the years ended December 31, 2023, 2022, and 2021. This discussion and analysis is designed to be used in conjunction with the financial statements and notes, which follow this section.
Profile
Pend Oreille County (the County) is located in the northeast corner of Washington State, bordered on the north by Canada and the east by the state of Idaho. The County is traversed by the Pend Oreille River, which is the second largest river in the State. Most of the County’s land area consists of private timber holdings, the Kalispel Indian Reservation, and the Colville National Forest. Historically, the region’s economy has been primarily based on forest and mineral resources. The major land use activity in the area is agriculture, forestry and recreation. The City of Newport serves as the County seat and is the largest city in the County. Other incorporated areas of the County include the towns of Cusick, Ione, Metaline and Metaline Falls.
Overview of the Financial Statements
The financial section of the annual report includes the report of independent auditors, management’s discussion and analysis, basic financial statements with accompanying notes, and required supplementary information (unaudited).
The financial statements of the District report the self-supporting, proprietary activities of the District funded primarily by the sale of power, water, and telecommunication services. The District reports the businesstype activities in a manner similar to private-sector business enterprises, using the accrual basis of accounting, in accordance with accounting principles generally accepted in the United States of America.
The District’s proprietary reporting entity consists of four primary component units, or operating systems. The Electric System distributes electricity to residential and other consumers in Pend Oreille County. The Box Canyon Production System produces hydroelectric power from the Box Canyon Hydroelectric Project. The Water System consists of nine individual water distribution subdivisions. The Community Network System supplies wholesale broadband communication services. The financial statements are reported in a combined format, meaning that each of the primary component units is reported in a columnar approach, which are combined into a District-wide total.
The combined statements of net position present information on the District’s assets, liabilities, deferred outflows and inflows of resources, and net position (equity) of the District at year end. The net position section is separated into three categories: net investment in capital assets, net position – restricted, and net position – unrestricted.
The combined statements of revenues, expenses, and changes in net position report revenues and expenses, as well as change in net position for the period. Revenues and expenses are classified as operating or non-operating based on the nature of the transaction.
The combined statements of cash flows provide information concerning cash receipts and disbursements during the reporting period resulting from operational, financing, and investing activities.
The notes to the combined financial statements provide additional information that is essential to a full understanding of the financial statements, as described above, and are an integral part thereof.
10
Public Utility District No. 1 of Pend Oreille County
Financial Analysis
During 2023, the District’s overall financial position improved. Total net position for the District increased $17,292,607 from $167,530,713 in 2022 to $184,823,320 in 2023. Primary drivers of the increase include strong retail sales with level operating costs and favorable investment rate conditions in 2023. The District earned $2.7 million more in interest income in 2023 than it did in 2022, and over $3.5 million more than 2021. Interest is allocated across Systems based on fund balances.
Combined Statements of Net Position as of December 31
Assets and Deferred Outflows of Resources
assets and deferred outflows of resources396,573,851 $
Liabilities and Deferred Inflows of
Combined Statements of Revenues, Expenses, and Changes in
for the Year Ended December 31
11 Management’s
Discussion and Analysis
2023 2022 2021
Current assets 110,407,559 $ 96,575,890 $ 90,995,559 $ Other assets 44,437,472 44,880,945 45,238,592 Net utility plant 238,860,476 241,708,309 245,343,030 Total assets 393,705,507 383,165,144 381,577,181 Deferred outflows of resources 2,868,344 3,111,089 1,414,949
386,276,233
382,992,130
Total
$
$
Resources Current liabilities 25,718,309 $ 23,540,285 $ 22,793,778 $ Other liabilities 49,695,277 52,893,500 50,007,223 Long-term debt 133,962,931 139,871,613 145,684,419 Total liabilities 209,376,517 216,305,398 218,485,420 Deferred inflows of resources 2,374,014 2,440,122 6,892,940 Total liabilities
deferred
of resources211,750,531 $ 218,745,520 $ 225,378,360 $ Net position Net investment in capital assets 104,311,645 $ 100,702,789 $ 99,554,876 $ Restricted 30,022,616 28,975,849 26,688,842 Unrestricted 50,489,059 37,852,075 31,370,052 Total net position 184,823,320 $ 167,530,713 $ 157,613,770 $
2023 2022 2021 Operating
Sales to retail customers 59,180,158 $ 44,152,938 $ 25,414,409 $ Sales to other utilities 35,880,650 37,006,292 30,177,934 Other 2,701,831 2,451,864 1,860,350 Total operating revenues 97,762,639 $ 83,611,094 $ 57,452,693 $ Operating Expenses Power costs 44,191,021 $ 36,088,935 $ 17,919,969 $ Operations, maintenance, and administrative20,952,358 19,267,058 15,714,760 Taxes and depreciation 14,879,131 13,842,316 11,727,772 Total operating expenses 80,022,510 $ 69,198,309 $ 45,362,501 $ Nonoperating Revenues (Expenses) Interest income 3,596,115 $ 837,464 $ 45,180 $ Interest expense (5,203,273) (5,337,459) (5,464,685) Other 1,159,636 4,153 622,985 Total nonoperating revenues (expenses) (447,522) $ (4,495,842) $ (4,796,520) $ Change in Net Position 17,292,607 $ 9,916,943 $ 7,293,672 $
and
inflows
Net Position
Revenues
Management’s Discussion and Analysis
Public Utility District No. 1 of Pend Oreille County
Electric System
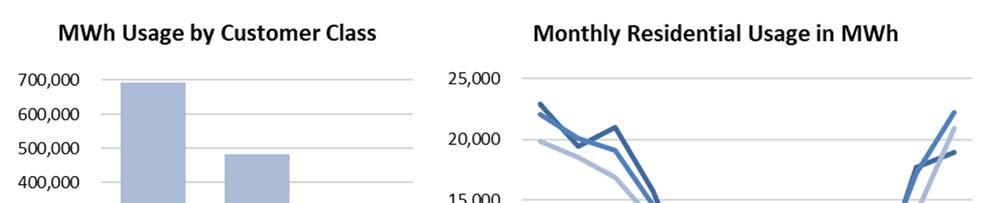
The District’s Electric System distributes electricity to approximately 10,000 meters, including 852 commercial customers and 10 industrial customers. The District generates power from District-owned Box Canyon Dam and Calispel Powerhouse, and during 2023 purchased power from Bonneville Power Administration, Seattle City Light, Shell Energy North America (US), L.P. (Shell) and Avista Corporation, in addition to other isolated transactions with market counterparties. Avista Corporation serves as the District’s balancing authority.
Electric System Financial Data
Total assets and deferred outflows of resources141,336,369
Total liabilities and deferred inflows of resources
Capital Assets
Long Term Debt
Changes in Net Position
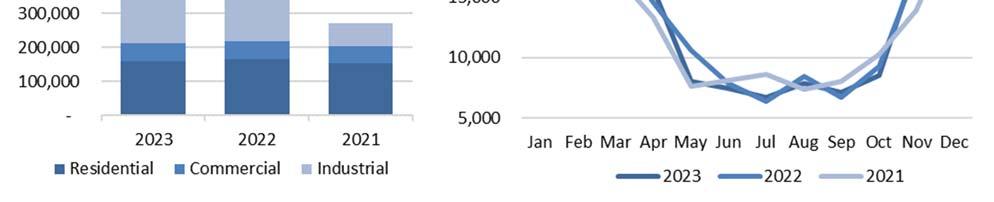
Total energy consumption for residential electric customers was 161,460 megawatt hours (MWh), slightly less than 2022’s consumption of 164,534 MWh and up from 153,417 MWh in 2021. The District is a winter-peaking utility and variable winter temperatures impact residential electric load. The weather in 2023 was relatively mild, while December 2022 had a cold weather event that resulted in higher than average electric usage. 2021 was a relatively mild year.
Residential Energy Statistics
202320222021
12
as of December 31 202320222021
125,611,243 $ 116,299,071
37,261,600
Net investment in capital assets 55,950,373 52,463,388 49,151,708 Restricted 14,619,472 13,837,732 12,816,969 Unrestricted 33,619,266 22,048,523 14,768,076 Total net position 104,189,111 $ 88,349,643 $ 76,736,753 $
$
$
37,147,258
39,562,318
Transmission and distribution 129,587,492 $ 126,091,816 $ 123,773,395 $ Hydroelectric plant and equipment 1,525,945 1,525,945 1,525,945 General plant 8,983,412 8,983,412 4,420,834 Total utility plant in service 140,096,849 136,601,173 129,720,174 Construction work in progress 4,299,452 1,821,086 1,694,965 Total gross utility plant 144,396,301 $ 138,422,259 $ 131,415,139 $
202320222021
Total debt outstanding 6,961,378 $ 7,763,357 $ 8,554,242 $
202320222021
Operating revenues 94,565,028 $ 80,468,585 $ 54,144,713 $ Operating ex penses (81,008,202) (69,066,506) (45,283,173) Nonoperating revenues (ex penses) 2,282,642 210,811 135,326 Total change in net position 15,839,468 $ 11,612,890 $ 8,996,866 $
202320222021
Customer growth 1.27%1.88%2.33% Energy rate (cents per kWh)6.23¢6.23¢6.12¢ Monthly system access charge$35.50$35.50$35.50 Average monthly usage (kWh)1,472 1,557 1,468
Management’s Discussion and Analysis
Public Utility District No. 1 of Pend Oreille County
The District last implemented an electric revenue increase effective January 1, 2022 for 1.25%. The average blended residential charge per kilowatt hour (kWh), including the monthly access fixed charge, was 8.52 cents per kWh compared to 8.47 cents and 8.46 cents per kWh in 2022 and 2021, respectively. The United States average residential retail price in 2023 per the U.S. Energy Information Administration was 15.98 cents per kilowatt hour.
The District’s largest industrial customer, Cascade Digital Mining, LLC (Cascade) accounted for 61% of the District’s energy retail sales in 2023. Cascade began digital mining operations in Pend Oreille County in 2021 averaging 5 MW of energy consumption in 2021, 23 MW in 2022, and 48 MW in 2023.
Power is provided to Cascade as a combination of District resources and market power and is generally purchased by the District in shaped monthly blocks. Cascade operates under a cost-based contract that expires March 31, 2024. Billings are prepaid and are further collateralized by a $4.9 million letter of credit. Total energy sales to Cascade were $31.9 million, $17.3 million, and $655 thousand for the years ended December 31, 2023, 2022, and 2021, respectively.
2023 completed the third operating year of the District’s five-year contract with Shell. Under the contract, the District sells to Shell specifiedsource Box Canyon power, and power assigned to the District from Seattle City Light. The District purchases power from Shell to meet its forecasted monthly energy requirements. The net of the transactions result in fixed monthly payments from Shell to the District over the fiveyear contract period. Net payments under this agreement to the District were $15.5 million, $16.2 million and $15.7 million for the years ended December 31, 2023, 2022 and 2021, respectively.
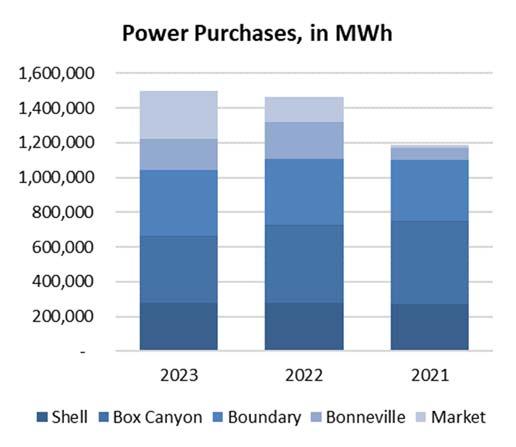
The District purchases power from Seattle City Light’s Boundary Hydroelectric Project. Under the current agreement, the District receives power in monthly blocks shaped to the District’s seasonal energy load, with
13
Management’s Discussion and Analysis
Public Utility District No. 1 of Pend Oreille County
fixed payments that escalate annually through 2029. The cost per MWh was $8.72 in 2023, $8.22 in 2022, and $8.31 in 2021.
The District received an average of 20.40 MW of power per hour from the Bonneville Power Administration (BPA) during 2023. The District receives power deliveries when the District’s dedicated resources are determined to be insufficient to meet the District’s total retail load for the upcoming October through September fiscal year. Variable industrial load forecasts impact the amount of BPA power that the District receives from year to year. The District received an average of 23.85 MW of power per hour from BPA in 2022, and received an annual average of 7.36 MW in 2021, which only qualified for power deliveries for part of the year.
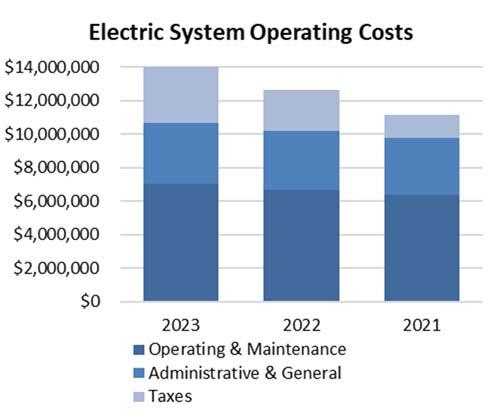
Overall Electric System operating costs have remained fairly consistent over the past three years. Utility taxes are based on gross revenue received and have increased in direct relation to the increase in industrial revenue during both 2022 and 2023. Operations, maintenance, administrative, and general expenses increased 4.6% in 2023 and 4.1% in 2022.
Ponderay Newsprint Company (PNC) formerly owned an industrial site within the District’s service area and historically consumed approximately 70% of the District’s electric load. In June 2020, PNC ceased operations and declared Chapter 7 bankruptcy. Shortly after closure, the District received $10 million, representing the secured portion of the District’s claim and filed a claim for $22.2 million, representing the unsecured claim amount. In May 2023, the District received a partial interim distribution of $3.3 million, representing approximately 70% of the total anticipated funds to be received against the District’s unsecured claim. The District has deposited all funds received as unrestricted cash and has recorded a corresponding deferred revenue, and is amortizing the balance as revenue through December 2025.
The Electric System currently has one revenue bond outstanding with a final payment due January 1, 2031. The District’s bond covenants require a debt service coverage ratio of at least 1.25, and the District has exceeded its bond covenants the last three years with ratios of 20.08, 16.13, and 13.12 for 2023, 2022, and 2021, respectively. The District funds a rate stabilization account, the amount of which may be classified as revenue for debt service coverage purposes in the event that the District’s net operating revenues are insufficient to meet that year’s debt service coverage bond covenant. The funding for this account moves cash from unrestricted to restricted; there is no deferred revenue associated with this account and it is used only for the calculation of debt service coverage. The balance in this account was $10 million as of December 31, 2023, 2022, and 2021.
14
Management’s Discussion and Analysis
Public Utility District No. 1 of Pend Oreille County
Box Canyon Production System
The Box Canyon Production System produces hydroelectric power from the Box Canyon Project, the output of which is sold to the Electric System. The Box Canyon Project is located on the Pend Oreille River, is licensed by the Federal Energy Regulatory Commission (FERC) and was completed in 1956. As a run-ofthe-river project, Box Canyon uses water as it is available and has limited storage capability.
Revenues for the Box Canyon Production System are calculated based on the cash expenditures to operate the Project. This includes labor and materials required to run the facility, expenditures for environmental work related to the reservoir behind the Project, principal and interest on Box Canyon’s debt service, and payments for capital expenditures.
Box Canyon Production
as of December 31
System Financial Data
202320222021
Total assets and deferred outflows of resources226,477,926 $ 232,555,017 $ 237,563,719 $
Total liabilities and deferred inflows of resources171,116,636 178,204,071 182,014,944
Capital Assets
202320222021
Local and regional snowpack, the length of the spring thaw, and summer heat all affect Pend Oreille River water levels and the amount of power that the Box Canyon Project can produce.
The design and location of the Project necessitates the District to spill in high water conditions, which occurred in 2022. Box Canyon produced an annual average of 43.71 MW per hour in 2023, 51.39 MW per hour in 2022, and 54.24 MW per hour in 2021. Lower than average production at Box Canyon in 2023 was the result of poor water flow in the region during the year.
The Box Canyon Project experienced an unprecedented overspeed event in September 2022 when the Project’s Unit 4 turbine accelerated to free-flow speeds. Upon investigation, it was determined that the event was due to a governor valve failure. During 2023, two of the remaining 3 units also experienced
15
Net investment in capital assets 25,310,326 24,838,226 25,179,681 Restricted 15,124,935 14,476,459 13,801,458 Unrestricted 14,926,029 15,036,261 16,567,636
net position 55,361,290
54,350,946
55,548,775
Total
$
$
$
Hydroelectric plant and equipment 195,698,633 $ 194,905,222 $ 194,872,852 $ General plant 14,040,497 14,040,497 14,040,497 Total utility plant in service 209,739,130 $ 208,945,719 $ 208,913,349 $ Construction work in progress 59,904 65,423 5,610 Total gross utility plant 209,799,034 $ 209,011,142 $ 208,918,959 $ Long Term Debt 202320222021 Total debt outstanding 130,566,266 $ 135,136,804 $ 139,631,565 $ Changes in Net
202320222021 Operating revenues 19,753,651 $ 17,272,254 $ 14,097,885 $ Operating ex penses (15,169,238) (13,772,434) (11,065,965) Nonoperating revenues (ex penses) (3,574,069) (4,697,649) (5,158,183) Total change in net position 1,010,344 $ (1,197,829) $ (2,126,263) $
202320222021 Annual generation in megawatt hours382,919 450,197 475,133 Average generation in megawatt hours43.71 51.39 54.24 Cost per megawatt hour $51.57$38.35$29.66 Peak generation in megawatts 79 81 85
Position
Box Canyon Production Statistics
Management’s Discussion and Analysis
Public Utility District No. 1 of Pend Oreille County
issues with the governor valve, and the District has since replaced the valve on all four units. A number of rotor poles on Unit 4 were removed and repaired in early 2023, and the unit was placed back in service at the end of April. Total cost of the work was $1.1 million. As these costs were repairs and did not extend the life of the units, they were not capitalized and were recorded as maintenance expense in 2023.
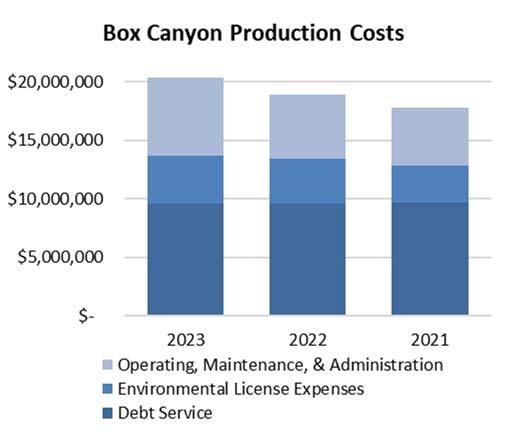
Operating expenses for the Box Canyon Production System include environmental work performed as required by FERC licensing conditions. The type and expense of environmental work will vary from year to year and consists of cultural studies, historical education, fisheries and streamrehabilitation projects, recreation and wildlife projects, and water quality programs on the Pend Oreille River. Included in these expenses are annual payments to the Kalispel Tribe of Indians in the amount of $2.3 million in 2023 and 2022 for environmental mitigation work on the Box Canyon Reservoir. Facilitated through a FERC license amendment and an off-license agreement, these payments are made in lieu of constructing downstream fish passage facilities at Box Canyon Dam and fish passage facilities at the Calispell Creek Pumping Plant, and constitute more than 50% of the District’s annual environmental expenditures.
The District began issuing bonds for the Box Canyon System in 2008 to fund construction projects included in the District’s FERC license, including upgrade of the Box Canyon turbines, modifications to the Box Canyon spillway, and construction of an upstream fish passage facility which was completed in 2021. At December 31, 2023, the District had $130.6 million in bond issuances outstanding, with final payment due in 2048. Principal and interest payments on the bonds accounted for 48.51%, 55.51%, and 68.81% of total Box Canyon production cost in 2023, 2022, and 2021, respectively.
The District’s bonds are rated by Fitch Ratings and Moody’s Investors Service. Fitch Ratings upgraded the District to an A rating with a stable outlook in July 2023, citing the District’s risk mitigation through power sale agreements as a primary driver of the upgrade from the previous A- rating. Moody’s Investor Service upgraded the District from a Baa2 rating to an A3 rating with a stable outlook in December 2023. Moody’s Investor Service also attributed the upgrade to agreements that address wholesale market and hydrologic risk as well as the District’s strong liquidity and financial metrics.
Water System
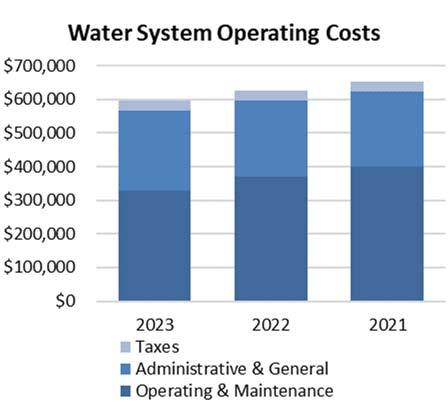
The District operates nine separate water systems throughout Pend Oreille County. The District is contractually obligated to maintain separate and distinct rates for each water system that reflect the individual system’s costs.
16
Public Utility District No. 1 of Pend Oreille County
Water
System
Financial Data
as of December 31 202320222021
Capital Assets
202320212020
in Net Position
The District provides utility water service to approximately 600 customers. Metaline Falls is the only District-owned system that serves an incorporated town. At 197 customers, it is the largest of the water systems that the District serves. The remaining systems serve small communities primarily located on the Pend Oreille River.
The District replaced approximately 5,100 feet of water piping for the Metaline Falls water system in 2023. The District was awarded funding for this project in 2019 as a sub-recipient through the Town of Metaline Falls from a Washington State Department of Commerce Community Development Block Grant. Total cost of the project was $838,732.
In 2022 and 2021, the District performed contracted Water Operator services to a water system owned by the town of Cusick. Cusick reimbursed the District for operations and administrative work performed, totaling $68,926 and $66,156 in other revenue for 2022 and
17 Management’s
Discussion and Analysis
assets and deferred outflows of resources5,710,075 $ 5,140,026 $ 5,376,892 $ Total liabilities and deferred inflows of resources744,586 723,497 838,323 Net investment in capital assets 5,045,691 4,527,279 4,649,277 Restricted 101,167 11,543 25,605 Unrestricted (181,369) (122,293) (136,313) Total net position 4,965,489 $ 4,416,529 $ 4,538,569 $
Total
Transmission and distribution 10,123,363 $ 9,281,798 $ 9,265,861 $ General plant 78,047 78,047 78,047 Total utility plant in service 10,201,410 9,359,845 9,343,908 Construction work in progress 45,631 153,865 109,922 Total gross utility plant 10,247,041 $ 9,513,710 $ 9,453,830 $ Long
202320212020 Total debt outstanding 273,785 $ 292,664 $ 340,313 $ Changes
202320222021 Operating revenues 617,237 $ 659,037 $ 630,781 $ Operating expenses (776,553) (810,892) (753,732) Nonoperating revenues (expenses) 708,276 29,815 308,284 Total change in net position 548,960 $ (122,040) $ 185,333 $ Number Water S ystem Statistics of Meters202320222021 Metaline Falls 197$80.00$77.00$77.00 Sandy Shores 73 50.0050.0045.00 Riverbend 82 100.0092.0087.00 Greenridge 29 88.0084.7583.00 Riverview 59 75.0065.0050.00 Sunvale 67 60.0060.0052.50 Lazy Acres 36 59.0056.0053.00 Holiday Shores 32 60.0055.0051.00 Granite/Sacheen 32 89.0084.5083.00 Monthly Basic Charge
Term Debt
Management’s Discussion and Analysis
Public Utility District No. 1 of Pend Oreille County
2021, respectively. The contract expired by its terms on December 31, 2022 and was not extended for the 2023 year.
The District reviews each Water System’s financial position each year with system representatives. Because each water system has a relatively small number of customers, capital projects, new debt, and even small repairs can necessitate a rate increase for a system.
Community Network System
The District began building a fiber optic based communications system in 1996 to allow high speed communications between the District’s electric equipment. The District subsequently extended use shortly thereafter to Pend Oreille County municipal customers, including schools, libraries, and hospital districts.
After receiving an American Recovery and Reinvestment Act grant in 2010, the District expanded its existing fiber backbone system with construction of fiber to individual homes and businesses in the southern part of Pend Oreille County. The District is currently a wholesale provider of broadband, and serves end users through local retail internet service providers.
Community Network System Financial Data
of December 31
Total assets and
Capital Assets
202320222021
Long Term Debt
Changes in Net Position
202320222021
202320222021
Communit y Network S ystem Statistics 202320222021
Standard class end users are residential and business customers that purchase basic broadband access through a Retail Service Provider. Premium class end users have greater bandwidth and a higher level of reliability and service response. Dark fiber leases allow access to the District’s fiber infrastructure while the customer provides electronics for system communication.
18
deferred outflows of resources25,269,101 $ 25,362,364 $ 26,334,381 $ Total liabilities and deferred inflows of resources4,961,671 4,948,769 5,544,708 Net investment in capital assets 18,005,255 18,873,896 20,574,210 Restricted 177,042 332,547 44,810 Unrestricted 2,125,133 1,207,152 170,653 Total net position 20,307,430 $ 20,413,595 $ 20,789,673 $
as
202320222021
Transmission and distribution 47,045,696 $ 46,367,754 $ 45,887,544 $ General plant 61,721 61,721 61,721 Total utility plant in service 47,107,417 46,429,475 45,949,265 Construction work in progress 406,712 244,363 128,008 Total gross utility plant 47,514,129 $ 46,673,838 $ 46,077,273 $
Total debt outstanding 1,205,667 $ 1,757,000 $ 1,945,333 $
Operating revenues 3,670,957 $ 3,415,707 $ 3,688,136 $ Operating expenses (3,912,751) (3,752,966) (3,368,453) Nonoperating revenues (expenses) 135,629 (38,819) (81,947) Total change in net position (106,165) $ (376,078) $ 237,736 $
Average fiber standard class end users2,7412,6172,451 Average wireless class end users 102123134 Average premium class connections576157 Standard class customer growth4.74%6.77%10.41%
Public Utility District No. 1 of Pend Oreille County
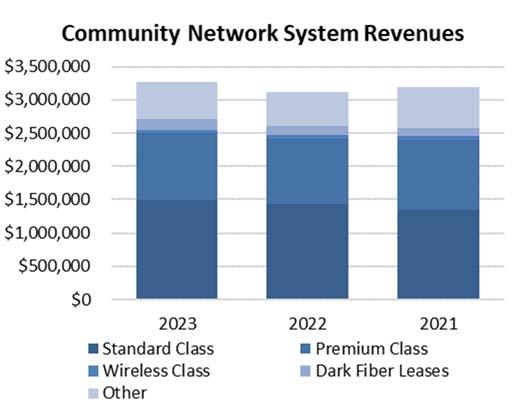
The Community Network System continued to steadily grow during 2023, adding both new construction line extensions and installation of services to existing homes that had previously not received service. Contributions in aid of construction of $349,611, $243,272, and $448,575 in 2023, 2022, and 2021, respectively, have offset costs of expanding fiber infrastructure. Expansion in the number of end users for the System has negated the need for rate increases for standard wholesale services.
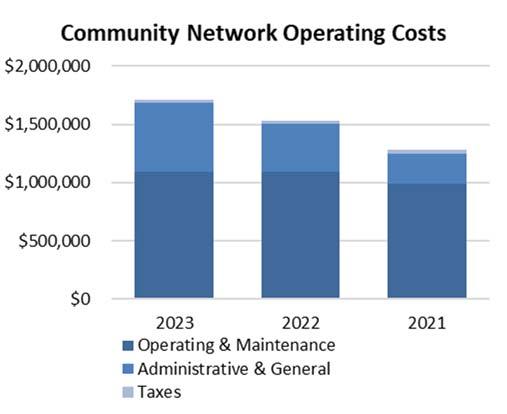
Operating expenses for the Community Network System have remained level over the past three years. As the System grows, so does the allocation of administrative and general expenses under the District’s cost allocation methodology, which accounts for the increase of those expenses for the System over the last three years. Depreciation remains the largest component of operating expenses at $2.30 million in 2023, $2.31 million in 2022, and $2.28 million in 2021.
In May 2023, the District loaned $500,000 to Northwest Open Access Network (NoaNet), a Washington nonprofit mutual corporation of which the District is a member. The loan is payable in five annual payments, and interest accrues at the monthly Local Government Investment Pool rate.
The Community Network System holds a revenue bond with a bank. Issued in 2017, the debt was used to partially repay inter-system debt to fund capital improvements for the system. The bond has a balance as of December 31, 2023 of $1,179,000 and is expected to be fully paid in four years. The Community Network System also carries an intersystem balance with the Electric System. This debt, which has a balance as of December 31, 2023 of $26,667, was originally issued to the Electric System in 2005 for communication infrastructure. Payment of the debt was transferred to the Community Network System upon the System’s creation in 2010.
Contacting the District’s Financial Management
The financial report is designed to provide interested parties with a general overview of the District’s finances and to demonstrate District accountability for the money it receives. For any questions about this report, or for additional or clarifying financial information, contact the District’s financial department as set forth on the last page of this Annual Report under Organizational Information—Corporate Office.
April D. Owen, CPA Director of Finance/Auditor
19
Management’s Discussion and Analysis
Assets and Deferred Outflows of Resources
Deferred Outflows of
Combined Total as of December 31,
20 Combined
Net Position
See accompanying notes Box Canyon Community ElectricProductionWaterNetwork SystemSystemSystemSystem 2023 2022 Current Assets Cash and cash equivalents Unrestricted 41,289,994 $ 15, 518,568 $ - $ 2, 948,942 $ 59,757,504 $ 47,051,418 $ Restricted 23,248,281 7, 062,490 - - 30,310,771 30,049,217 Restricted short-term investments1,011,411 10, 342,058 - - 11,353,469 10,820,985 Receivables Accounts and contracts, net 2,282,287 - 52,660 226,209 2,310,752 2,730,704 Other 2,225,779 222,926 - 143,946 2,592,651 2,383,126 Unbilled revenue 491,169 - 75,849 - 567,018 602,046 Materials and supplies 2,611,028 126 83,621 680,304 3,375,079 2,752,463 Prepaid expenses and other 103,865 36,450 - - 140,315 185,931 Due from other systems 347,794 - - - -Total current assets 73,611,608 33, 182,618 212,130 3, 999,401 110,407,559 96,575,890 Noncurrent
Contracts and notes receivable 1,622,326 - 1,025 410,077 412,006Leases receivable - - - 1, 034,708 1,034,708Nonutility plant 4,240,613 - - - 4,240,613 4,413,833 Licensing costs - regulatory asset - 36, 220,971 - - 36,220,971 38,034,968 Net pension asset 1,568,088 682,877 101,167 177,042 2,529,174 2,432,144 Total noncurrent assets 7,431,027 36, 903,848 102,192 1, 621,827 44,437,472 44,880,945 Utility Plant Land and land rights 7,760,021 789,950 77,305 61,721 8,688,997 8,688,997 Hydroelectric plant and equipment1,525,945 195, 698,633 - - 197,224,578 196,431,167 Structures, buildings and equipment129,587,492 - 10, 123,363 47,045,696 186,756,551 181,741,368 Intangible assets 1,223,391 13, 250,547 742 - 14,474,680 14,474,680 Construction work in progress 4,299,452 59,904 45,631 406,712 4,811,699 2,284,737 144,396,301 209, 799,034 10, 247,041 47,514,129 411,956,505 403,620,949 Less accumulated depreciation and amortization 85,315,907 54, 852,816 4, 927,565 27, 999,741 173,096,029 161,912,640 Net utility plant 59,080,394 154, 946,218 5, 319,476 19, 514,388 238,860,476 241,708,309 Total assets 140,123,029 225, 032,684 5, 633,798 25, 135,616 393,705,507 383,165,144
Statements of
Public Utility District No. 1 of Pend Oreille County
Assets
Resources Deferred amount on refinancing debt31,048 930,373 - - 961,421 1,058,809 Deferred pension outflows 1,182,292 514,869 76,277 133,485 1,906,923 2,052,280 Total deferred outflows of resources1,213,340 1, 445,242 76,277 133,485 2,868,344 3,111,089 Total asssets and deferred outflows of resources 141,336,369 $ 226,477,926 $ 5,710,075 $ 25, 269,101 $ 396,573,851 $ 386,276,233 $
Combined Total as of December 31, Liabilities, Deferred Inflows of Resources, and Net Position
Net Position
21 Combined
Net
Public
See accompanying notes Box Canyon Community ElectricProductionWaterNetwork SystemSystemSystemSystem 2023 2022 Current Liabilities Accounts payable 3,195,860 $ 157,237 $ 28,686 $ 6,692 $ 3,388,475 $ 2, 588,895 $ Accrued compensation and benefits2,140,864 - - - 2,140,864 2, 031,966 Accrued taxes 1,390,785 81,935 2,347 1,908 1,476,975 1, 268,160 Customer prepayments and deposits4,229,614 - 7,334 346,240 4,583,188 4, 636,502 Accrued bond interest 138,025 2, 962,490 852 - 3,101,367 3, 241,863 Current portion of long-term debt713,333 4, 100,000 15,165 189,000 5,017,498 5, 038,212 Current portion of licensing cost liability and unearned revenue3,261,290 2, 699,064 - 299,992 6,009,942 4, 734,687 Due to other systems - - 334,461 13,333 -Total current liabilities 15,069,771 10, 000,726 388,845 857,165 25,718,309 23,540,285 Other
Unearned revenue 14,324,073 - - 1, 893,221 14,609,206 15,420,262 Licensing costs liability - 33, 994,080 - - 33,994,080 36,073,230 Net pension liability 677,034 294,838 43,680 76,439 1,091,991 1, 400,008 Total other liabilities 15,001,107 34, 288,918 43,680 1, 969,660 49,695,277 52,893,500 Long-term
Revenue bonds 6,234,711 126, 466,266 - 990,000 133,690,977 139, 571,161 Other long-term debt 13,334 - 258,620 - 271,954 300,452 Due to other systems - - - 13,334 -Total long-term debt 6,248,045 126, 466,266 258,620 1, 003,334 133,962,931 139, 871,613 Total liabilities 36,318,923 170, 755,910 691,145 3, 830,159 209,376,517 216, 305,398 Deferred
of Resources Deferred pension inflows 828,335 360,726 53,441 93,522 1,336,024 2, 440,122 Deferred lease inflows - - - 1, 037,990 1,037,990Total deferred inflows of resources 828,335 360,726 53,441 1, 131,512 2,374,014 2, 440,122
Statements of
Position
Utility District No. 1 of Pend Oreille County
Liabilities
Debt
Inflows
Net investment in capital assets55,950,373 25, 310,326 5, 045,691 18, 005,255 104,311,645 100, 702,789 Restricted for Sullivan contract obligation 1,339,973 - - - 1,339,973 897,720 Debt service 1,711,411 14, 442,058 - - 16,153,469 15,645,985 Rate stabilization fund 10,000,000 - - - 10,000,000 10,000,000 Pensions 1,568,088 682,877 101,167 177,042 2,529,174 2, 432,144 Total restricted 14,619,472 15, 124,935 101,167 177,042 30,022,616 28,975,849 Unrestricted 33,619,266 14, 926,029 ( 181,369) 2, 125,133 50,489,059 37,852,075 Total net position 104,189,111 55, 361,290 4, 965,489 20, 307,430 184,823,320 167, 530,713 Total liabilities, deferred inflows of resources, and net position 141,336,369 $ 226,477,926 $ 5,710,075 $ 25, 269,101 $ 396,573,851 $ 386,276,233 $
Combined Statements of Revenue, Expenses, and Changes in Net Position
Combined Total
Year ended December 31,
Net Position
22 Combined Statements of Revenue, Expenses, and Changes in Net Position
Box Canyon Community ElectricProductionWaterNetwork SystemSystemSystemSystem2023 2022 Operating Revenues Sales to retail customers 55,870,795 $ - $ 599,595 $ 2,709,768 $ 59,180,158 $ 44,152,938 $ Sales to other utilities 35,880,650 - - - 35,880,650 37,006,292 Intersystem sales 221,783 19,746,451 - 554,700 -Contributed capital 1,971,954 - - 349,611 2,321,565 1,767,509 Other 619,846 7,200 17,642 56,878 380,266 684,355 Total operating revenues 94,565,028 19,753,651 617,237 3,670,957 97,762,639 83,611,094 Operating Expenses Power costs 63,790,542 146,930 - - 44,191,021 36,088,935 Operations and maintenance 7,045,224 8,599,248 328,471 1,089,389 16,103,292 14,666,101 Administrative and general 3,608,535 1,903,867 238,909 600,286 6,212,854 5,801,131 Taxes 3,388,319 87,335 29,926 20,048 3,525,628 2,599,479 Pension expense (credit) (845,549) (368,222) (54,551) (95,466) (1,363,788) (1,200,174) Depreciation and amortization 4,021,131 4,800,080 233,798 2,298,494 11,353,503 11,242,837 Total operating expenses 81,008,202 15,169,238 776,553 3,912,751 80,022,510 69,198,309 Net operating revenues (expenses)13,556,826 4,584,413 (159,316) (241,794) 17,740,129 14,412,785 Nonoperating Revenues (Expenses) Interest income 2,032,340 1,407,088 1,468 176,964 3,596,115 837,464 Interest on debt (162,224) (5,427,010) (3,574) (56,318) (5,649,126) (5,844,886) Subsidies on debt - 445,853 - - 445,853 507,427 Sullivan net revenue (expense) 261,533 - - - 261,533 (109,129) Grant revenue 20,844 - 732,127 - 752,971 92,970 Other, net 130,149 - (21,745) 14,983 145,132 20,312 Total nonoperating revenues (expenses)2,282,642 (3,574,069) 708,276 135,629 (447,522) (4,495,842) Change in net position 15,839,468 1,010,344 548,960 (106,165) 17,292,607 9,916,943 Accumulated
Beginning of year 88,349,643 54,350,946 4,416,529 20,413,595 167,530,713 157,613,770 End of year 104,189,111 $ 55,361,290 $ 4,965,489 $ 20,307,430 $ 184,823,320 $ 167,530,713 $
Public Utility District No. 1 of Pend Oreille County See accompanying notes
Combined Total Year ended December 31,
Payments to suppliers for goods and services
Cash Flows from Noncapital Financing Activities
Receipts from nonoperating assets
Net cash from noncapital financing activities
Cash Flows From Capital and Related Financing Activities
Acquisition and construction of capital assets
Net
from
and related financing activities
Cash Flows from Investing Activities
Interest on investments, contracts, and notes
23
See
Box Canyon Community ElectricProductionWaterNetwork Combined Statements of Cash Flows SystemSystemSystemSystem2023 2022 Cash Flows from Operating Activities Receipts from customers 59,113,120 $ - $ 601,073 $ 2,967,326 $ 62,681,519 $ 45,992,441 $ Receipts from other operating revenues35,975,900 10,800 - - 35,986,700 37,140,510 (48,999,863) (6,864,990) (303,348) (132,379) (56,300,580) (47,125,282) Payments to employees for services(8,082,963) (3,662,044) (233,081) (1,023,303) (13,001,391) (12,416,475) Payments from (to) other systems(19,692,252) 19,401,960 45,613 244,679 -Net cash from operating activities 18,313,942 8,885,726 110,257 2,056,323 29,366,248 23,591,194 426,995 - - - 426,995 57,952 Receipts from government agencies135,221 - - 14,983 150,204Proceeds from grant funding 35,113 - - - 35,113 11,611 Intersystem financing 262,234 - (20,277) (241,957) -859,563 - (20,277) (226,974) 612,312 69,563 (6,506,413) (821,732) (733,331) (840,290) (8,901,766) (7,960,522) Proceeds from sale of assets 44,417 19,260 - - 63,677 13,600 Proceeds from grant funding - - 665,860 - 665,860 34,303 Intersystem transfers 22,500 (22,500) - - -Payments on revenue bonds (665,000) (3,985,000) - (538,000) (5,188,000) (4,700,000) Interest paid on revenue bonds (292,675) (6,015,487) - (89,628) (6,397,790) (6,553,362) Subsidy received on revenue bonds - 236,818 - - 236,818 507,427 Payments on notes payable (13,333) - (18,879) - (32,212) (60,983) Interest paid on notes payable - - (3,630) - (3,630) (4,183) (7,410,504) (10,588,641) (89,980) (1,467,918) (19,557,043) (18,723,720)
Purchases of investments (47,436) (485,048) - - (532,484) (129,971) Loan receivable - - - (500,000) (500,000)2,012,063 1,407,088 - 159,456 3,578,607 837,465 Net cash from investing activities 1,964,627 922,040 - (340,544) 2,546,123 707,494 Net Change in Cash and Cash Equivalents 13,727,628 (780,875) - 20,887 12,967,640 5,644,531 Cash and Cash Equivalents Beginning of year 50,810,647 23,361,933 - 2,928,055 77,100,635 71,456,104 End of year 64,538,275 $ 22,581,058 $ - $ 2,948,942 $ 90,068,275 $ 77,100,635 $
Combined Statements of Cash Flows Public Utility District No. 1 of Pend Oreille County
accompanying notes
cash
capital
Reconciliation of Net Operating Revenues (Ex penses) to Cash Flows from Operating Activitie s
Adjustments to reconcile net operating revenues (ex penses) to net cash from
Combined Total Year ended December 31, operating activities:
Supplemental Disclosure of Noncash Activities
Construction costs included in accounts payable
Public Utility District No. 1 of Pend Oreille County See accompanying notes
24
Combined Statements of Cash Flows
Box Canyon Community ElectricProductionWaterNetwork SystemSystemSystemSystem2023 2022 Net operating revenues (expenses) 13,556,826 $ 4,584,413 $ ( 159,316) $ ( 241,794) $ 17,740,129 $ 14,412,785 $ Depreciation and amortization 4,021,131 4,800,080 233,798 2, 298,494 11,353,503 11,242,837 Changes in operating assets and liabilities Receivables 488,633 26,422 27,491 (35, 107) 507,439 695,718 Unbilled revenue 110,877 - - - 110,877 (223,133) Due to (from) other systems (69,160) - 69,160 - -Materials and supplies (535,888) 36,085 (30,628) 243,169 (287,262) 157,385 Prepaid expenses and other current assets 7,547 38,069 - - 45,616 (79,062) Unearned revenue 507,581 - - (49, 588) 457,993 (2,049,588) Deferred relicensing costs - (251,187) - - (251,187) (2,340,665) Pension (845,549) (368,222) (54,551) (95, 466) (1,363,788) (1,200,174) Accounts payable, customer deposits, and prepayments 746,948 35,515 24,283 (63, 525) 743,221 2,376,844 Accrued compensation, benefits, and taxes 324,996 (15,449) 20 140 309,707 598,247
cash from operating activities 18,313,942 $ 8,885,726 $ 110,257 $ 2, 056,323 $ 29,366,248 $ 23,591,194 $ $ 632, 209 $ 26,204 $ 33,427 $ 10, 342 $ 702, 182 $ 520,268
Net
Public Utility District No. 1 of Pend Oreille County
Note 1 - Organization and Significant Accounting Policies
Organization - Public Utility District No. 1 of Pend Oreille County, Washington (the District) is a municipal corporation governed by an elected three-person board of commissioners. The District’s reporting entity consists of four primary component units, or operating systems. The Electric System distributes electricity to residential and other consumers in Pend Oreille County. The Box Canyon Production System produces hydroelectric power from the Box Canyon Hydroelectric Project (the Box Canyon Project). The Water System consists of nine individual water distribution subdivisions. The Community Network System supplies wholesale broadband communication services. The District is required by various financing and contractual arrangements to report separately on each system and maintain each system as a separate entity with separate obligations.
As required by generally accepted accounting principles (GAAP), management has considered all potential component units in defining the reporting entity and has no additional component units.
Basis of accounting and presentation - The accounting policies of the District conform to GAAP as applicable to proprietary funds of governments. The Governmental Accounting Standards Board (GASB) is the accepted standard-setting body for establishing governmental accounting and financial reporting principles. The District has applied all applicable GASB pronouncements. Accounting records are maintained in accordance with methods prescribed by the State Auditor under the authority of the Revised Code of Washington, Chapter 43.09; the Uniform System of Accounts prescribed by the Federal Energy Regulatory Commission (FERC) for the Electric System, Box Canyon Production System, and Community Network System; and the Uniform System of Accounts for Class C Water Utilities prescribed by the National Association of Regulatory Utility Commissioners for the Water System.
System columns presented in the financial statements do not sum to the combined totals due to the elimination of certain intersystem transactions. These transactions relate to intersystem power and broadband sales and purchases, loan balances and interest on intersystem loans, and intersystem administrative charges.
A summary of other significant accounting policies used in the preparation of the combined financial statements follows.
New accounting standards – In March 2020, the GASB issued Statement No. 94, Public-Private and PublicPublic Partnerships and Availability Payment Arrangements, effective for fiscal years beginning after June 15, 2022. The District has determined that it does not have arrangements subject to the provisions of GASB 94 for the years ended December 31, 2023 and 2022.
In May 2020, the GASB issued Statement No. 96, Subscription-Based Information Technology Arrangements (SBITA), which are defined as a contract that conveys control of the right to use another party’s information technology software. This statement is effective for fiscal years beginning after June 15, 2022. The District implemented this standard in 2023 without material impact to the financial statements.
Revenue recognition and unbilled revenue - The Electric System, Water System, and Community Network System recognize revenue as earned on a monthly basis based on rates established by the District’s board of commissioners. The District estimates unbilled revenues for energy delivered to customers between their last respective meter reading date and December 31, and records that amount as unbilled revenue for the
25 Notes to Combined Financial Statements
Public Utility District No. 1 of Pend Oreille County
current year. The Box Canyon Production System recognizes revenue on a cost-of-service basis from sales to the Electric System.
The District recognizes unbilled revenue for reimbursable grant costs that have been expended but not yet submitted for reimbursement as of year end. The unbilled revenue amount for the year ended December 31, 2023 was $69,192 for the Metaline Falls Water System and $6,657 for the Sunvale Water System. There was no unbilled revenue for these water systems for the year ended December 31, 2022.
Allowance for uncollectible accounts - Management reviews accounts receivable on a regular basis to determine whether any receivables will potentially be uncollectible. The allowance for uncollectible accounts includes amounts estimated through an evaluation of specific accounts, based on the best available facts and circumstances of customers who may be unable to meet their financial obligations, and a reserve based on historical experience. The reserve amount for the Electric System for the years ended December 31, 2023 and 2022 was $15,000.
Cash and cash equivalents - For purposes of the combined statements of cash flows, the District considers all highly liquid investments with a maturity of three months or less when purchased to be cash equivalents.
Restricted cash and investments - Restricted cash and investments are amounts designated by third parties for a specific purpose (Note 2). Examples of these assets include amounts held to pay debt service, bond funds designated for construction, and deposits made by vendors.
Investments - The District records investments at fair value based on quoted market rates, with changes in fair value reported as investment income.
Materials and supplies - Materials and supplies are recorded at average cost.
Utility plant - Utility plant assets are stated at cost. Betterments and major renewals over $25,000 are capitalized, whereas maintenance and repairs are charged to operations as incurred. Depreciation is determined by the straight-line method over the estimated useful lives of the related assets, which range from 5 to 50 years. Composite rates are used for asset group depreciation, and, accordingly, no gain or loss is recorded on the disposition of an asset unless it represents a large and unusual retirement.
Nonutility plant - Nonutility plant represents capital assets that do not directly relate to the District’s primary business purposes (Note 8).
Contributed capital - Contributions in aid of construction are District-mandated customer connection charges used to fund construction of system properties necessary to extend service to a new customer. The payments are initially recorded as liabilities (customer prepayments and deposits), and then reclassified to operating revenue (contributed capital) when the associated facilities are constructed or acquired.
Licensing costs liability - Certain Box Canyon FERC licensing conditions require payments to various outside entities for projects and operating costs that will not be directed by, or controlled by, the District. The District has estimated and present valued these payments over the 50-year license and recorded them as a regulatory asset and licensing costs liability. The present value balance was $36,220,971 and $38,034,968 as of December 31, 2023 and 2022, respectively.
The District has not recorded the future costs of the remaining expenses related to license implementation that will be capitalized or expensed, as may be appropriate, when incurred.
26 Notes to Combined Financial Statements
Public Utility District No. 1 of Pend Oreille County
Unamortized bond discounts and premiums - Unamortized bond discounts and premiums are amortized to interest expense, using the effective interest method, over the term of the bonds (Note 4). The excess of costs incurred over the carrying value of bonds refunded on early extinguishment of debt is amortized to expense over the shorter of the remaining life of the old bonds or the life of the new issue and recorded as deferred outflows of resources.
Unearned revenue - In August 2000, the District entered into an agreement with Seattle City Light concerning a cost-sharing arrangement for building fiber optic communications capability in Pend Oreille County. Among other terms and conditions, the District retained ownership of all constructed network assets with a commitment to grant Seattle City Light a 30-year right-of-use for 8 to 12 dark fiber strands along the District’s network backbone. Seattle City Light made a one-time, lump-sum payment of $1,487,650 under the agreement. The District recorded this payment as unearned revenue and is amortizing the balance to Community Network System revenue on a straight-line basis over the 30-year life of the agreement. The unamortized balance was $334,721 and $384,309 as of December 31, 2023 and 2022, respectively.
The Community Network System unearned revenue includes an Electric System $4.25 million prepayment for future broadband services. Funds from the Electric System were used by the Community Network System as the matching cash requirement of an American Recovery and Reinvestment Act grant. The unamortized balance associated with this payment was $1,858,492 and $2,087,116 as of December 31, 2023 and 2022, respectively.
In June 2013, the District signed a Memorandum of Agreement between the District and the State of Washington Department of Ecology Office of Columbia River that committed the District to release water from Sullivan Lake according to predetermined periods and amounts, allowing for improved water access for communities along the Columbia River. The Office of Columbia River paid the District $14 million, which was recorded as unearned revenue, and is being recognized as nonoperating revenue in an amount equal to the net cash outflow for Sullivan Project-related activities each year. The unamortized balance as of December 31, 2023 and 2022 was $11,077,783 and $11,085,541, respectively.
The Ponderay Newsprint Company previously posted $10 million with the District as contract security. Upon Ponderay Newsprint Company’s closure, the District deposited the $10 million as unrestricted funds and is amortizing the balance on a straight-line basis through the December 31, 2025 expiration date of the replacement Shell Energy North America agreement (Note 5). During 2023, the District received $3,343,441 as a partial payment of Ponderay Newsprint Company unsecured creditor bankruptcy funds. The District applied the same methodology to this receipt, depositing the money as unrestricted funds and amortizing the balance over the remaining life of the Shell Energy North America agreement. The unamortized balance as of December 31, 2023 and 2022 was $6,507,580 and $6,000,000, respectively.
Leases – For material, noncancelable leases with a term greater than 12 months, the District recognizes a right-to-use asset and lease liability for leases in which the District is a lessee, and a lease receivable and deferred inflow of resources for leases in which the District is a lessor. The District is not currently a lessee for any material, noncancelable leases.
The District is a lessor of land and pole space, primarily leasing to telecom entities which allows them to provide services to networks. The District has lessor agreements with remaining maximum contract terms ranging from 10 to 22 years. The agreements are recorded at their present value of $1,069,588 as a lease
27 Notes to Combined Financial Statements
Public Utility District No. 1 of Pend Oreille County
receivable. For the year ended December 31, 2023, the District recognized $63,429 of lease revenue and $42,182 in interest income related to these agreements.
SBITA – For material, noncancelable SBITAs with a term greater than 12 months, the District recognizes a SBITA asset and SBITA liability in accordance with GASB Statement 96. The District did not have any material SBITA arrangements as of December 31, 2023 and 2022.
Net investment in capital assets - This component of net position consists of capital assets, net of accumulated depreciation; borrowed monies not yet spent, as held in restricted construction and acquisition funds; and outstanding debt balances related to the purchase or construction of capital assets.
Restricted net position - Amounts presented as restricted net position are constrained by provisions imposed by external parties and cannot be used for normal operations. Balances currently classified as restricted include funds reserved for the operation and maintenance of a non-utility asset, bond principal and interest due for the upcoming year, less unfunded accrued interest; bond reserve funds; net pension assets held with the Department of Retirement Systems; and funds reserved for use in the event that the District loses a major source of revenue.
Unrestricted net position - Amounts included as unrestricted net position do not meet the definition of either net investment in capital assets or restricted net position and are used for normal operations.
Compensated absences - Employees accrue personal leave to be used for vacation, sick, and family leave purposes. Annual leave granted to each employee varies in accordance with years of service and may be carried forward from year to year, capped at a maximum bank of 1,200 hours for employees hired before April 2011 or 700 hours for employees hired after March 2011. The District records the cost of personal leave as earned, not as taken.
Accounting estimates - The preparation of financial statements in conformity with accounting principles generally accepted in the United States requires management to make estimates and assumptions that affect the reported amount of assets and liabilities and disclosure of contingent assets and liabilities at the date of the financial statements and the reported amounts of revenues and expenses during the reporting period. Actual results could differ from those estimates.
Significant risks and uncertainties - The District is subject to certain business risks that could have a material impact on future operations and financial performance. These risks include weather and naturaldisaster-related disruptions; collective bargaining labor disputes; changing local and national economic conditions; fish and other Endangered Species Act issues; Environmental Protection Agency regulations; reliability standards issued by the North American Electric Reliability Corporation; federal government regulations or orders concerning the operation, maintenance, licensing, and license surrender of hydroelectric facilities; the financing and completion of significant capital projects; changing federal and state laws, regulations, and requirements; and market and credit risks inherent in buying and selling of power, a commodity with inelastic demand characteristics and minimal storage capability.
Reclassifications - Certain reclassifications may be made to the prior-year financial statement presentation to conform to the current-year presentation.
28 Notes
Financial Statements
to Combined
Public Utility District No. 1 of Pend Oreille County
Note 2 - Cash and Investments
Cash and investments are recorded in accounts as required by the District’s bond indentures. Restricted assets represent accounts that are restricted by bond covenants or third-party contractual agreements.
As of December 31, 2023, the District held the following cash and investments:
The table below reconciles the cash, cash equivalents and investments to the combined statements of net position:
Interest rate risk - The District’s investment policy limits investment maturities to less than five years from the date of purchase unless authorized by the General Manager and Director of Finance for a specific purpose. During 2023 and 2022, investments were held in the State Treasurer’s Local Government Investment Pool (LGIP) or money market funds, described more fully in the following paragraph.
Credit risk - In accordance with the Revised Code of Washington, District bond resolutions, and District internal investment policies, all investments are held in money market funds invested in U.S. government debt securities, deposits in the LGIP, or deposits with financial institutions recognized as qualified public depositories of the state of Washington. U.S. government money market funds are held by bank trust departments as the District’s agent and in the District’s name.
The District’s cash deposits are covered by the Federal Deposit Insurance Corporation (FDIC) or protected against loss by deposit with financial institutions recognized as qualified public depositories of the state of Washington under the guidelines of the Washington State Public Deposit Protection Commission (PDPC). The District intends to hold time deposits and securities until maturity.
Concentration of credit risk - District policies allow the entire portfolio to be invested in direct U.S. government guaranteed obligations or in the LGIP. No other investment may exceed half of portfolio
29 Notes
Financial Statements
to Combined
Box Canyon Community ElectricProductionWaterNetwork Type SystemSystemSystemSystem20232022 Cash deposits 52,128,019 $ 1,274,231 $ - $ 2,948,942 $ 56,351,192 $ 45,059,049 $ Local government investment pool12,410,256 21,306,827 - - 33,717,083 32,041,586 Money market funds 1,011,411 10,342,058 - - 11,353,469 10,820,985 Total Cash and Investments 65,549,686 $ 32,923,116 $ - $ 2,948,942 $ 101,421,744 $ 87,921,620 $ Combined Total as of December 31, Box Canyon Community ElectricProductionWaterNetwork SystemSystemSystemSystem 20232022 Unrestricted cash & cash equivalents Revenue funds 41,289,994 $ 15,518,568 $ - $ 2,948,942 $ 59, 757,504 $ 47, 051,418 $ Restricted cash & cash equivalents Bond principal and interest 838,025 7,062,490 - - 7, 900,515 8, 065,956 Contract obligation 12,410,256 - - - 12, 410,256 11, 983,261 Rate stabilization 10,000,000 - - - 10, 000,000 10, 000,000 Subtotal 23,248,281 $ 7,062,490 $ - $ - $ 30, 310,771 $ 30, 049,217 $ Restricted short-term investments Bond reserve 1,011,411 $ 10,342,058 $ - $ - $ 11, 353,469 $ 10, 820,985 $ Total Funds 65,549,686 $ 32,923,116 $ - $ 2,948,942 $ 101,421,744 $ 87,921,620 $ Combined
December
Total as of
31,
Public Utility District No. 1 of Pend Oreille County
market value. The LGIP, a 2a7-like pool as defined by GASB Statement No. 31 and the Securities and Exchange Commission, invests in high-quality, short-term investments and is administered by the State Treasurer. The LGIP weighted-average maturity must not exceed 60 days and no single investment may exceed 762 days in maturity. The LGIP annual comprehensive financial report is available on the State Treasurer’s website at: https://tre.wa.gov.
Custodial credit risk - The District’s deposits are held by public depositories authorized by the PDPC and are not subject to custodial credit risk because state law requires public depositories to fully collateralize their public entity deposits.
Bond principal and interest accounts - For each debt issue, the District is required by bond resolutions to maintain principal and/or sinking fund and interest accounts within the bond funds to provide for the next semi-annual interest and annual principal/sinking fund payments falling due, which are reported as current assets. All bond funds are restricted by bond resolution to the payment of debt service obligations.
Bond reserve funds - Box Canyon Production System and Electric System revenue bond resolutions require that reserve accounts be maintained within the bond funds. The 2019 Electric System reserve account requires a deposit equal to 10% of the stated principal amount. The reserve requirement for all Box Canyon Bonds is the sum of the reserve requirement for each series, currently equal to the maximum annual debt service. All deposits are currently held in money market funds.
Contract obligation - The District is obligated through a Memorandum of Agreement to release water from Sullivan Lake. In exchange, the District has received funds from the Office of Columbia River (Note 8). Monies received are restricted to construction and operations and maintenance activities related to Sullivan Lake and associated facilities.
Rate stabilization – The District’s bond resolutions allow for the creation of a rate stabilization account within the District’s revenue funds to affect the calculation of the District’s bond debt service coverage covenant requirement. Monies deposited into the account are subtracted from net revenues used in the calculation of debt service coverage in the year deposited, and are added to net revenues in years that money is withdrawn from the account.
Investments – The District holds investments that are measured at fair value as of December 31, 2023 and 2022. The District categorized its fair value measurements within the fair value hierarchy established by GAAP. The hierarchy is based on the valuation inputs used to measure the fair value of the asset. Level 1 inputs are quoted prices in active markets for identical assets, level 2 inputs are significant other observable inputs, and level 3 inputs are significant unobservable inputs. Investments in an external government investment pool, such as LGIP, are not subject to reporting within the level hierarchy.
Investments by fair value level
Money market funds
Total as of December 31, 2023
Total as of December 31, 2022
Quoted prices in active markets for identical assets (Level 1) 11,353,469 $ 10,820,985 $ Significant other observable inputs (Level 2) - -
unobservable inputs (Level 3)
30 Notes to Combined Financial Statements
-
11,353,469
10,820,985
Significant
Total Investments
$
$
Public Utility District No. 1 of Pend Oreille County
Note 3 - Utility Plant
The following changes occurred in the District’s utility plant for the years ended December 31, 2023 and 2022:
Note 4 - Long-Term Debt
During the year ended December 31, 2023 the following changes occurred in long-term debt:
31 Notes to Combined Financial Statements
2022 BalanceAdditions Retirements/ Transfers2023 Balance Land and land rights 8,688,997 $ - $ - $ 8,688,997 $ Hydroelectric plant and equipment196,431,167 - 793,411 197,224,578 Structures, buildings, and equipment181,741,368 - 5,015,183 186,756,551 Intangible assets 14,474,680 - - 14,474,680 Construction work in progress 2,284,737 8,924,266 (6,397,304) 4,811,699 403,620,949 8,924,266 (588,710) 411,956,505 Less accumulated depreciation and amortization 161,912,640 11,353,503 (170,114) 173,096,029 Net Utility Plant 241,708,309 $ (2,429,237) $ (418,596) $ 238,860,476 $ 2021 BalanceAdditions Retirements/ Transfers2022 Balance Land and land rights 4,421,497 $ 4,267,500 $ - $ 8,688,997 $ Hydroelectric plant and equipment196,398,797 - 32,370 196,431,167 Structures, buildings, and equipment178,926,800 - 2,814,568 181,741,368 Intangible assets 14,179,602 - 295,078 14,474,680 Construction work in progress 1,938,505 3,710,282 (3,364,050) 2,284,737 395,865,201 7,977,782 (222,034) 403,620,949 Less accumulated depreciation and amortization 150,522,171 11,242,837 147,632 161,912,640 Net Utility Plant 245,343,030 $ (3,265,055) $ (369,666) $ 241,708,309 $ Amounts Electric System Balance Balancedue within Issue Dec 31, 2022AdditionsReductionsDec 31, 2023one year 2019 Revenue Refunding Bonds 7,290,000 $ - $ 665,000 $ 6,625,000 $ 700,000 $ Due in annual installments through January 1, 2031; interest at 3.00% - 5.00%. Subtotal 7,290,000 $ - $ 665,000 $ 6,625,000 $ 700,000 $ Unamortized premiums (discounts) 433,357 - 123,646 309,711Other long-term debt 40,000 - 13,333 26,667 13,333 Total Debt: 7,763,357 $ - $ 801,979 $ 6,961,378 $ 713,333 $
Public Utility District No. 1 of Pend Oreille County
Box Canyon Production System
Due in annual installments through January 1, 2030; interest at 0.834%4.571% and sub j ect to subsid y p a yment.
2018 Revenue and Refunding Bonds
Due in annual installments through 2048; interest at 5%.
2019 Revenue Refunding Bonds
Due in annual installments through 2041; interest at 3.0 - 5.0%.
The District’s Electric System and Box Canyon Production System revenue bonds require the District to establish, maintain, and collect Electric System rates adequate to provide net revenues in an amount equal to at least 1.25 times the annual principal and interest due for each revenue bond. Box Canyon Production System revenue bonds are secured by revenues of the Electric System.
Department of
Due in annual installments through October 2043; interest at 1.25%.
De partment of Health Loan
Due in annual installments through October 2044; interest at 1.25%.
Granite Shores Water S ystem
Public Works Board Loans
Due in annual installments through October 2026; interest at 1%.
In April 2022, the District executed a loan agreement with Washington State Department of Health Drinking Water State Revolving Fund to fund upgrades to the Sunvale Water System. The loan amount will be based on the total project cost, but is not to exceed $585,428, carries an interest rate of 1.25%, and is due in October 2045. The loan has a principal forgiveness of 50%. The District has expended $13,314 to date, but has not yet submitted a request for reimbursement and therefore no liability has been recorded as of December 31, 2023. To adhere to the matching principle, the District has recorded half of the expenditures as grant revenue, which was $6,657 for the year ended December 31, 2023.
32 Notes to Combined Financial Statements
Amounts
Balance Balancedue within Issue Dec 31, 2022AdditionsReductionsDec 31, 2023one year
Renewable Energy Bonds 18,130,000 $ - $ 2,200,000 $ 15,930,000 $ 2,225,000 $
2012 Clean
78,510,000 - 1,785,000 76,725,000 1,875,000
30,640,000 - - 30,640,000 -
127,280,000 $ - $ 3,985,000 $ 123,295,000 $ 4,100,000 $ Unamortized bond premiums 7,936,739 - 600,519 7,336,220Unamortized bond discount (79,935) - (14,981) (64,954)Total Debt: 135,136,804 $ - $ 4,570,538 $ 130,566,266 $ 4,100,000 $ Amounts Water
Balance Balancedue within Issue Dec 31, 2022AdditionsReductionsDec 31, 2023one year Riverview Water S ystem 226,892 $ - $ 10,805 $ 216,087 $ 10,804 $
Riverview
54,530 - 2,479 52,051 2,479
Subtotal
System
Health Loan
Water S ystem
11,242 - 5,595 5,647 1,882
Total Debt: 292,664 $ - $ 18,879 $ 273,785 $ 15,165 $
Public Utility District No. 1 of Pend Oreille County
Network System
Due in semi-annual installments through January 1, 2027; interest at 3.88%.
Scheduled debt service requirements to maturity are as follows:
Note 5 - Power Purchase Contractual Agreements
Shell Energy North America - In late 2020, the District entered into a five-year agreement with Shell Energy North America (US), L.P. (Shell) effective January 1, 2021. Under the agreement, the District sells to Shell all power generated by the Box Canyon Project on a specified-source basis, as well as energy received from Seattle City Light under the Boundary Power Assignment Agreement, and the District purchases from Shell firm energy in monthly blocks, the amounts of which are intended to match the District’s forecasted monthly energy load. The net transaction results in fixed payments from Shell to the District over the five-year
33 Notes
Financial Statements
to Combined
Amounts Community
Balance Balancedue within
Dec 31, 2022AdditionsReductionsDec 31, 2023one year 2017 Revenue Bonds 1,717,000 $ - $ 538,000 $ 1,179,000 $ 189,000 $
Issue
Subtotal 1,717,000 $ - $ 538,000 $ 1,179,000 $ 189,000 $ Due to other systems 40,000 - 13,333 26,667 13,333 Total Debt: 1,757,000 $ - $ 551,333 $ 1,205,667 $ 202,333 $ InterestPrincipalTotalInterestPrincipalTotal 2024 258,550 713,333 971,883 5,829,478 4,100,000 9,929,478 2025 222,675 748,334 971,009 5,631,188 4,305,000 9,936,188 2026 185,050 770,000 955,050 5,417,400 4,440,000 9,857,400 2027 145,550 810,000 955,550 5,191,775 4,585,000 9,776,775 2028 104,050 850,000 954,050 4,958,900 4,730,000 9,688,900 2029-2033125,700 2,760,000 2,885,700 21,368,050 24,690,000 46,058,050 2034-2038 - - - 15,279,625 29,105,000 44,384,625 2039-2043 - - - 7,783,175 27,255,000 35,038,175 2044-2048 - - - 2,608,875 20,085,000 22,693,875 Totals 1,041,575 $ 6,651,667 $ 7,693,242 $ 74,068,466 $ 123,295,000 $ 197,363,466 $ InterestPrincipalTotalInterestPrincipalTotal 2024 3,408 15,165 18,573 22,873 189,000 211,873 2025 3,224 15,165 18,389 34,745 386,000 420,745 2026 3,039 15,165 18,204 19,633 400,000 419,633 2027 2,854 13,283 16,137 3,958 204,000 207,958 2028 2,688 13,283 15,971 - -2029-203310,947 66,415 77,362 - -2034-20386,796 66,415 73,211 - -2039-20432,645 66,415 69,060 - -2044 31 2,479 2,510 - -Totals 35,632 $ 273,785 $ 309,417 $ 81,209 $ 1,179,000 $ 1,260,209 $
ystem
ystem
Electric System Box Canyon Production System Communit y Network S
Water S
Public Utility District No. 1 of Pend Oreille County
period. The total fixed payments for the years ended December 31, 2023 and 2022 were $15,506,873 and $16,199,171.
Seattle City Light, Boundary Hydroelectric Project – Seattle City Light owns and operates Boundary Hydroelectric Project (Boundary) located in northern Pend Oreille County. In Boundary’s previous FERC license, Seattle City Light was required to assign to the District up to 48 megawatts of energy and capacity at cost, based on the District’s weekly system load factor. After the Boundary Project was issued a new 42year FERC license in March 2013, Seattle City Light and the District entered into a contract in 2014 (the Boundary Power Assignment Agreement) that continues to obligate Seattle City Light to deliver up to 48 megawatts of energy and capacity to the District, along with a pro rata share of the Boundary Project’s environmental attributes. The agreement term corresponds with Boundary’s FERC license and expires in 2055; however, the District’s position is that the assignment requirement would continue beyond expiration of the agreement.
In February 2021, Seattle City Light and the District entered into a settlement agreement to resolve several disputes regarding the Boundary Power Assignment Agreement, including disputes over environmental attributes of the Boundary Project. The settlement agreement term runs through December 31, 2029, after which the Boundary Power Assignment Agreement will operate as it existed prior to the settlement agreement, unless otherwise agreed by the parties. In exchange for the District waiving its right to environmental attributes of Boundary Dam for the 9-year term, the settlement agreement removes the load-factor calculus, establishes a fixed schedule of shaped monthly power deliveries, and fixes an annual cost escalator for the District’s cost share.
Bonneville Power Administration – Effective October 1, 2011, the District renewed take or pay power purchase contracts with Bonneville Power Administration (BPA) which run through September 30, 2028. The District receives Shaped Block purchases which are predetermined monthly levels of power delivered consistently throughout the month. Average annual power allocations are based on total forecasted retail load less the District’s dedicated resources, and are subject to a cap based on regional critical water levels. No deliveries are received for the fiscal year if the District’s resources are considered sufficient to meet the District’s expected load, which occurred during the 2020-2021 fiscal year after Ponderay Newsprint ceased operations. The average hourly power received for the 2022-2023 fiscal year was 24.58 MW, and is 11.52 MW for the 2023-2024 fiscal year.
Ponderay Newsprint Company – In July 1986, the Electric System entered into power sales contracts with Ponderay Newsprint Company (PNC) to supply power to a fiber mill and paper plant. The District was obligated to provide all power necessary to operate both the fiber mill and paper plant, historically representing 70% of Electric System retail energy deliveries. Power delivery under these contracts was set to expire in 2027.
In June 2020, PNC closed its operations and declared chapter 7 bankruptcy. The District promptly requested and received the full, unrestricted value of PNC’s $10 million cash collateral in satisfaction of the secured portion of the District’s claim. The District also filed a claim for $22,263,471, representing the unsecured amount of the District’s claim. In May 2023, the District received a partial interim distribution against the District’s unsecured claim of $3,343,441 from the bankruptcy estate. An additional $1,395,333 was received in January 2024, and the District anticipates a small final payment in mid-2024 as the estate is closed.
34 Notes
Financial
to Combined
Statements
Public Utility District No. 1 of Pend Oreille County
Allrise Capital Inc. – In April 2021, the PNC site was auctioned as part of the bankruptcy proceedings. The successful bidder was Allrise Capital Inc. (Allrise), purchasing the property for $18.1 million through its wholly owned subsidiary, Ponderay Real Estate, LLC. Allrise began cryptomining operations at the site in December 2021.
In August 2022, the District entered into a contract with Cascade Digital Mining, LLC (Cascade) for continued cryptomining operations at the site. The District understands Cascade to be a joint venture comprised of majority-owner Merkle Standard Infrastructure LLC, which is a wholly-owned subsidiary of Allrise, and Bitmain Delaware Holding Company, Inc., a subsidiary of Bitmain which is a large cryptomining equipment manufacturer. The 13-month contract, effective September 1, 2022, supplied Cascade up to 100 MW of power, comprised of District resources and market purchases. The District and Cascade executed a successor 6-month contract effective October 1, 2023 in substantially the same form as the prior contract and capped power deliveries at 55 MW. The contract is primarily cost-based. Billings are prepaid on a monthly basis and are further secured by a standby letter of credit, currently held at $4,929,000.
Cascade’s operations allow for variable power consumption. Power sales to Cascade are primarily in monthly shaped blocks, although less-than-monthly transactions are allowed under the current contract. Peak consumption for Cascade during 2023 was 83 MW, with an average consumption of 48 MW over the life of the contracts. Total revenues from Allrise and Cascade for the years ended December 31, 2023 and 2022 were $31,852,571 and $17,299,344, respectively.
Energy Northwest – The District is a participant in Energy Northwest’s (formerly the Washington Public Power Supply System) Nuclear Project Nos. 1 and 3, both of which have terminated. The District purchased from Energy Northwest, and assigned to BPA, 0.087% of the capability of Project No. 1 and 0.078% of Energy Northwest’s 70% ownership share of Project No. 3. Under the agreements, the District is unconditionally obligated to pay Energy Northwest its pro rata share of the total costs of the projects, including debt service, even though the projects are terminated. Under the Net Billing Agreements, BPA is responsible for assuming the District’s cost obligation, and therefore the District had no direct payments in 2023 and 2022. The District’s Electric System revenue requirements are not directly affected by the associated costs; revenue requirements are affected indirectly to the extent that the costs of the projects result in increases in BPA’s wholesale power rates.
Note 6 - Pension Plans
The District is a member of the Washington State Public Employees’ Retirement System (PERS) cost-sharing plan. For purposes of measuring the net pension liability/asset, deferred outflows/inflows of resources, and pension expense, information about the fiduciary net position of the PERS and additions to/deductions from PERS’ fiduciary net position have been determined on the same basis as they are reported by PERS. For this purpose, plan contributions are recognized as of employer payroll paid dates and benefit payments and refunds are recognized when due and payable in accordance with the benefit terms. Investments are reported at fair value.
Plan description - PERS was established in 1947 and its retirement benefit provisions are contained in Revised Code of Washington (RCW) chapters 41.34 and 41.40. PERS is a cost-sharing multiple-employer retirement system composed of three separate pension plans for membership purposes. PERS Plan 1 and Plan 2 are defined benefit plans, and Plan 3 is a defined benefit plan with a defined contribution component.
35 Notes
Financial
to Combined
Statements
Public Utility District No. 1 of Pend Oreille County
PERS members include elected officials, state employees, employees of local governments, and higher education employees not participating in higher education retirement plans.
PERS is composed of and reported as three separate plans for accounting purposes: Plan 1, Plan 2/3, and Plan 3. Plan 1 accounts for the defined benefits of Plan 1 members. Plan 2/3 accounts for the defined benefits of Plan 2 members and the defined benefit portion of benefits for Plan 3 members. Plan 3 accounts for the defined contribution portion of benefits for Plan 3 members. Although employees can be a member of only Plan 2 or Plan 3, the defined benefits of Plan 2 and Plan 3 are accounted for in the same pension trust fund. All assets of Plan 2/3 may legally be used to pay the defined benefits of any Plan 2 or Plan 3 members or beneficiaries. Therefore, Plan 2/3 is considered a single plan for accounting purposes.
Benefits provided - PERS Plan 1 - Provides retirement, disability, and death benefits. Retirement benefits are calculated as 2% times the member’s average final compensation (AFC) times the member’s years of service. AFC is the average of the member’s 24 consecutive highest-paid service credit months. Members are eligible for retirement from active status at any age with at least 30 years of service, at age 55 with at least 25 years of service, or at age 60 with at least five years of service.
PERS Plan 1 retirement benefits are actuarially reduced if a survivor benefit is chosen. Members retiring from inactive status before age 65 may also receive actuarially reduced benefits. Other benefits include an optional cost-of-living adjustment (COLA). Members became vested after the completion of five years of eligible service.
PERS Plan 2/3 - PERS Plan 2/3 provides retirement, disability, and death benefits. Retirement benefits for Plan 2 are calculated as 2% times the member’s AFC times the member’s years of service. Defined benefits for Plan 3 are calculated using 1% times the member’s AFC times the member’s years of service. AFC is the monthly average of the member’s 60 consecutive highest-paid service credit months.
Members are eligible for retirement with a full benefit at age 65 with at least five years of service credit. Retirement before age 65 is considered an early retirement. PERS Plan 2/3 members who have at least 20 years of service credit and are 55 years of age or older are eligible for early retirement with a reduced benefit. The benefit is reduced by a factor that varies according to age for each year before age 65. PERS Plan 2 members are vested after completing five years of eligible service.
PERS Plan 2/3 retirement benefits are actuarially reduced if a survivor benefit is chosen. Plan 2/3 benefits include a COLA based on the Consumer Price Index, capped at 3% annually.
Annuities purchased with Plan 3 defined contributions that are invested within the Washington State Investment Board Total Allocation Portfolio (WSIB TAP) are considered defined benefits. Plan 3 WSIB TAP annuities are actuarially reduced if a survivor benefit is chosen and purchased annuities include a COLA of 3% annually.
PERS Plan 3 – Defined contribution benefits are totally dependent on employee contributions and investment earnings on those contributions. Members are eligible to withdraw their defined contributions upon separation. Members have multiple withdrawal options, including purchase of an annuity. PERS Plan 3 members are vested in the defined benefit portion of their plan after 10 years of service or after five years of service if 12 months of that service was earned after age 44
36 Notes to Combined Financial Statements
Public Utility District No. 1 of Pend Oreille County
Contributions - PERS Plan 1 contributions - The PERS Plan 1 member contribution rate is established in statute at 6%. The employer contribution rate is developed by the Office of the State Actuary (OSA), adopted by the Pension Funding Council, and is subject to change by the Legislature.
PERS Plan 2/3 contributions - The PERS Plan 2/3 employer and employee contribution rates are developed by the OSA to fully fund Plan 2 and the defined benefit portion of Plan 3. The rates are adopted by the Pension Funding Council, and are subject to change by the Legislature. The employer rate includes a component to address the PERS Plan 1 unfunded actuarial accrued liability (UAAL).
PERS Plan 3 contributions – As established by Chapter 41.34 RCW, Plan 3 defined contribution rates are set at a minimum of 5% and a maximum of 15%. PERS Plan 3 members choose their contribution rate from six options when joining membership and can change rates only when changing employers. Employers do not contribute to the defined contribution benefits.
Required contribution rates (expressed as a percentage of covered payroll) at the close of fiscal year 2023 were as follows:
Actual Contribution RatesEmployerEmployee
Both the District and employees made the required contributions during fiscal years 2023 and 2022. The District’s required employer contributions for the years ended December 31 were as follows:
Required Employer Contributions2023
PERS Plan 1
2022
$ 312,392 $ PERS Plan 2/3
529,487 Total 848,972 $ 841,879 $
Actuarial assumptions - The total pension liability for each of the plans was determined by an actuarial valuation as of June 30, 2022, with the results rolled forward to June 30, 2023, using the following actuarial assumptions applied to all prior periods included in the measurement:
Actuarial Assumptions
Inflation
Salary increases
2.75% total economic inflation, 3.25% salary inflation
In addition to the base 3.25% salary inflation assumption, salaries are also expected to grow by promotions and longevity
Investment rate of return7.00%
Mortality rates were developed using the Society of Actuaries’ Publication H-2010 Mortality rates, which vary by member status (active, retiree, or survivor), as the base table. OSA applied age offsets for each system, as appropriate, to better tailor the mortality rates to the demographics of each plan. OSA applied the long-term MP-2017 generational improvement scale, also developed by the Society of Actuaries, to project mortality rates for every year after the 2010 base table. Under “generational” mortality, a member is assumed to receive additional mortality improvements in each future year throughout their lifetime.
37 Notes to Combined Financial Statements
PERS
10.39%6.00% PERS Plan
10.39%6.36% PERS
10.39%5.00%
Plan 1
2/3
Plan 3
- 15.00%
296,722
552,250
Public Utility District No. 1 of Pend Oreille County
The actuarial assumptions used in the June 30, 2022 valuation were based on the results of the 2013-2018 Demographic Experience Study Report and the 2021 Economic Experience Study. Additional assumptions for subsequent events and law changes are current as of the 2022 actuarial valuation report.
OSA selected a 7.00% long-term expected rate of return on pension plan investments. In selecting this assumption, OSA reviewed the historical experience data, considered the historical conditions that produced past annual investment returns, and considered Capital Market Assumptions (CMAs) and simulated expected investment returns the WSIB provided.
The CMAs contain the expected annual return, standard deviation of the annual return, and correlations between the annual returns of each asset class. The WSIB uses the CMAs and their target asset allocation to simulate future investment returns over various future time horizons. The expected future rates of return (expected returns, net of pension plan investment expense, including inflation) are developed by the WSIB for each major asset class.
Best estimates of arithmetic real rates of return for each major asset class included in the pension plans’ target asset allocation as of June 30, 2021, are summarized in the following table:
The inflation component used to create the table above was 2.20% and represents WSIB’s most recent longterm estimate of broad economic inflation.
Discount rate - The discount rate used to measure the total pension liability was 7.00%. To determine the discount rate, an asset sufficiency test was completed to test whether each pension plan’s fiduciary net position was sufficient to make all projected future benefit payments of current plan members. Based on the assumptions described in the Certification Letter, the pension plan’s fiduciary net position was projected to be available to make all projected future benefit payments of current plan members. Therefore, the longterm expected rate of return of 7.00% on pension plan investments was applied to determine the total pension liability.
Pension liability sensitivity - The following table presents the District’s proportionate share of the net pension liability (asset) for all plans it participates in, calculated using the discount rate of 7.00%, as well as what the District’s proportionate share of the net pension liability (asset) would be if it were calculated using a discount rate one percentage point lower (6.00%) or one percentage point higher (8.00%) than the current discount rate:
38 Notes to Combined Financial Statements
Asset
Target Allocation Long-Term Expected Real Rate of
Fixed Income 20.00% 1.50% Tangible Assets 7.00% 4.70% Real Estate 18.00% 5.40% Global Equity 32.00% 5.90% Private Equity 23.00% 8.90% District's Proportionate Share of Net Pension Liability (Asset) Sensitivity 1% Decrease in Discount Rate (6.00%) Discount Rate (7.00%) 1% Increase in Discount Rate (8.00%) Proportionate share of the PERS Plan 1 net pension liability 1,525,593 $ 1,091,991 $ 713,557 $ Proportionate share of the PERS Plan 2/3 net pension liability (asset) 2,750,780 $ (2,529,174) $ (6,866,991) $
Class
Return
Public Utility District No. 1 of Pend Oreille County
The pension liability (asset) has been allocated to the operating systems based on a percentage of total payroll charged to each system. The total pension liability (asset) for each system is as follows:
Proportionate Share of Plan Net Pension Liability (Asset)PERS Plan 1PERS Plan 2/3
Total as of December 31, 2023 Total as of December 31, 2022
Pension costs - The District reports a liability (asset) for its proportionate share of each plan’s net pension liability (asset). The net pension liability (asset) was measured as of June 30, 2023, and the total pension liability (asset) used to calculate the net pension liability (asset) was determined by an actuarial valuation as of June 30, 2022, rolled forward to June 30, 2023. Below are the percentage proportionate shares of net pension liability (asset) for each plan.
Proportionate Share of Plan LiabilityPERS Plan 1PERS Plan 2/3
share as of June 30, 2023
share as of June 30, 2022
The District’s proportion of the net pension liability (asset) was based on the contributions received by PERS during the measurement period for employer payroll paid dates from July 1, 2022, through June 30, 2023, relative to the total employer contributions received from all of PERS’ participating employers, as well as the statutorily required contributions required to fund the unfunded actuarial accrued liability. The proportionate share of net pension liability (asset) and the pension expense or credit recognized by the District for each plan is as follows:
Proportionate Share of Net Pension Liability (Asset) and Pension Ex pense (Credit)PERS Plan 1PERS Plan 2/3
as of December 31, 2023
as of December 31, 2022
The District reported its proportionate share of deferred outflows of resources and deferred inflows of resources from the following sources:
District's Proportionate Share of Plan Deferred Outflows of ResourcesPERS Plan 1PERS Plan 2 Total as of December 31, 2023
as of December 31, 2022 Differences between expected and actual economic ex perience - $
Changes in proportion - (83,551) (83,551) (338,923) Contributions paid to PERS subsequent to the measurement date
39 Notes to Combined Financial Statements
Electric
677,034 $ (1,568,088) $ (891,054) $ (639,924) $ Box Canyon Production System294,838 (682,877) (388,039) (278,677) Water System 43,680 (101,167) (57,487) (41,286) Community
76,439 (177,042) (100,603) (72,249) Total 1,091,991 $ (2,529,174) $ (1,437,183) $ (1,032,136) $
System
Network System
0.047837%0.061707% Percent
0.050281%0.065578%
Percent
Total
Net
1,091,991
(2,529,174)
(1,437,183)
(387,604)
(976,184) $ (1,363,788)
Total
pension liability (asset)
$
$
$ (1,032,136) $ Pension expense (credit)
$
$ (1,200,174) $
Total
515,191
515,191
602,628
Changes
1,061,835 1,061,835
132,494 280,954 413,448 432,990 Total 132,494
1,774,429 $ 1,906,923 $ 2,052,280 $
$
$
$
in actuarial assum ptions -
1,355,585
$
Public Utility District No. 1 of Pend Oreille County
District's Proportionate Share of Plan Deferred Inflows of ResourcesPERS Plan 1PERS Plan 2
Differences between expected and actual
Difference between
and
Total as of December 31, 2023
Total as of December 31, 2022
The $132,494 reported as deferred outflows of resources for PERS Plan 1 and $280,954 reported as deferred outflows of resources for PERS Plan 2/3 related to pensions resulting from the District’s contributions subsequent to the measurement date will be recognized as a reduction of the net pension liability for the relevant plan in the year ending December 31, 2024. Other amounts reported as deferred outflows and inflows of resources related to each plan will be recognized in pension expense as follows:
Deferred Outflows and Inflows of Resources Recognized in Pension Ex pense
PERS Plan 1PERS Plan 2/3
Pension plan fiduciary net position - Detailed information about each defined benefit pension plan’s fiduciary net position is available in a separately issued Washington State Department of Retirement Systems 2023 Annual Comprehensive Financial Report. This report may be obtained by writing to: Department of Retirement Systems, Communications Unit, P.O. Box 48380, Olympia WA 98504-8380; or it may be downloaded from the DRS website at www.drs.wa.gov.
Defined contribution pension plans - The District maintains a defined contribution plan in accordance with the Internal Revenue Code Section 401(a). The District serves as trustee for this single-employer defined contribution plan, which is administered by MissionSquare Retirement. All permanent employees working 30 or more hours per week are eligible to participate in the plan.
The plan provides for an employer match of 50% of eligible employee deferral of employee straight-time wages, capped at a 4% employer match on an 8% employee deferral. District contributions and earnings for each employee are immediately fully vested. Employer contributions to this plan for 2023 and 2022 were $283,860 and $257,136 respectively, and are reported as expense within the balances on the Statement of Revenues, Expenses, and Changes in Net Position. All plan assets have been placed into trust for the exclusive benefit of plan participants and their beneficiaries.
Participants may draw a loan on their employee benefit account. Only one loan is allowed per employee per plan at a time and is limited to $50,000 or 50% of the value of the participant’s interest in all of their
40 Notes to Combined Financial Statements
perience - $ 28,259 $ 28,259 $ 55,057 $ Changes in actuarial assum ptions - 231,438 231,438 354,941
economic ex
actual investment earnings 123,181 953,146 1,076,327 2,030,124 Total 123,181 $ 1,212,843 $ 1,336,024 $ 2,440,122 $
projected
2024
2025
2026
2027
294,989 2028
2029
Total
280,632
(83,807) $ (530,332) $
(105,398) (591,116)
64,987 776,249
1,037
- 302,711
- 28,131
(123,181) $
$
Public Utility District No. 1 of Pend Oreille County
Plan accounts. Loans incur a fixed interest rate of prime plus 0.5% that is set at the time of approval, and monthly principal and interest payments are made through District payroll deduction.
The 401(a) plan investments are reported at fair value. Investment options consist of mutual funds, bonds, and stocks. The District categorized its fair value measurements within the fair value hierarchy established by GAAP, which is based on the valuation inputs used to measure the fair value of an asset. Investments in the plan are deemed Level 1 inputs, which are quoted prices in active markets for identical assets.
The District also maintains a deferred compensation pension plan in accordance with the Internal Revenue Code Section 457. The plan is administered by MissionSquare Retirement and has the same employee eligibility, contribution, and loan parameters as the 401(a) plan.
Savings plan - The District maintains a Health Reimbursement Arrangement for employees. All plan assets have been placed into a multiple-employer trust for the exclusive benefit of plan participants and their beneficiaries. Non-bargaining-unit employees receive a $225 monthly contribution paid into individual employer-sponsored medical savings accounts to pay for eligible medical expenses, tax-free, whether incurred while employed or after retirement. Bargaining unit employees are eligible for a $200 monthly contribution if they participate in District-sponsored wellness programs.
Note 7 - Self-Insurance
Public Utility Risk Management Services - The District is a member of the Public Utility Risk Management Services (PURMS) self-insurance fund. PURMS is a public entity risk pool and its members include 18 public utility districts and one non-profit mutual corporation. The objectives of PURMS are to formulate, develop, and administer a program of self-insurance in order to obtain lower costs for the various coverages provided to its members and to develop a comprehensive loss control program. The risks shared by the members are defined in the Self-Insurance Agreement (SIA). The fund consists of three pools for liability, property, and health and welfare coverage. The pools operate independently of one another. All members do not participate in all pools, and the District does not participate in the health and welfare pool.
The District is a participant in the liability pool, which maintains a base self-insured retention level of $1 million. In addition, the fund maintains $35 million of excess general liability insurance over the $1 million retention. A second layer of excess general liability insurance of $65 million is also maintained over the first layer of $35 million. The fund maintains $35 million in directors and officers liability coverage with a retention level of $500,000. The fund also maintains $5 million in cyber security liability coverage with a retention level of $1 million. The deductible is $250.
The designated liability pool reserve balance is $3.5 million. Liability assessments are levied to replenish the reserves to the designated level at any time during the year that the actual reserves drop to $500,000 less than the designated level.
The District is also a participant in the property pool, which maintains a self-insured retention level of $250,000. The property pool provides the District with $200 million shared excess coverage, attaching at the self-insured retention level for all property risks excepting flood and earthquake, which attach at 2% of total insured value. Any gap between the self-insured level and excess insurance is funded half by the property pool and half by the affected member. The deductible varies, but for most classes of property it is $250.
41 Notes to Combined Financial Statements
Public Utility District No. 1 of Pend Oreille County
The designated property pool reserve balance is $750,000. Property assessments are levied to replenish the reserves to the designated level at any time during the year that the actual reserves drop below $500,000.
As a member, the District is subject to its share of excess premiums and assessments based on claims submitted by all members. The following premiums and assessments were charged during the years ended December 31:
Central Washington Public Utilities - The District, with six other public utility districts, is a member of the Central Washington Public Utilities Unified Insurance Program and Trust, which is a self-insurance program providing medical, dental, life insurance, disability insurance, and similar benefits to member employees and families. Formed by a Declaration of Trust and an Interlocal Agreement under RCW Chapter 39.34, the trust is administered by a board of trustees consisting of an appointed trustee from each of the seven member districts. Further information may be obtained by contacting the District’s financial department as set forth on the last page of this Annual Report under Organizational Information—Corporate Office.
Note 8 - Commitments and Contingencies
Box Canyon Project - The District’s Box Canyon Hydroelectric Project (Box Canyon Dam) operates under a 50-year license issued by FERC, which expires on July 1, 2055. The license contains several conditions, including environmental studies and projects initiated by state and federal agencies and the Kalispel Tribe of Indians. All projects and studies are related to Box Canyon Dam and its reservoir and include the protection, mitigation, and enhancement of fish, wildlife, recreation, erosion, water quality, and cultural preservation. Capitalized projects have included upgrade of the Box Canyon Project turbines, spillway gate modification for total dissolved gas abatement, and construction of fish passage facilities. District-directed projects that are noncapital in nature, which are expensed as incurred, include improvement of wildlife and fish habitat, water quality monitoring, erosion mitigation, and environmental studies. The license also requires payments to agencies that are used at the discretion of the receiving party, and are intended for license measures, although the District has no control over the final disposition of the funds. These costs have been estimated over the life of the license and recorded as a regulatory asset and licensing costs liability (Note 1).
Kalispel Tribe of Indians - The Box Canyon license includes language authorizing the District to use lands in the Kalispel Indian Reservation. Under a contract signed in 2007, payment to the Kalispel Tribe for use of their lands is based on costs to produce power at Box Canyon Dam. The Kalispel Tribe receives their payment in electrical energy, the amount of which is based on a formula using Box Canyon Dam production costs. The Kalispel Tribe chooses on an annual basis, in advance of the calendar year, to use the energy, require the District to sell the energy to a third party on the Kalispel Tribe’s behalf at market prices, or require the District to purchase the power at cost of production. For 2023 and 2022, the Kalispel Tribe
42 Notes
Combined Financial Statements
to
Liability Property 20232022 20232022 Electric System 368,273 $ 267,938 $ 70,767 $ 58,559 $ Box Canyon Production System201,566 139,428 286,439 236,244 Water System 17,543 14,153 5,520 4,549 Community Network System 49,495 33,879 1,505 1,099 Total 636,877 $ 455,398 $ 364,231 $ 300,451 $
Public Utility District No. 1 of Pend Oreille County
chose to have the District purchase the power at generation cost. Power sales on the Kalispel Tribe’s behalf totaled $244,945 and $244,960 in 2023 and 2022, respectively.
In 2019, the District executed an off-license agreement with the Kalispel Tribe to provide payments for alternative mitigation activities in lieu of fish passage construction and license measures regarding water quality. The off-license agreement was referenced as part of an amendment to the Box Canyon FERC license, and became effective upon FERC’s approval of the amendment in December 2021. Payments range from $1.5 million to $3.1 million over 25 years. The agreement also includes a $10 million contribution for upstream fish passage facilities at Albeni Falls Dam, which is a federally-owned hydroelectric project directly upstream of Box Canyon Dam. This payment will be made upon the completion of certain construction conditions, or December 2027, whichever occurs earlier. The District has recorded the present value of all payments under the agreement as a regulatory asset and licensing costs liability as of December 31, 2023 and 2022. Payments under this agreement were $2.3 million for both 2023 and 2022.
Sullivan Creek Project - The Electric System’s Sullivan Creek Project consists of Sullivan Creek Dam, which is currently used solely for water storage and Mill Pond Dam, located downstream of Sullivan Dam. The Sullivan Creek Project’s 50-year FERC license expired in September 2008, and the District subsequently entered into a negotiated license surrender process outlining continued operation of the Sullivan Dam as a water storage facility and completion of various environmental projects to protect and enhance fish and wildlife habitat. Through a settlement agreement between Seattle City Light, the District, and other related parties, Seattle City Light completed the removal of Mill Pond Dam in 2020 and is currently performing other restoration and environmental work as part of the relicensing conditions for Boundary Dam. Once final approval of the Surrender Order is received from FERC, which is expected in the coming years, the District will become eligible to receive a 30-year United States Forest Service (USFS) special use authorization to continue to operate Sullivan Dam as a water storage facility.
Concurrent with the license surrender process, the District contracted with Washington State Department of Ecology to sell certain Sullivan-related water rights to the State of Washington through the Department of Ecology’s Office of Columbia River, Columbia River Water Management Program. In exchange for the release of water from Sullivan Lake at designated times and volumes, the Department of Ecology Office of Columbia River paid the District $14 million. Proceeds are expected to finance Sullivan Creek Project capital and operating, maintenance, and environmental expenditures for the entirety of the 30-year term of the USFS special use authorization to be issued after decommissioning of the project is fully complete. The proceeds are recorded as unearned revenue and are being amortized annually in an amount equal to the net cash outflow for Sullivan Project-related activities each year. The monies are restricted to use for Sullivan Creek Project-related expenditures and reflected on the statement of net position within the contract security liability category.
Because there is no operating value for the District in owning the Sullivan Project assets, the District reports the net revenues and expenses as nonoperating. Asset values are recorded net of accumulated depreciation as nonutility plant. The District reports no remaining license surrender liability.
Clark Public Utility District – In October 2022, the District executed a long-term agreement with Public Utility District No. 1 of Clark County (Clark) for the output of Box Canyon generation. The 16-year agreement, which begins January 1, 2026, sells the output of Box Canyon as it is generated to Clark. The power is sold at cost that includes both a fixed-price component and a variable-cost component adjusted
43 Notes to Combined Financial Statements
Public Utility District No. 1 of Pend Oreille County
by inflation, plus an environmental adder per megawatt generated. Clark assumes risk associated with both annual water levels and market price fluctuations.
Other contingencies - The District is subject to various claims, possible legal actions, and other matters arising out of the normal course of business. When it is possible to make a reasonable estimate of the District’s liability with respect to probable claims, an appropriate provision is made. Although the ultimate outcome of litigation against the District cannot be determined, management intends to continually defend all claims against the District and believes the District is adequately reserved for all known events.
Note 9 - Northwest Open Access Network
The District, along with nine other Washington public utility districts and Energy Northwest, is a member of Northwest Open Access Network (NoaNet), a Washington nonprofit mutual corporation. NoaNet uses a high-speed fiber optic transmission system, largely located within Washington State, to provide Ethernet and other advanced telecommunications services on a wholesale basis to its members and retail telecommunications companies. NoaNet has first right-of-refusal to lease four strands, designated as public purpose, from fiber optic lines the BPA owns on transmission lines.
In December 2020, NoaNet issued Telecommunications Network Revenue Bonds in the amount of $24,775,000. Proceeds from the bonds were used to refund all outstanding debt, including all Member Agreements, leaving $10 million available for upcoming capital projects. The bonds were structured with level debt service with annual payments from 2021 through 2030. Yields on the bonds ranged from 0.591% in 2021 to 2.120% in 2030. The all-in interest cost was 1.90%. The District’s 5.76% guarantee share of the debt outstanding of $15,295,000 as of December 31, 2023 is $880,992.
During May 2023, NoaNet entered into separate Member Loan agreements to pay a portion of NoaNet’s pension liability. The loans are structured with annual debt service payments from 2023 to 2033. The District loaned NoaNet $500,000, with a repayment term of 5 years. Interest on the loan accrues at the monthly LGIP rate, which was 5.429% at December 31, 2023. Interest and principal payments are due annually each May.
In 2022, NoaNet reported a net operating loss of $3,022,510, $180,269 of nonoperating revenue, and a total decrease in net position of $2,842,241. The 2023 audited financial statements were not available at the time of issuance of this report.
The District’s Electric System reports no investment or liability account balance reflecting NoaNet membership.
A NoaNet annual report may be obtained by writing to Northwest Open Access Network,11707 E. Sprague Avenue, Suite 201, Spokane Valley, WA 99206. NoaNet’s website is www.noanet.net.
Note 10 - Grants
Washington State Community Development Block Grant (CDBG) – In December 2019, Washington State Department of Commerce awarded the Town of Metaline Falls, with the District as sub-recipient, a CDBG grant in the amount of $735,000 to replace approximately 5,100 feet of water piping for the Metaline Falls water system project. During 2023, the Town of Metaline Falls requested and was awarded an additional $91,000 in grant funding. The project was completed in 2023. The District expended $656,278 and $35,451 for the years ended December 31, 2023 and 2022, respectively.
44 Notes
Combined Financial Statements
to
Public Utility District No. 1 of Pend Oreille County
Federal Emergency Management Agency (FEMA) – In 2021, the District applied for FEMA funds for costs expended for a September 2020 windstorm event and also for COVID-19 emergency response expenditures. Federal expansion of eligibility requirements for both programs resulted in additional receipts of $12,388 for the 2020 windstorm and $3,958 for COVID-19 during 2023.
Note 11 – Subsequent Event
In March 2024, the District and Cascade executed a new 6-month contract effective April 1, 2024. The contract is in substantially the same form as the previous contract (Note 5) and is capped at power deliveries of 60 MW. Billings continue to be prepaid on a monthly basis and are further secured by a standby letter of credit of $1,300,000.
45 Notes to Combined Financial Statements
Required Supplementary Information
Public Utility District No. 1 of Pend Oreille County
Schedule of Proportionate Share of Net Pension Liability (Asset) as of June 30 PERS 1PERS 2/3PERS 1PERS 2/3PERS 1PERS 2/3
Employer's proportionate share of the net pension liabilit y (asset)
20231,091,991
20192,291,063
20164,115,660 4,944,091
20154,320,539 3,811,237
Employer's covered employee payroll
Employer's proportion of the net pension liability (asset)
Employer's proportionate share of net pension liability (asset) as a percentage of covered employee payroll
Plan fiduciary net position as a percentage of the total pension liabilit y
PERS 1PERS 2/3PERS 1PERS 2/3
202312.80%29.65%80.16%107.02%
202217.07%29.66%76.56%106.73%
20217.95%83.29%88.74%120.29%
202023.26%10.97%68.64%97.22%
201927.40%8.94%67.12%97.77%
201833.54%16.46%63.22%95.77%
201737.63%35.44%61.24%90.97%
201644.89%53.93%57.03%85.82%
201545.62%40.24%59.10%89.20%
201445.71%23.62%
46
8,530,458
8,530,458 $ 0.047837%0.061707%
$ (2,529,174) $
$
8,199,770 8,199,770 0.050281%0.065578%
8,074,948 8,074,948 0.052536%0.067514%
910,825 8,300,145 8,300,145 0.054680%0.071217%
20221,400,008 (2,432,144)
2021641,587 (6,725,481)
20201,930,499
747,291 8,362,937 8,362,937 0.059580%0.076934%
1,410,782 8,571,106 8,571,106 0.064363%0.082627%
3,011,819 8,498,422 8,498,422 0.067391%0.086683%
20182,874,473
20173,197,754
9,167,431 9,167,431 0.076635%0.098196%
9,471,100 9,471,100 0.082596%0.106666% 20143,939,563 2,035,268 8,618,199 8,618,199 0.078204%0.100688%
Required Supplementary Information
Public Utility District No. 1 of Pend Oreille County
Schedule of Employer Contributions as of December 31
Statutorily or contractually re quired contributions
2023296,722
Covered employer payroll
Contributions in relation to the statutorily or contractually required contributions Contribution deficiency (excess)
Contributions as a percentage of covered employee payroll
9,241,367 4.02%4.98%
47
PERS
1PERS 2/3PERS 1PERS 2/3PERS 1PERS 2/3
- -
- -
- -
- -
- -
- -
- -
520,400 (405,744)
-2014372,964 461,531 (372,964) (461,531) -PERS
20238,683,167 $ 8,683,167 $ 3.42%6.36% 20228,325,267 8,325,267 3.75%6.36% 20218,112,952 8,112,952 4.33%7.19% 20208,295,085 8,295,085 4.79%7.92% 20198,202,549 8,202,549 4.96%7.70% 20188,581,426
20178,511,531 8,511,531 4.88%6.80% 20168,642,042 8,642,042 4.83%6.31% 20159,298,258
20149,241,367
$ 552,250 $ (296,722) $ (552,250) $ - $ - $ 2022312,392 529,487 (312,392) (529,487)
2021351,024 583,306 (351,024) (583,306)
2020397,440 656,971 (397,440) (656,971)
2019406,800 631,957 (406,800) (631,957)
2018434,106 643,488 (434,106) (643,488)
2017416,156 579,483 (416,156) (579,483)
2016412,225 538,399 (412,225) (538,399)
2015405,744
(520,400)
1PERS 2/3PERS 1PERS 2/3
8,581,426 5.07%7.52%
9,298,258 4.32%5.54%
Public Utility District No. 1 of Pend Oreille County
Electric System - Revenue, customer and energy statistics for the years ended December 31
48 Supplemental
Information (Unaudited)
2023 2022 2021 2020 2019 Average
Residential 9,064 8,950 8,785 8,585 8,435 Commercial 852 852 851 849 849 Industrial 10 12 12 14 12 Other 82 82 82 82 81 Total 10,008 9,896 9,730 9,530 9,377 Revenues from sale of energy (000s) Residential 13,647 $ 14,160 $ 13,096 $ 11,119 $ 10,821 $ Commercial 3,682 3,748 3,575 2,868 3,057 Industrial 35,676 21,052 3,597 16,685 34,670 Other 2,866 2,030 2,029 30 30 Total District customers 55,871 40,990 22,297 30,702 48,578 Intersystem sales 222 193 164 165 141 Sales for resale 35,881 37,006 30,178 11,645 4,604 Total energy sales 91,974 78,189 52,639 42,512 53,323 Other operating revenues 2,591 2,280 1,506 1,466 1,559 Total 94,565 $ 80,469 $ 54,145 $ 43,978 $ 54,882 $ Energy (MWh) Residential 161,460 164,534 153,417 157,656 153,095 Commercial 53,391 53,088 51,264 48,756 51,529 Industrial 478,154 266,432 67,194 305,440 751,930 Other 133 145 145 145 145 Total District customers 693,138 484,199 272,020 511,997 956,699 Intersystem sales 2,055 2,109 1,647 2,117 1,710 Sales for resale 800,049 968,115 932,826 477,790 138,456 Total sales 1,495,242 1,454,423 1,206,493 991,904 1,096,865 Peak demand (MW) 135 153 76 142 160 Energy requirements (MWh) Retail sales 695,193 486,308 273,667 514,114 958,409 Sales for resale 800,049 968,115 932,826 477,790 138,456 Total sales 1,495,242 1,454,423 1,206,493 991,904 1,096,865 Electric System losses 18,134 26,337 27,653 17,842 26,583 Total energy requirements1,513,376 1,480,760 1,234,146 1,009,746 1,123,448 Energy resources (MWh) Box Canyon Project 382,919 450,197 475,133 444,275 460,575 Boundary Project 382,709 382,741 353,935 340,151 369,066 Bonneville Power Administration178,727 208,944 64,506 127,458 208,288 Other Sources 569,021 438,878 340,572 97,862 85,519 Total energy resources 1,513,376 1,480,760 1,234,146 1,009,746 1,123,448
number of customers
Public Utility District No. 1 of Pend Oreille County
Electric System - Senior lien parity debt service coverage for the years ended December 31,
(1)
Net revenue available for debt service
Funds transferred to rate stabilization fund
(1)Total operating expenses exclude depreciation for purposes of determining parity debt service coverage ratios. (2) (3)Debt service coverage ratio on senior lien debt service.
Investment income varies depending on many factors, including u nrealized gains and losses on long-term investments.
49 Supplemental
Information (Unaudited)
2023 2022 2021 2020 2019 Operating revenues
Energy sales 91,974 $ 78,189 $ 52,639 $ 42,512 $ 53,323 $ Other 2,591 2,280 1,506 1,466 1,559 Total operating revenues 94,565 80,469 54,145 43,978 54,882 Operating expenses
Power costs 63,791 53,289 31,931 29,101 34,410 Operations and maintenance 7,045 6,633 6,339 6,862 6,231 Administrative and general 3,609 3,554 3,452 3,752 3,825 Taxes 3,388 2,448 1,380 1,787 2,785 Pension Expense (846) (744) (1,739) (770) (727) Total operating expenses 76,987 65,180 41,363 40,732 46,524 Investment income (2) 2,032 422 21 83 266 19,610 15,711 12,803 3,329 8,624 - - - - (3,200) Net revenue for debt service coverage 19,610 15,711 12,803 3,329 5,424 Senior lien debt service 976 974 976 976 1,178 Net revenue available for capital18,634 $ 14,737 $ 11,827 $ 2,353 $ 4,246 $ Debt service coverage ratio (3) 20.09x16.13x13.12x3.41x4.60x
(000s)
Public Utility District No. 1 of Pend Oreille County
Box Canyon Production System - Senior lien parity debt service coverage for the years ended December 31, 2023
(1) "All other" includes miscellaneous revenue such as lease of project lands.
(2) Excludes depreciation for purposes of determining senior lien debt service coverage.
(3) Internal Revenue Service interest reimbursement for 2009 Series B, Taxable Build America Bonds, and 2012 Taxable Clean Renewable Energy Bonds, Direct Payment.
(4) The District controls net revenue available by adjusting the power sales transfer price to the Electric System based on Box Canyon Production System cash flow requirements for debt service and capital investment.
(5) Senior lien debt service includes the 2008 CREB bonds, the 2012 CREB bonds, the 2018 bonds, and the 2019 bonds, as applicable.
(6) Debt service coverage ratio on senior lien debt service.
50 Supplemental Information (Unaudited)
2022 2021 2020 2019 Operating revenues
Energy sales Electric System 19,501 $ 17,020 $ 13,846 $ 18,096 $ 19,191 $ Tribal use of lands 245 245 245 230 230 All other (1) 7 7 7 7 7 Total operating revenues 19,753 17,272 14,098 18,333 19,428 Operating expenses (2) Power costs 147 65 80 217 176 Operations and maintenance 8,599 7,357 6,017 5,294 6,683 Administrative and general 1,904 1,756 1,854 2,602 2,458 Taxes 87 103 108 100 103 Pension Expense (368) (324) (757) (336) (317) Total operating expenses 10,369 8,957 7,302 7,877 9,103 Investment income 1,407 387 23 161 570 Other nonoperating (3) 446 507 568 628 687 Net revenue available for debt service (4) 11,237 9,209 7,387 11,245 11,582 Senior lien debt service (5) 10,025 10,091 10,167 10,320 9,398 Net revenue available for capital 1,212 $ (882) $ (2,780) $ 925 $ 2,184 $ Debt service coverage ratio (6) 1.12x0.91x0.73x1.09x1.23x
(000s)
Public Utility District No. 1 of Pend Oreille County
Community Network System - Senior lien parity debt service coverage for the years ended December 31,
(1) Total operating expenses exclude depreciation for purposes of determining parity debt service coverage ratios.
(2) Debt service coverage ratio on senior lien debt service.
51 Supplemental
Information (Unaudited)
2023 2022 2021 2020 2019 Operating revenues (000s) Broadband Sales 2,710 $ 2,604 $ 2,573 $ 2,431 $ 2,194 $ Other 961 812 1,115 1,063 562 Total operating revenues 3,671 3,416 3,688 3,494 2,756 Operating expenses (1) Operations and maintenance 1,089 1,094 991 1,016 921 Administrative and general 600 415 261 315 243 Taxes 20 20 28 23 15 Pension Expense (95) (84) (196) (87) (82) Total operating expenses 1,614 1,445 1,084 1,267 1,097 Investment income 177 31 1 3 9 Net revenue available for debt service2,234 2,002 2,605 2,230 1,668 Senior lien debt service 419 420 420 420 420 Net revenue available for capital 1,815 $ 1,582 $ 2,185 $ 1,810 $ 1,248 $ Debt service coverage ratio (2) 5.33x4.77x6.20x5.31x3.97x
Organizational Information
Public Utility District No. 1 of Pend Oreille County
Date of organization
Nature of business
November 1936
A municipal corporation supplying public utility services in Pend Oreille County, Washington
Board of Commissioners
President Curtis J. Knapp
Vice President Joseph B. Onley
Secretary David W. Rick
Key District Management
General Manager
Director of Finance/Auditor
John Janney
April Owen
Director of Customer Services/Treasurer Sarah Holderman
Director of Operations
Director of Power Production
Director of Human Resources
Corporate Office
Paying Agent and Registrar Information
Chris Jones
Bryant Kramer
Suzie Wrbelis
P.O. Box 190 130 N. Washington Ave. Newport, Washington 99156 (509) 447-3137 www.popud.org
U.S. Bank National Association 111 Fillmore Avenue East St. Paul, Minnesota 55107-1402
52
53
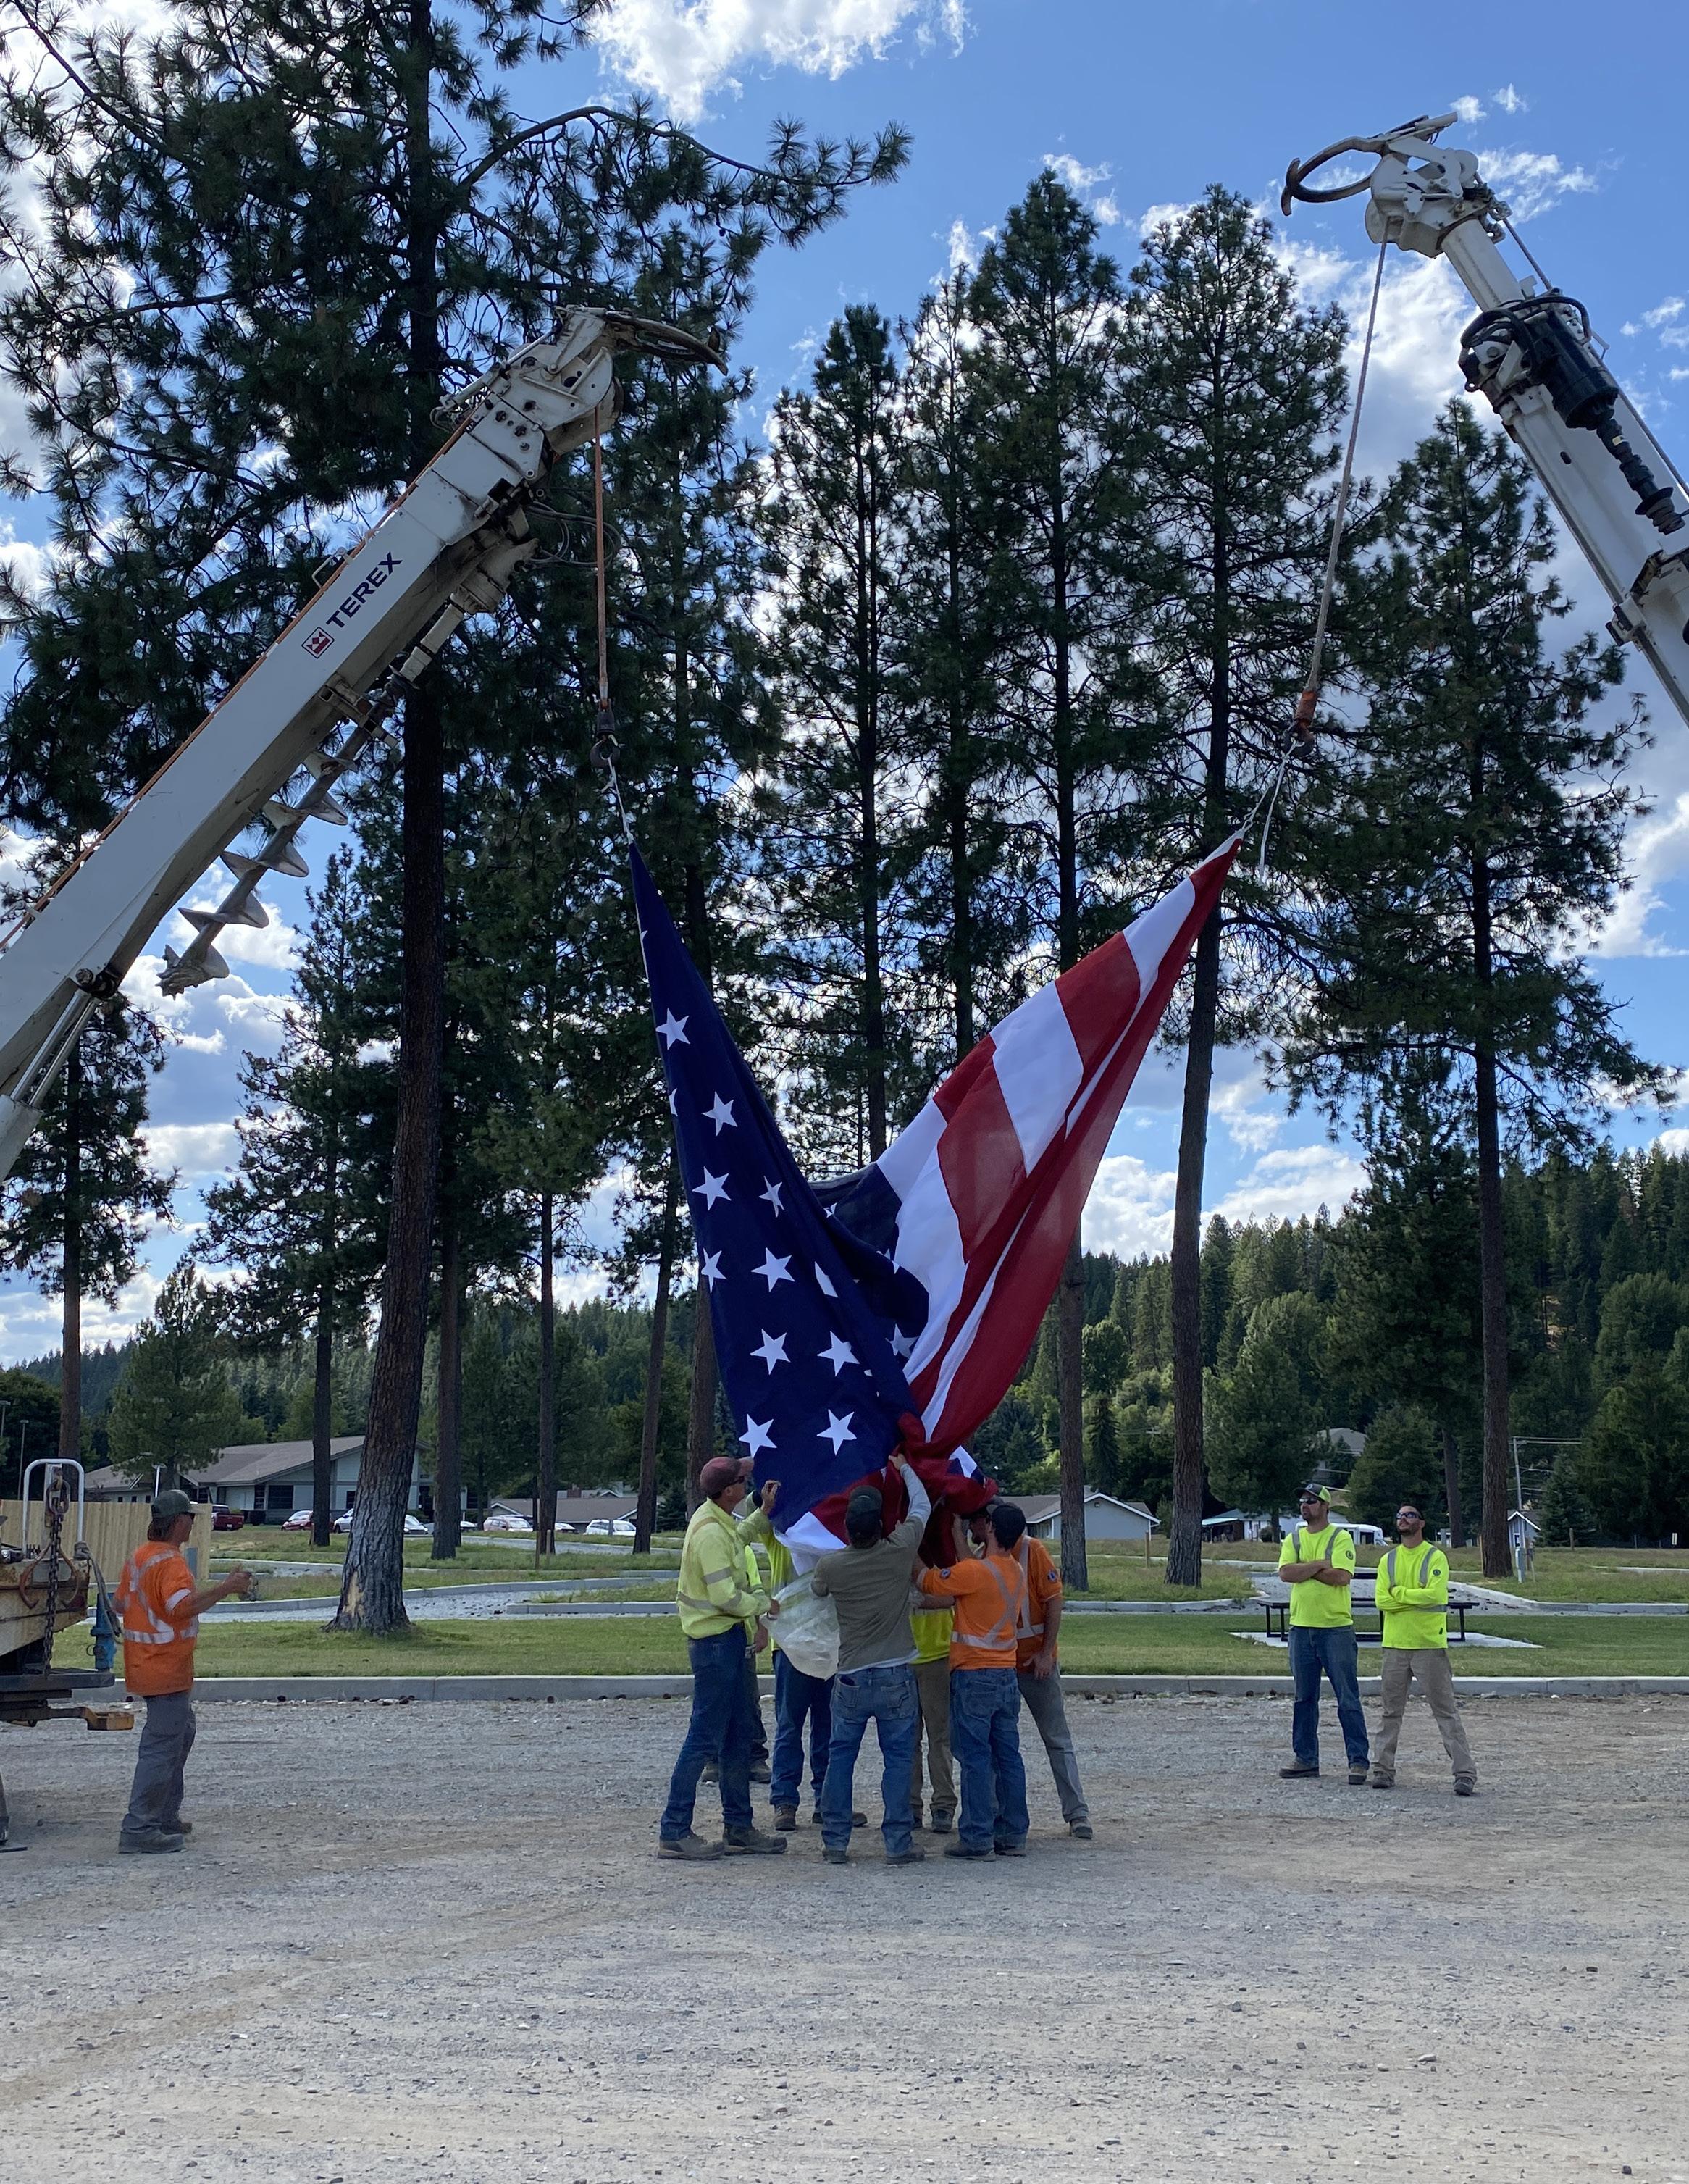
2023 Annual Report Quality Service at Low Cost


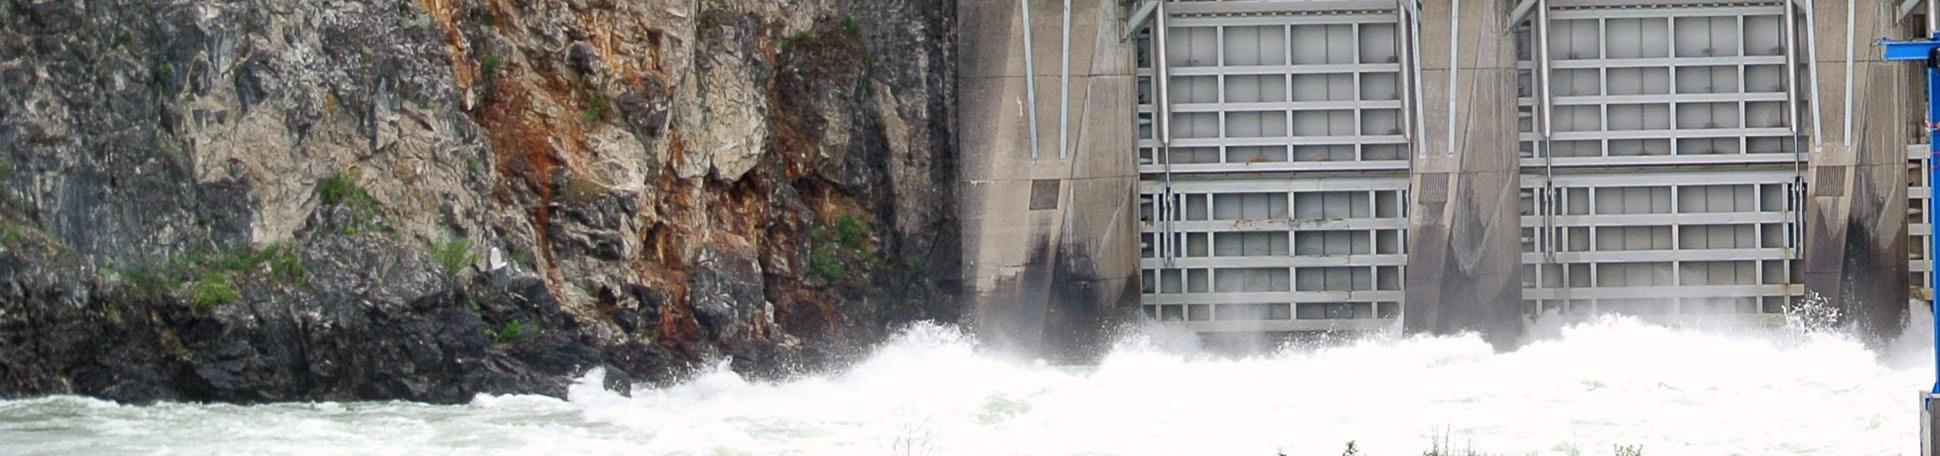


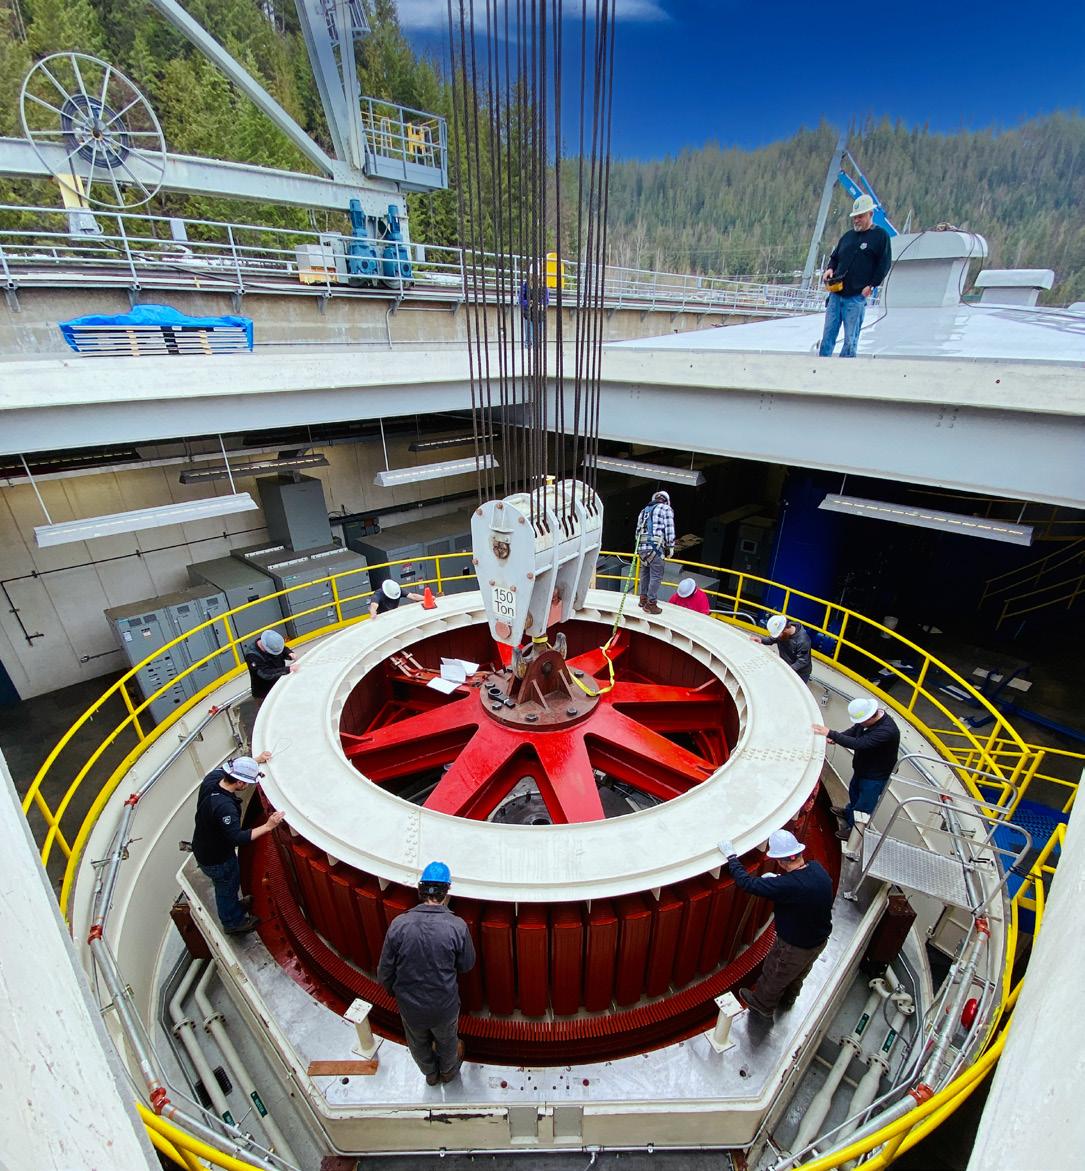

 John Janney General Manager