
2 minute read
Trendsmap


Introduction
Trendsmap, at its very core, is a mapping tool with a niche for visualizing Twitter insights around the globe. You can use Trendsmap to analyze any topic, globally or by region, in detail. The tool also allows you to create a unique map based on visualizations showing tweet activity across a country, region or globally. Unfortunately, a lot of Trendsmap’s features are placed behind a paywall so we will focus on what we can do on the free tier.
Advertisement
Getting Started
To get started with the free tools on Trendsmap, visit https://www.trendsmap.com/ and click on the Map tab at the top of the page. You will need to sign up for an account first.
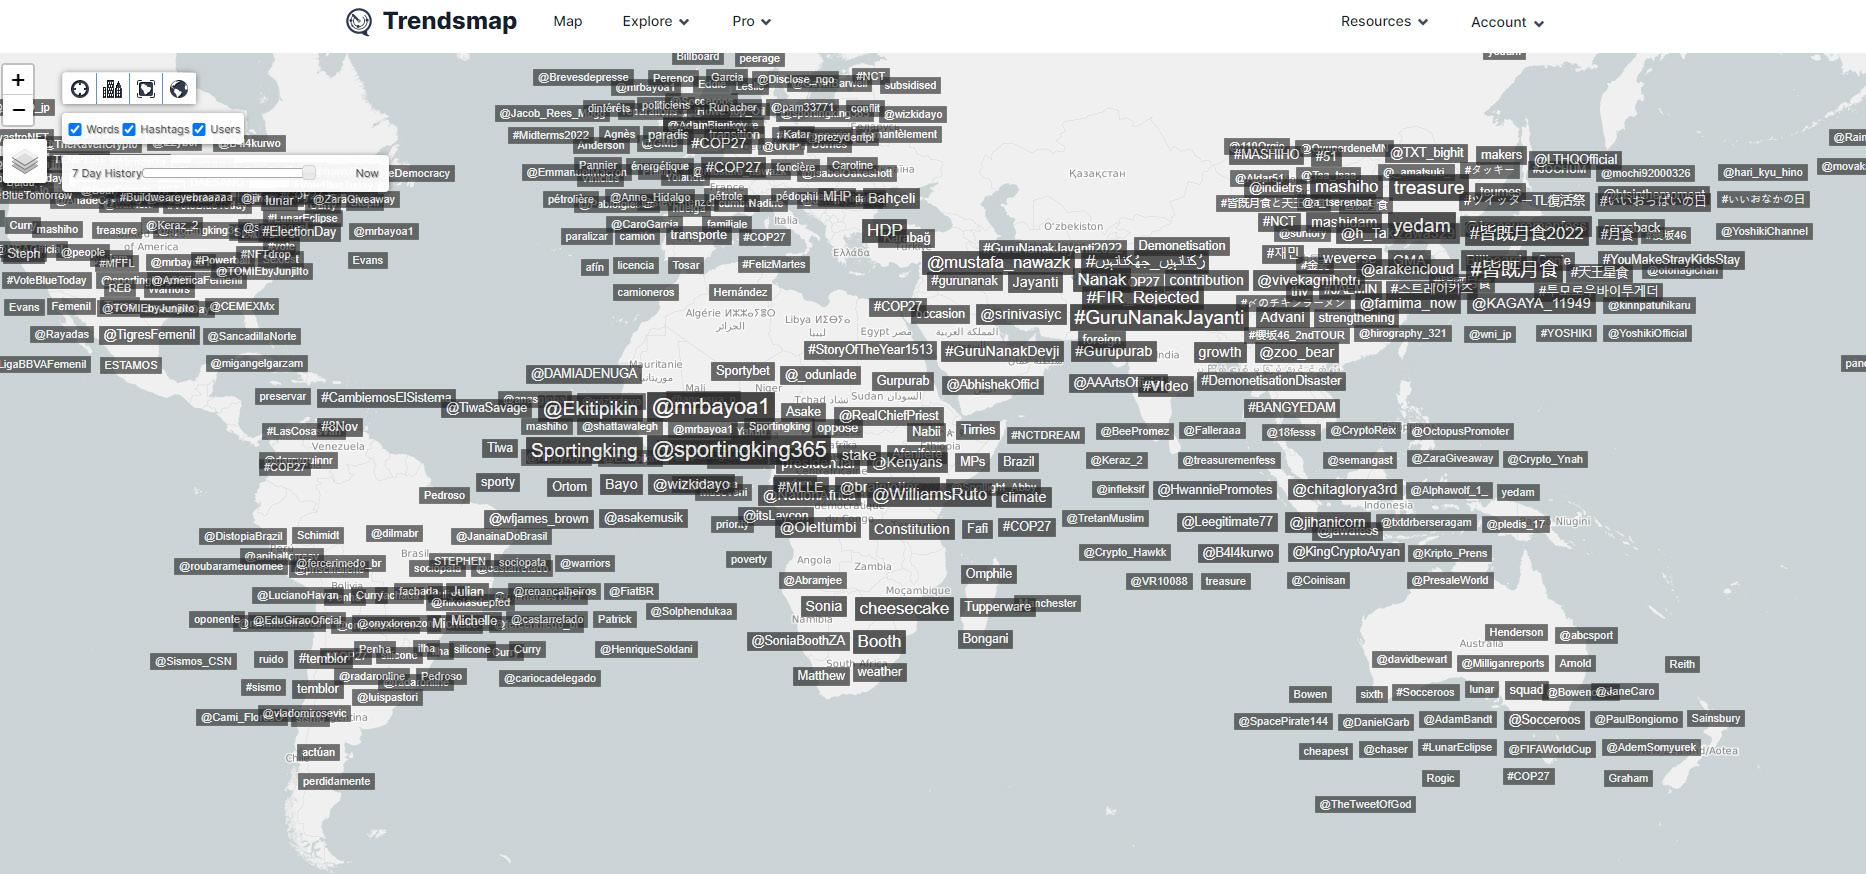
On this page, you can find a map of the globe showing hashtags, keywords and users that are currently trending.
Zoom in to a particular area on the map to get more information about that area. You can also click on any particular keyword or hashtag to learn more about what is trending.

Under the Explore tab, you will find another button to take you to the map section, as well as top tweets, top users, and tweets in your local area.

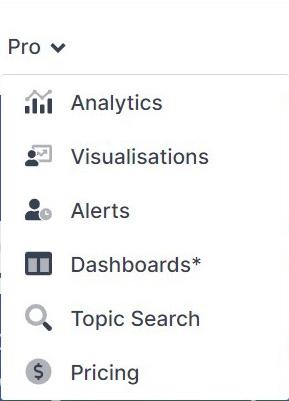
The Pro tab is where you will want to go to perform searches for specific topics of interest, particularly with the Analytics and Topic Search buttons.

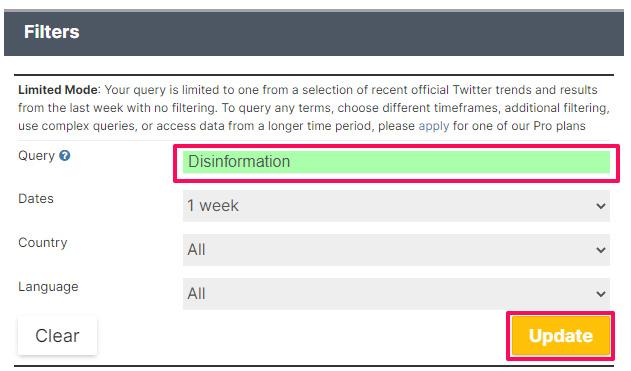
Under Analytics, a search window is presented where you can type in your keyword or hashtag of choice. On the free tier, we are limited to a history of 1 week.
Once you have input a keyword, username or hashtag, hit the update button and wait for the analytics dashboard to appear. This may take a few seconds.

The analytics dashboard will have a lot of useful information and statistics that you can use for your reporting. This information includes a summary of tweets, a map (including an optional heatmap), a timeline of the volume of tweets, data on countries, cities, languages, associated hashtags, emojis, and source apps all related to your search keyword.
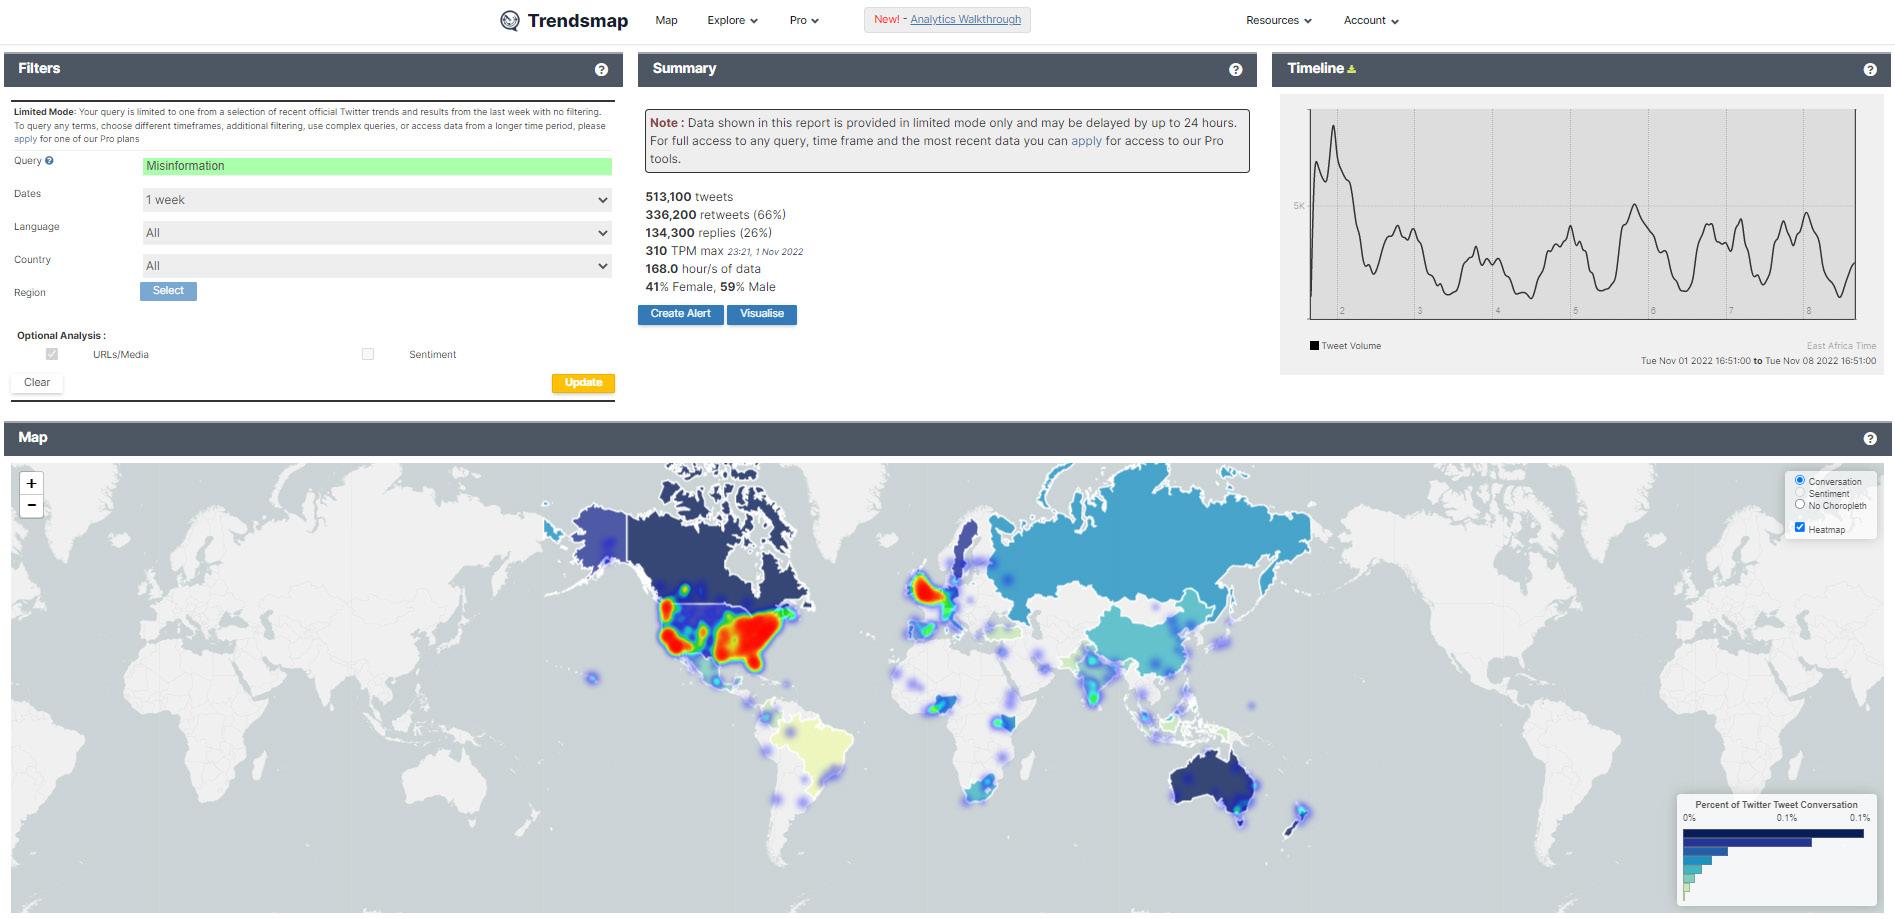
You can download each individual analysis by clicking on the download icon, however this is a paid feature. You can also find out what each chart represents by clicking on the help icon to the right of the chart.

The Topic Search tool works similarly to the analytics tool, except that it has one extra step. Upon clicking on the Topic Search tool, you will be directed to a page with a search window.

Input a key word onto the search box, specify the result type you would like to return and hit the Search button. The results will be in a bar chart format with the most relevant result being at the top with a corresponding score.
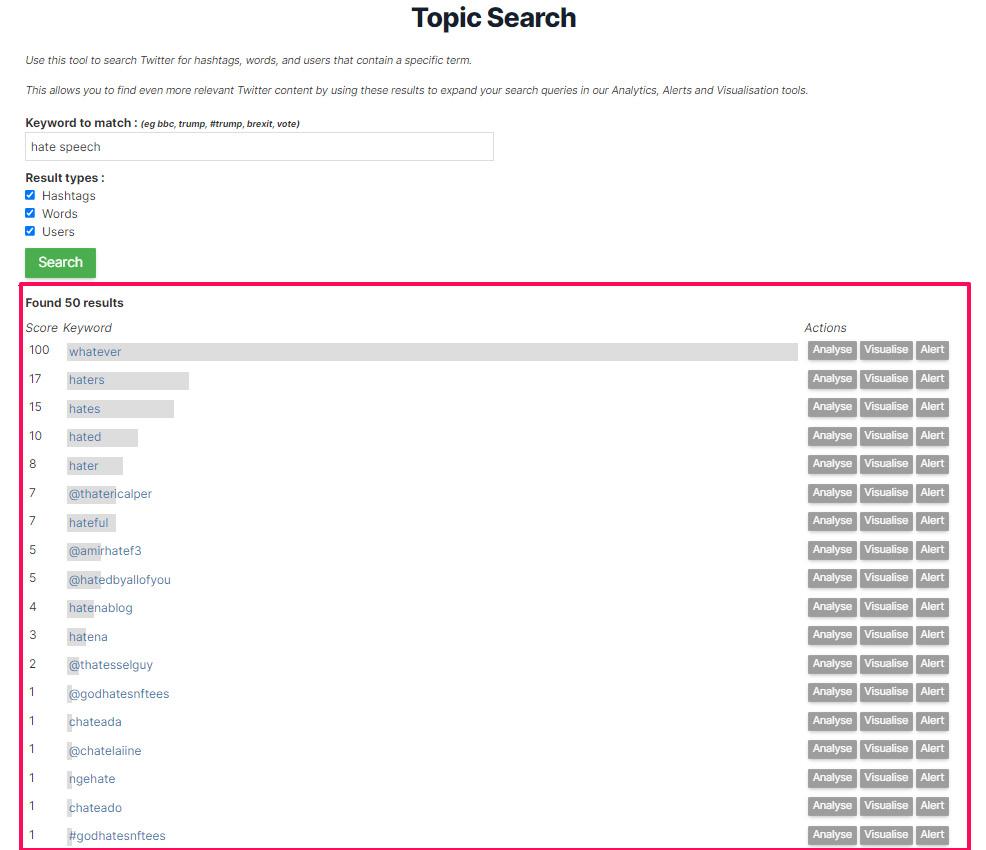
For each of the results, you can select an action from the right end. The actions include Analyze, Visualize and Alert. The Analyze action will build an analytics dashboard similar to the one showcased in the Analytics section. The Visualize action will create a live map showing the appearance of the keyword or hashtag globally over a period of 1 week.
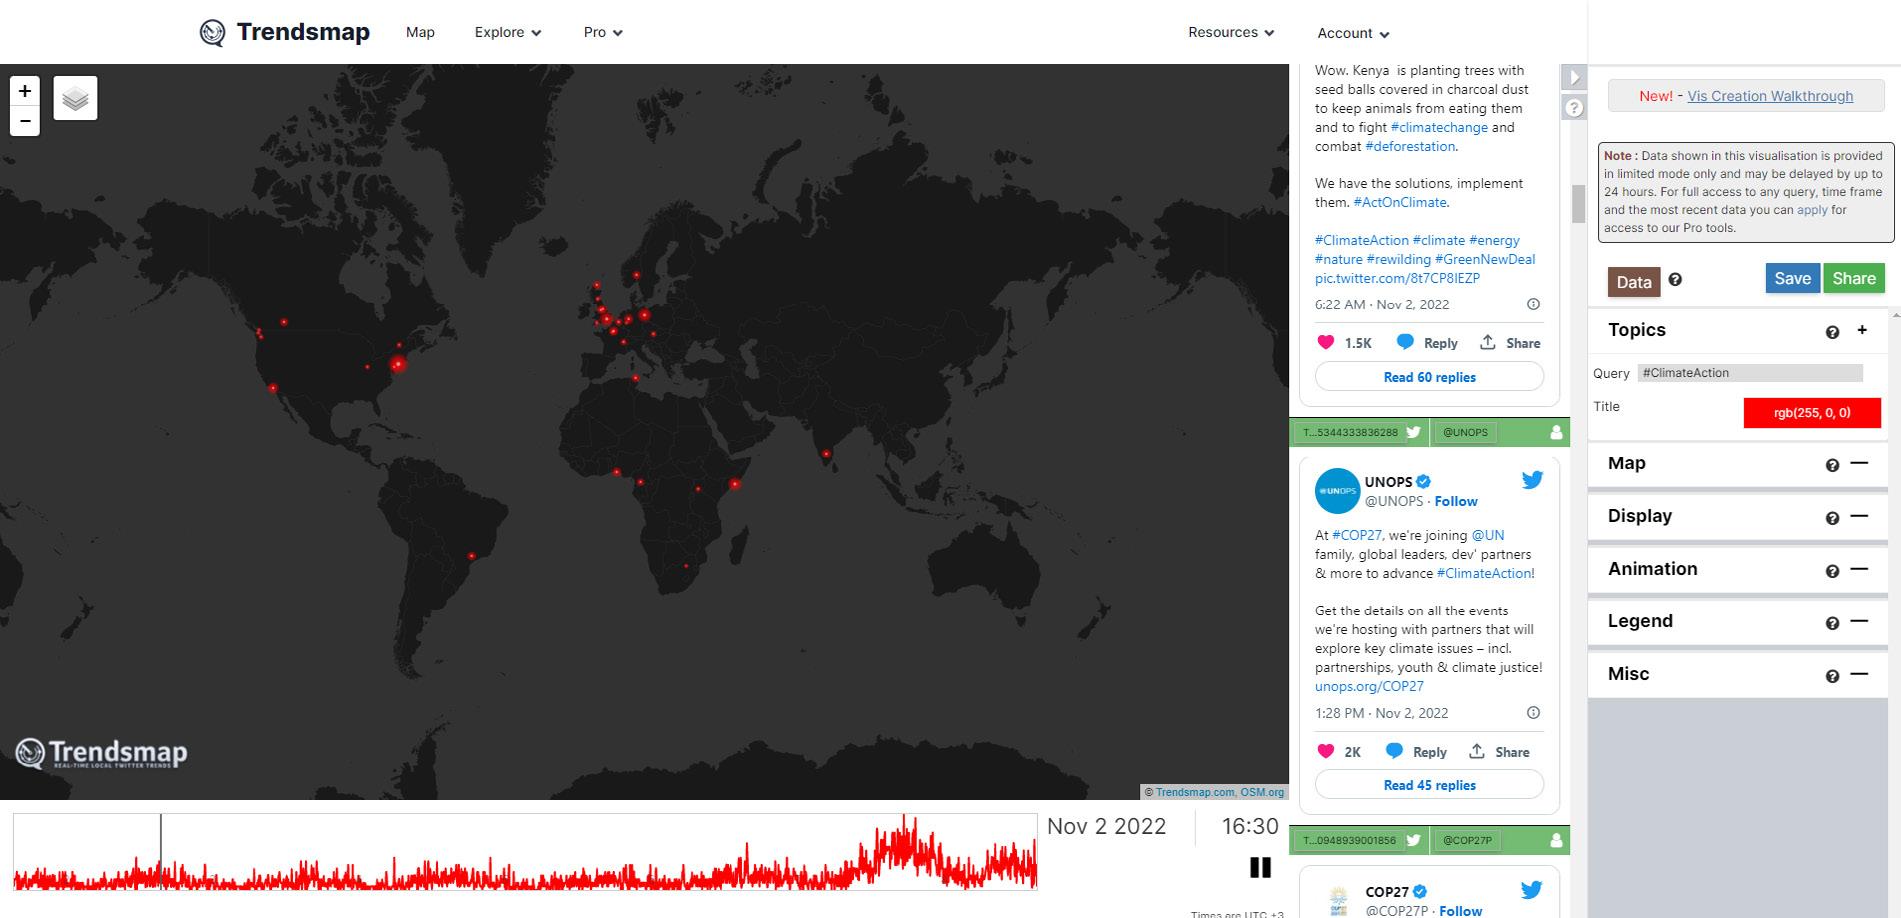
You can use the time filter at the bottom of the map to skip to a particular time or date and see how the hashtag or keyword was trending at that point in time.
The Alert function allows you to configure an email alert system where you will get notified about that particular topic. This functionality, however, requires a paid subscription to Trendsmap.
Tech Tool Practice
For this tool, we will practice by searching for a particular keyword of choice and building an analytics dashboard around it. For my example, I will search for the keyword ’Disinformation’
1. Under the Pro tab, click on Analytics
2. On the search box, we will put in our hashtag of choice and click Update
3. Observe the resulting analytics dashboard and discuss any interesting insights you may encounter.


