20 3. GREENHOUSE GASES 3.1 WATER VAPOUR Tyndall (1865) showed that the chief greenhouse gas is water vapour. In order to find whether the influence of greenhouse gases is changing, it is necessary to have a record of water vapour concentrations everywhere in the earth’s atmosphere for a past period. No such knowledge is possible, so no attempt to calculate its effects is possible. The attempt to study water vapour was therefore abandoned in favour of the next most important greenhouse gas, carbon dioxide. It reminds one of the story of the man who lost his wallet on a dark night and was found looking under the street lamp “because that’s where the light is”. The contribution of water vapour to the total greenhouse effect is difficult to assess because the infrared absorption bands of water vapour overlap those of carbon dioxide. Kiehl and Trenberth (1997) obtain a figure of approximately 60% of the total, but provide no uncertainty figures. The concentration of water vapour in the atmosphere is said to range between 0 and 4% but actual figures or even estimates are elusive. Humphreys (1942) gives the following: Equator 50ºN 70ºN
2.63% 0.92% 0.22%
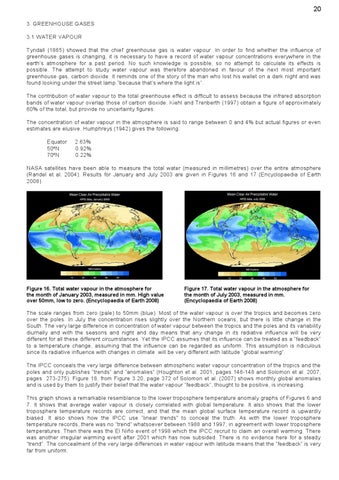
NASA satellites have been able to measure the total water (measured in millimetres) over the entire atmosphere (Randel et al. 2004). Results for January and July 2003 are given in Figures 16 and 17 (Encyclopaedia of Earth 2008)
Figure 16. Total water vapour in the atmosphere for the month of January 2003, measured in mm. High value over 50mm, low to zero. (Encyclopaedia of Earth 2008)
Figure 17. Total water vapour in the atmosphere for the month of July 2003, measured in mm. (Encyclopaedia of Earth 2008)
The scale ranges from zero (pale) to 50mm (blue). Most of the water vapour is over the tropics and becomes zero over the poles. In July the concentration rises slightly over the Northern oceans, but there is little change in the South. The very large difference in concentration of water vapour between the tropics and the poles and its variability diurnally and with the seasons and night and day means that any change in its radiative influence will be very different for all these different circumstances. Yet the IPCC assumes that its influence can be treated as a “feedback” to a temperature change, assuming that the influence can be regarded as uniform. This assumption is ridiculous since its radiative influence with changes in climate will be very different with latitude “global warming”. The IPCC conceals the very large difference between atmospheric water vapour concentration of the tropics and the poles and only publishes “trends” and “anomalies” (Houghton et al. 2001, pages 146-148 and Solomon et al. 2007, pages 273-275). Figure 18, from Figure 3.20, page 372 of Solomon et al. (2007) shows monthly global anomalies and is used by them to justify their belief that the water vapour “feedback”, thought to be positive, is increasing. This graph shows a remarkable resemblance to the lower troposphere temperature anomaly graphs of Figures 6 and 7. It shows that average water vapour is closely correlated with global temperature. It also shows that the lower troposphere temperature records are correct, and that the mean global surface temperature record is upwardly biased. It also shows how the IPCC use “linear trends" to conceal the truth. As with the lower troposphere temperature records, there was no “trend” whatsoever between 1988 and 1997, in agreement with lower troposphere temperatures. Then there was the El Niño event of 1998 which the IPCC recruit to claim an overall warming. There was another irregular warming event after 2001 which has now subsided. There is no evidence here for a steady “trend”. The concealment of the very large differences in water vapour with latitude means that the “feedback” is very far from uniform.