


www. LIVEIN TheRanches.com JANUARY 2023 Edition THE RANCHES #1 PARKLAND REAL ESTATE TEAM 6 YEARS IN A ROW Permit # 3018 11555 Heron Bay Blvd. Suite 200 Coral Springs FL, 33076 954.609.0591 Michael@ParklandParrot.com Presented by Michael Citron Prepared Exclusively for REAL ESTATE MARKET REPORT t HIGHEST SALE IN 2022 PARKLAND GOLF SOLD FOR $2,400,000 135 HOMES SOLD $ 101.3% $757,846 13 DAYS LIST TO SALES PRICE RATIO IN OVER ASK SALES PRICE AVERAGE DAYS ON MARKET YEAR IN REVIEW $111,667,209 IN SALES www. LIVEIN TheRanches.com JANUARY 2023 Edition 5945 NW 66th Avenue LISTED AT $1,399,900 NEWLY LISTED
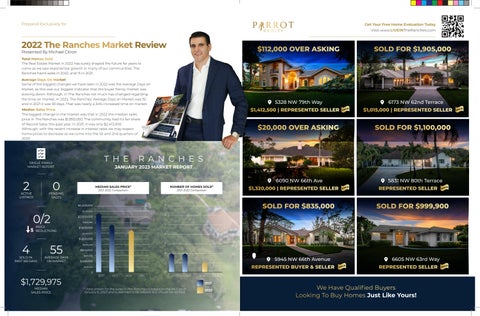
2022 The Ranches Market Review
 Presented By Michael Citron
The Real Estate Market in 2022 has surely shaped the future for years to come as we saw exponential growth in many of our communities. The Ranches had 6 sales in 2022, and 15 in 2021.
Total Homes Sold Average Days On Market
Some of the biggest changes we have seen in 2022 was the Average Days on Market, as this was our biggest indicator that the buyer frenzy market was slowing down. Although, in The Ranches not much has changed regarding the time on market. In 2022, The Ranches’ Average Days on Market was 92 and in 2021 it was 93 days. That was nearly a 34% increased time on market.
Median Sales Price
The biggest change in the market was that in 2022 the median sales price in The Ranches was $1,850,000. The community had it’s fair share of Record Sales this past year. In 2021, it was only $2,413,000. Although, with the recent increase in interest rates we may expect home prices to decrease as we come into the 1st and 2nd quarters of 2023.


0/2
55
0 4

$1,729,975

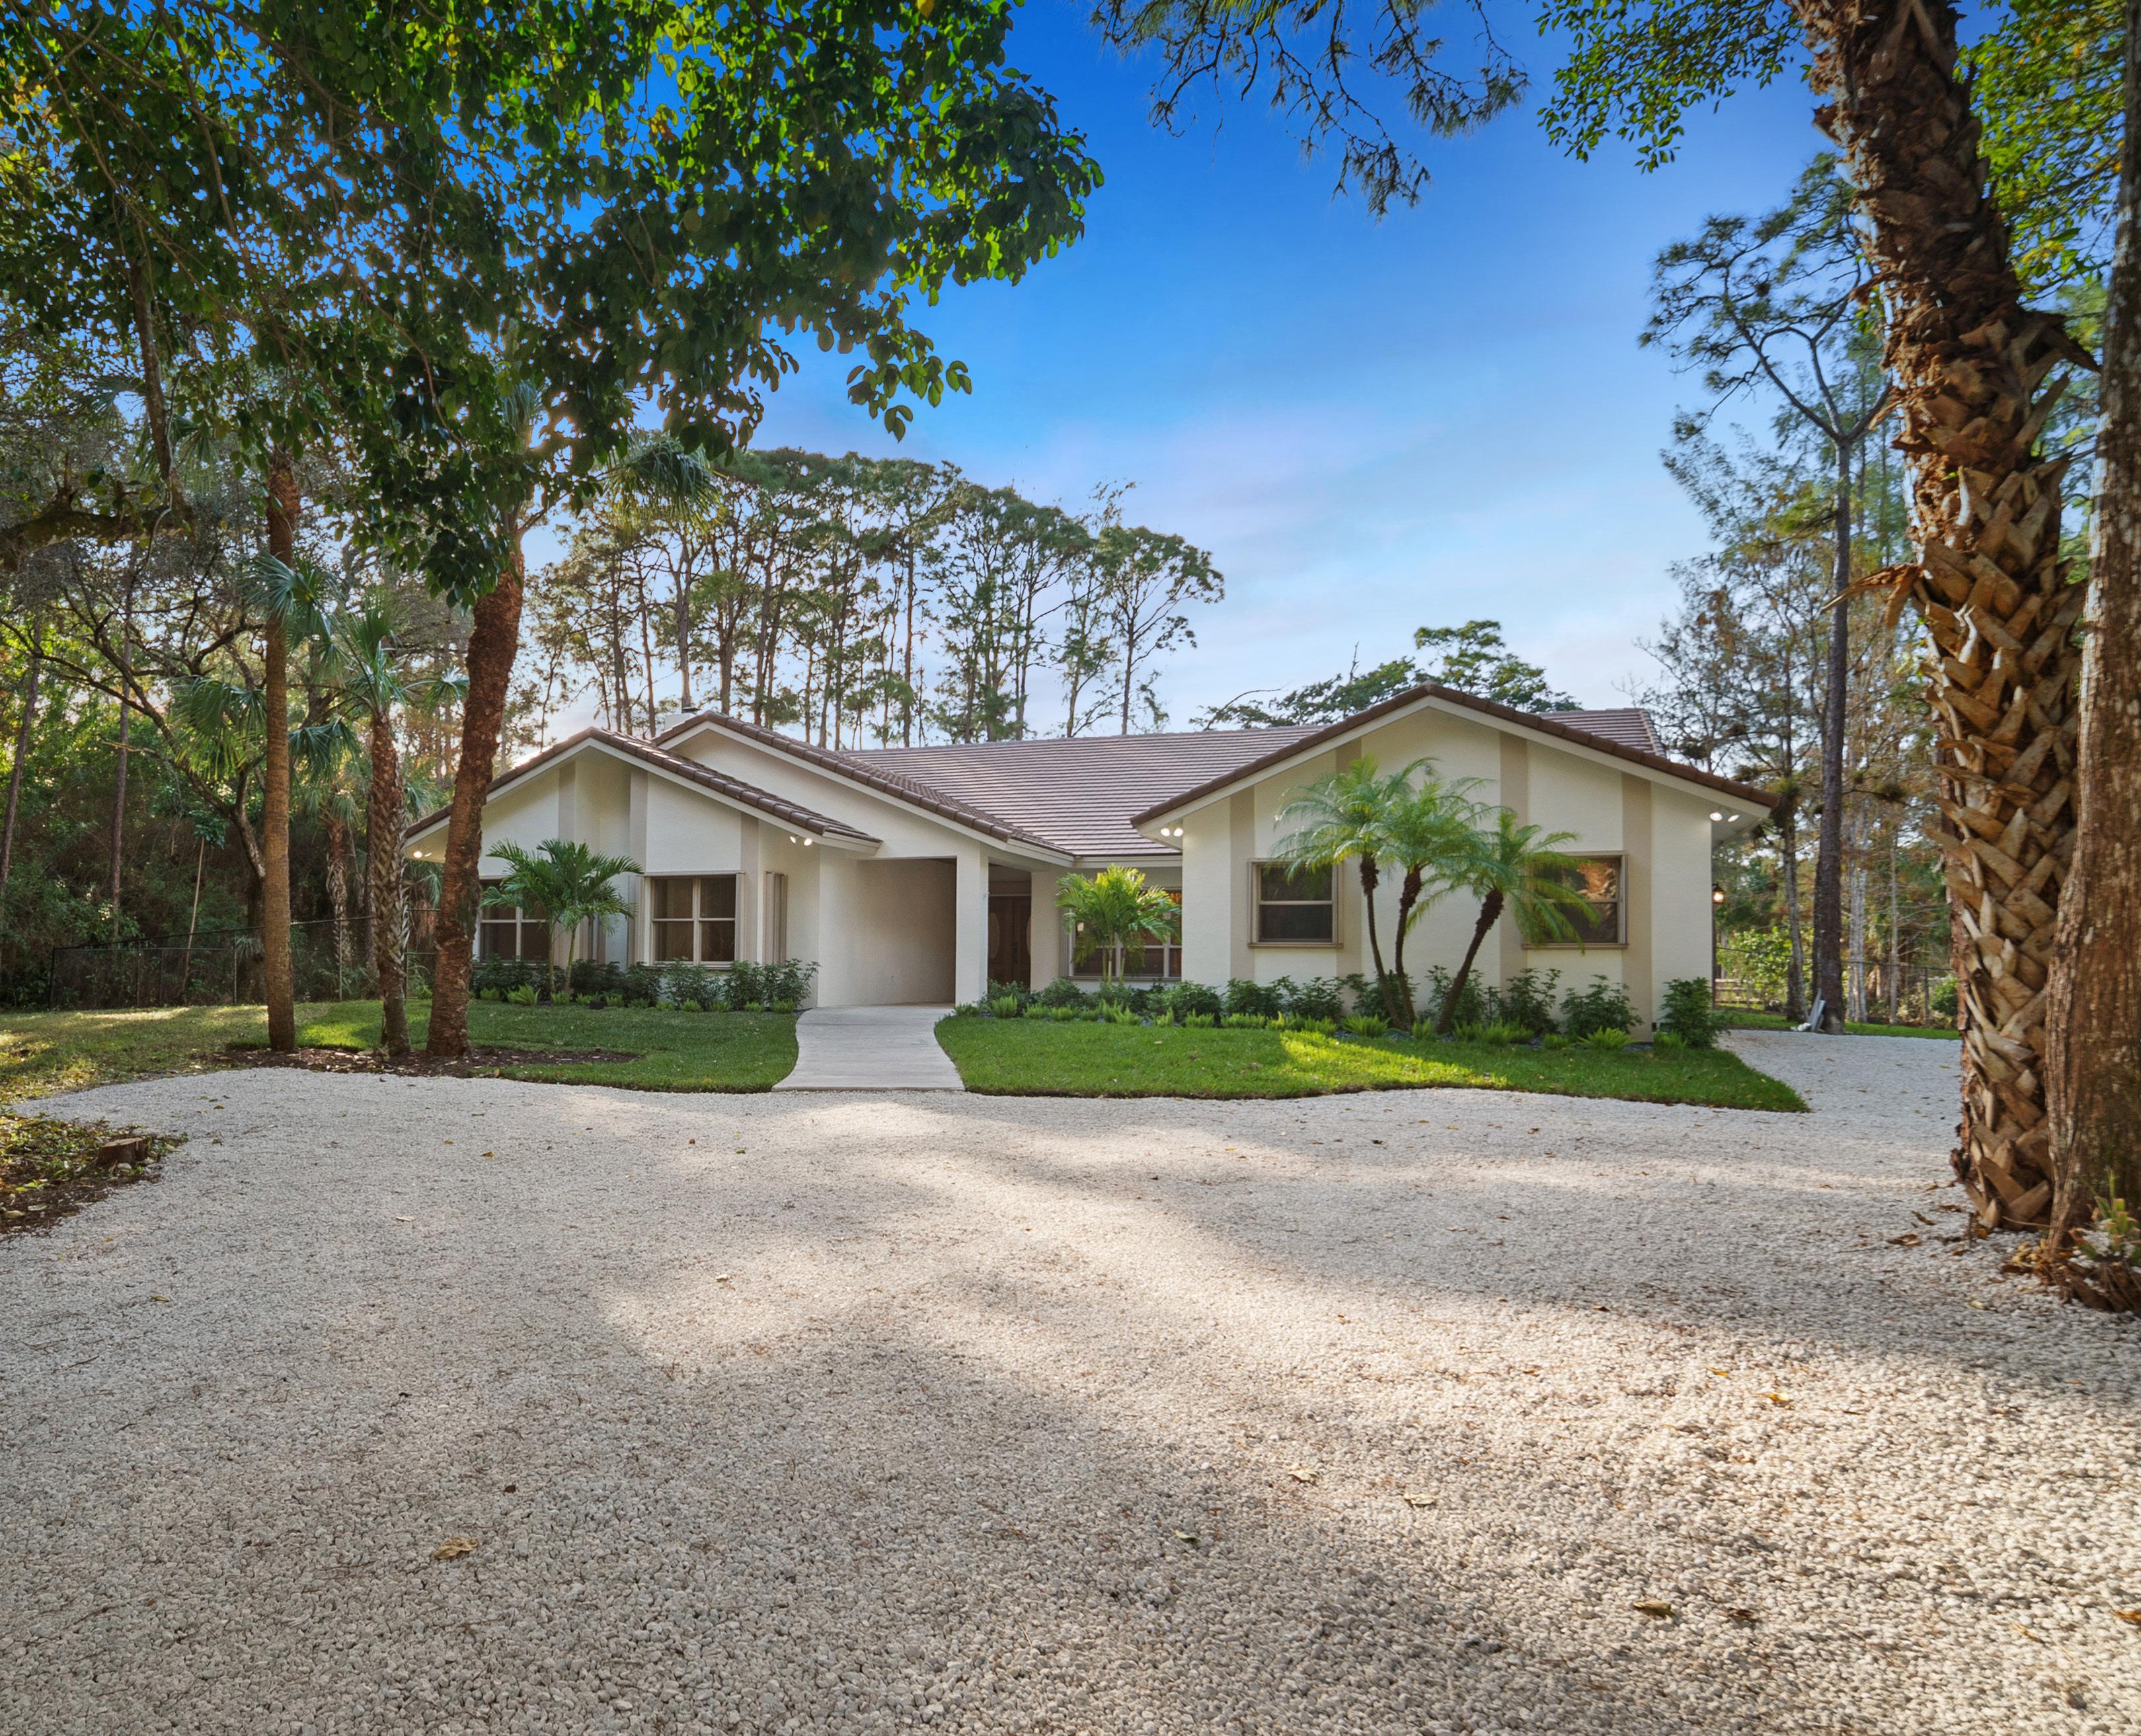
We Have Qualified Buyers Looking To Buy Homes Just Like Yours! $1,412,500 | REPRESENTED SELLER REPRESENTED BUYER & SELLER $1,015,000 | REPRESENTED SELLER REPRESENTED SELLER $112,000 OVER ASKING SOLD FOR $835,000 SOLD FOR $1,905,000 SOLD FOR $999,900 5328 NW 79th Way 5945 NW 66th Avenue 6173 NW 62nd Terrace 6605 NW 63rd Way REPRESENTED SELLER SOLD FOR $1,100,000 5831 NW 80th Terrace $1,320,000 | REPRESENTED SELLER $20,000 OVER ASKING 6090 NW 66th Ave IN 2 DAYS! Prepared Exclusively for THE RANCHES JANUARY 2023 MARKET REPORT 2022 2021 NUMBER OF HOMES SOLD* 2021-2022 Comparison MEDIAN SALES PRICE* 2021-2022 Comparison Get Your Free Home Evaluation Today Visit www.LIVEINTheRanches.com $2,400,000 $2,200,000 $2,000,000 $1,800,000 $1,600,000 $1,400,000 $1,200,000 $1,000,000 $800,000 $600,000 $400,000 $200,000 0 SEPT OCT NOV DEC 7 6 5 4 3 2 1 0 SEPT OCT NOV DEC *Data shown for the sales in The Ranches is based on the MLS as of January 6, 2023 and is deemed to be reliable but should be verified. SINGLE FAMILY MARKET REPORT ACTIVE LISTINGS AVERAGE DAYS ON MARKET PENDING SALES SOLD IN PAST 180 DAYS MEDIAN SALES PRICE
2
PRICE
REDUCTIONS