
The Hidden Rise of UK Pesticide Use: Fact-checking an Industry Claim
March 2018
The pro-pesticide lobby regularly claim that “the amount of pesticides used in the UK has halved since 1990”. It uses this statistic to respond to growing public concerns over the negative impacts caused by pesticides and to resist calls for stricter regulations or restrictions on pesticide use. Ultimately, it is used to imply that UK citizens and the natural environment are less exposed to the harmful impacts of pesticides than they were 25 years ago and we therefore don’t need stronger protection measures.

But is this claim accurate and does it really reveal that we are less exposed to pesticides than in 1990?
This briefing from PAN UK takes a closer look at this claim. We will show that it is misleading and hides the fact that, in many cases, and by most internationally accepted measures, pesticide use is rising as is our exposure to their harmful impacts.
Pesticide use in the UK is extremely complex and the aim of this briefing is not to give the reader a complete picture. Rather it will highlight a range of ways in which UK pesticide use is rising, in contrast to the line touted by the pesticide industry.
Unless otherwise stated, all figures in this briefing are taken from publicly available, official UK government data. The Pesticide Usage Survey Statistics (PUS STATS) are hosted on the website of Fera Science Ltd (Fera) on behalf of Defra and can be accessed at: https://secure.fera.defra.gov.uk/pusstats
Response from the National Farmers Union in January 2018 to polling which revealed that 67% of UK citizens think that the use of pesticides should be reduced:
“…British farmers remain committed to continued high levels of consumer and environmental protection, which they achieve by having food production standards that are among the best in the world. The amount of pesticides used in the UK has halved since 1990. Farmers continue to adopt an integrated approach to pest management which sees them use a mixture of traditional and modern farming methods to deal with problems and ensure the use of pesticides is kept to a minimum.” 1
HAS THE AMOUNT OF PESTICIDES USED IN THE UK HALVED SINCE 1990?
This statement refers to the weight of the total amount of pesticides used in agriculture across Great Britain. As such, it excludes data for Northern Ireland and only refers to agriculture, ignoring the pesticides used in the amenities sector and in urban areas such as parks, playgrounds and pavements. And yet these two fairly significant omissions are not the key problem with the statistic.
In fact, the central problem with this claim, and what makes it so misleading, is that it measures pesticides usage solely in weight and ignores the relative toxicity. In fact, the toxicity of pesticides has increased so dramatically since 1990 that the amount (or weight) of a chemical required to do the same job has reduced significantly. As pesticides become more and more powerful, measuring their usage by weight becomes increasingly irrelevant and misleading. Despite this, pro-pesticide groups continue to rely on statistics based on weight in order to lull concerned citizens and decision-makers into thinking that there isn’t a problem.
Therefore, in a literal sense, and ignoring the omissions outlined above, the statement touted by the pro-pesticide lobby is for the most part factually accurate. Publicly available data from Fera Science shows that pesticide usage in Great Britain did go from 34.4 million kilograms (kg) in 1990 to 16.9 million kg in 2016, equalling a reduction of roughly 51%. However, using this flawed metric to illustrate that people and environment are less exposed to the harmful impacts pesticides is misleading. You have to question why, given the fact these groups have access to all the relevant data, they continue to use such a flawed metric.
WHAT'S ACTUALLY HAPPENING?
In fact, since 1990, the exposure of the UK public and environment to pesticides has increased in the following ways:
1) The toxicity of pesticides has increased over time so that less chemical is required in terms of weight but the damage to the environment remains the same or, in some cases, worse (pg 3).
2) The area of land being treated with pesticides has increased (pg 5).
3) The number of times crops are treated with pesticides has increased (pg 5).
4) The variety of different pesticides being used on particular crops has increased (pg 6).
Throughout this briefing we have chosen to focus on a limited number of the UK’s most dominant crops - cereals (primarily wheat and barley) and oilseeds (such as rapeseed and soybean) – which are the most widely grown in the UK - and potatoes which are the most popular vegetable by volume of sale.2
1)INCREASES IN THE TOXICITY OF PESTICIDES
In this section, we have chosen to look at the toxicity of insecticides due to their direct impact on insect life, particularly on bees and other non-target pollinator species, which in turn has a huge knock on effect on biodiversity. According to 2016 data, pyrethroids are the most widely-used insecticides in the UK in terms of area of land treated, with neonicotinoids coming in second. For this reason we have focussed on these two classes of insecticides which, when combined, are applied to 4.6 million hectares of UK land.
i)Pesticides are becoming increasingly toxic
“1 gram – little more than the weight of a sachet of salt – would provide an LD50 to 250 million honeybees, or roughly 25 metric tonnes of bee. They are neurotoxins, binding to neural receptors in the brain and causing swift paralysis and death.”
Professor Dave Goulson, Sussex University, talking about neonicotinoids.3
To put the above quote into context, by volume, modern neonicotinoid insecticides are 10,000 times more potent than DDT4 (history’s most notorious pesticide which was banned globally in 2001 due to concerns about harm to the environment and human health). ). Because they are more potent, we require smaller amounts of newer pesticides than we did of their older equivalents. Therefore while the weight of pesticides used in UK agriculture may have decreased, the rise in toxicity means that we are no less exposed to their harmful impacts.
In order to illustrate this point, Table 1 charts some of the changes and developments in the types of insecticides that have been used in the UK and globally since 1945.
The table gives the figures, where available, of the LD50 (lethal dose 50%) for acute and dermal absorption by honey bees. The value of LD50 for a substance is the dose required to kill half the members of a tested population after a specified test duration. LD50 figures are frequently used as a general indicator of a substance's acute toxicity. A lower LD50 is indicative of increased toxicity as it shows that it takes less of a substance to kill half the population.

This is a simple snap shot of toxicity showing that the acute toxicity of commonly-used insecticides to honey bees has increased tenfold from Lindane in 1945 to neonicotinoids in the 1990s.
Table 1. Changing toxicity of commonly used insecticides5
ii) New pesticides are added to the toxic burden instead of replacing older pesticides
It is claimed that advances in pesticide chemistry mean that older ‘nastier’ pesticides are replaced by safer chemicals. However, this is far from true. In fact, newer pesticides tend to be added to farmers’ chemical arsenal, rather than replacing older chemicals. The case of neonicotinoids is an excellent illustration of this. Neonicotinoids were designed, in part, to replace pyrethroid insecticides due to concerns over the latter’s impacts on the environment. However, Table 2 illustrates how, instead of replacing pyrethroids, neonicotinoids have simply become an additional chemical for our environment to cope with.
Polling Reveals British Public Want Less Pesticides
Despite propaganda from the agrochemical industry, the UK public remains extremely concerned about the harmful impacts of pesticides. Polling commissioned by PAN UK and SumOfUs in September 2017 revealed that:
• 67% of people think that UK pesticide use should be reduced.
• 63% of UK citizens want EU regulations on pesticides to be incorporated into British law after Brexit. This includes 77% of those who voted Remain and 57% of Leavers.

• 78% of those polled wanted the government to provide more support to British farmers working hard to reduce their pesticide use.
• 80% of respondents said that pesticides that have been shown to be hazardous to human health should be completely banned.
• 76% think that pesticides that have been shown to be hazardous to the environment should be completely banned.
• 68% of people want schools, parks, playgrounds and other open spaces in their local area to be pesticide-free.
• Only 52% of respondents said that they trust that the government has made sure that pesticides used on farms and in public spaces in Britain are safe.
Polling commissioned by PAN UK and SumOfUs and conducted by GQR Research, September 2017, https://gqrr.app.box.com/s/0ddbifc853j9k1t1sbjvuc1crvxw8zbc
2) INCREASES IN THE AREA OF LAND BEING TREATED WITH PESTICIDES
The UK has an area of approximately 17.4 million hectares (ha) under agricultural production.7 This includes arable, horticulture and grazing land. Table 3 shows clearly that the actual area treated with pesticides is greater than the amount of physical land available. In fact, for some specific crops there are huge discrepancies between the area of land being treated and the actual area of land that exists. The reason for this is simple, multiple treatments on the same piece of land result in the anomalous situation whereby we are treating more land than we actually have.

3) INCREASES IN THE NUMBER OF TIMES A CROP IS TREATED WITH PESTICIDES
Table 5 shows that, since 1990, the frequency of treatment for each of the crops illustrated has risen. Taking oilseed rape as an example, in 1990 11% of the total crop was treated only once with a pesticide. This had fallen to 1% by 2016, showing that a larger proportion of the crop was treated with pesticides more than once.


4) INCREASES IN THE VARIETY OF PESTICIDES BEING USED ON PARTICULAR CROPS
As an illustration of the variety of active substances being used in UK agriculture, Table 7 details the pesticides used on one field of winter oilseed rape over a single growing season.

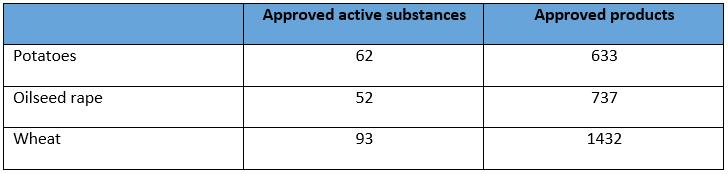
To help illustrate the huge variety of pesticides currently available for use on the three crops we have focussed on, see Table 8.

WHAT ARE THE SOLUTIONS?
Recommendation 1: Adopt alternative metrics for measuring pesticide use
In order to meaningfully measure pesticide usage in the UK we must immediately stop using weight as a metric and switch to a different measure. PAN UK is calling for the UK to adopt two new metrics: treatment frequency index (TFI) and number of doses (NODU). Both of these are already used by a number of European countries, including France and Denmark.12
Using these new metrics would provide a much clearer picture of the key pieces of information we are ultimately trying to discover – namely to what extent are UK citizens and our natural environment exposed to the harmful impacts of pesticides and what we need to do to protect them. It would also assist in developing a reliable indicator for the UK’s post-Brexit agricultural subsidy payment scheme, enabling us to target support at farmers working hard to reduce their pesticide use.
Recommendation 2: Measure pesticide use at a landscape-scale
In 2017, Defra Chief Scientist Professor Ian Boyd expressed concerns that the UK lacks a system for monitoring the overall amount of pesticides the natural environment can handle.
He states “Without knowledge of safe environmental limits, the total pesticides used— and therefore the total environmental dose—is governed by market demand rather than by a limit on what the environment can endure. There is little information about where, when, and why pesticides have been used, making it very difficult to quantify potential environ¬mental effects.” 13
PAN UK strongly supports the call to move for the introduction of a more holistic regulatory system which is capable of assessing the environmental impact of pesticides in a more rounded way. Adopting meaningful metrics for measuring pesticide use will be vital to underpin such a system.
Recommendation 3: Introduce a reduction target for pesticide use
Post-Brexit, the UK should follows the example of countries such as Denmark and France by introducing a clear quantitative pesticide reduction target, measured using the metrics described above of treatment frequency index (TFI) and number of doses (NODU).
The monitoring required to assess progress on meeting a reduction target would improve our understanding of how pesticides affect the environment at a landscapescale. It would also provide valuable indicators of the progress being made in broader environmental areas such as soil health and biodiversity, both of which are key focusses of the UK government’s 25 Year Environment Plan.
Unless otherwise stated, all figures in this briefing are taken from publicly available, official UK government data. The Pesticide Usage Survey Statistics (PUS STATS) are hosted on the website of Fera Science Ltd (Fera) on behalf of Defra and can be accessed at: https://secure.fera.defra.gov.uk/pusstats
1 New poll finds public uneasy about pesticide use, Farmers Guardian, 31/01/2018 - https:// www.fginsight.com/news/news/newpoll-finds-public-uneasy-about-pesticideuse-51422
2 UN FAO, FAOSTAT, crop statistics for UK, 2016, http://www.fao.org/faostat/en/#data/ QC
3 Neonicotinoids and Bees; what is the fuss all about?, Professor Dave Goulson, 07/05/2013 - http://splash.sussex.ac.uk/blog/for/dg229/ by/tag/pesticide
4 An overview of the environmental risks posed by neonicotinoid insecticides, Dave Goulson, Journal of Applied Ecology 2013, page 1 - https://www.sussex.ac.uk/webteam/ gateway/file.php?name=goulson-2013-jae. pdf&site=411
5 University of Hertfordshire Pesticide Properties Database, https://sitem.herts. ac.uk/aeru/ppdb/en/atoz.htm
6 Pesticide Usage Survey Statistics (PUS STATS) do not provide statistics for neonicotinoids as a group. For data on neonicotinoids, search each of the five active substances separately. They are; clothianidin, imidacloprid, thiamethoxam, acetamiprid and thiacloprid https://secure.fera.defra.gov.uk/ pusstats/
7 Defra UK Farming Statistics, Table 2.1 Agricultural land use, 25/05/2017, https:// www.gov.uk/government/uploads/system/ uploads/attachment_data/file/629227/AUKChapter3-17jul17.ods
8 Total area statistics (left-hand column) taken from Defra UK Farming Statistics, Table 2.1 Agricultural land use, 25/05/2017, https:// www.gov.uk/government/uploads/system/ uploads/attachment_data/file/629227/AUKChapter3-17jul17.ods; Pesticides statistics (all remaining columns) taken from Pesticide Usage Survey Statistics (PUS STATS), Fera Science Ltd (Fera), https://secure.fera.defra. gov.uk/pusstats/
9 Data taken from presentation to Royal Society of Medicine given by the Soil Association at conference entitled ‘Pesticides and food: is low dose exposure harmful?, 20/11/2017, data purchased from Fera but not publically available.
10 Blog by Professor Dave Goulson, ‘Does anyone remember Rachel Carson? More on pesticides and bees…’, Sussex University, 16/01/2017 - http://splash.sussex.ac.uk/blog/ for/dg229/by/tag/pesticides
11 Pesticides Register of UK Authorised Products, Health and Safety Executive (HSE), https://secure.pesticides.gov.uk/pestreg/
12 Pesticide Use Reduction is Working; An assessment of national reduction strategies in Denmark, Sweden, the Netherlands and Norway, Pesticide Action Network Europe, December 2003, page 13 - https://www. pan-europe.info/old/Resources/Reports/ Pesticide_Use_Reduction_is_Working.pdf
13 Toward pesticidovigilance, Alice M. Milner, Ian L. Boyd, Science, 22 Sep 2017: Vol. 357, Issue 6357, pp. 1232-1234
- http://science.sciencemag.org/ content/357/6357/1232.full (article only available with a login)
For more information on PAN UK’s recommendations for the UK pesticide regime post-Brexit, visit:
http://www.pan-uk.org/uk-policy