9 minute read
Understanding the benchmark KSE100 index


What are the dynamics and technicalities behind the benchmark index of the PSX?
By Muhammad Raafay Khan
Advertisement
Whenever there is a need to mention the stock market in Pakistan, news media outlets toss out the term ‘KSE100’ and expect everyone to automatically understand it. Truth be told, most don’t and no one bothers to explain it.
To the uninitiated, the KSE100 is some sort of a creature which falls down, takes a beating, and every now and then straightens up only to come crashing down again. The term is elusive; important but complicated.
This has gone on for far too long. And so we thought, perhaps, we could attempt to try to understand it together.
Indexes and the KSE100
A stock market index is essentially a tracker, a way to measure how a certain group of stocks from an industry or industries are performing in the stock market at any given time. They can include 10, 100, 500 or even all of the stocks in the stock market. The most famous index in the world is the S&P 500 index, which tracks the share prices of the 500 largest public companies in the United States of America.
At home in the Pakistan Stock Exchange (PSX), the equivalent of the S&P 500 is the KSE100 index.
The index comprises 100 companies selected on the basis of sector representation and highest free-float capitalisation or cap (we’ll explain this in a bit), which captures around 80% of the total free-float capitalisation of the companies listed on the exchange. Out of the total 36 sectors on the PSX, 35 companies are selected i.e. the company from each sector with the largest free-float market cap (excluding Open-End Mutual Fund Sector) and the remaining 65 companies are selected on the basis of largest free-float capitalisation
in descending order. The KSE100 is a total return index, meaning that it adjusts itself for dividends, bonus and rights issues.
The primary objective of the KSE100 index is to have a benchmark by which the stock-price performance can be compared with one’s investment portfolio over a period of time. In particular, the KSE100 is designed to provide investors with a sense of how the Pakistan equity market is performing. Thus, the KSE100 is similar to other indicators that track various sectors of the Pakistan economic activity such as the gross national product, consumer price index, and so on.
The KSE100 Index was introduced in November 1991 with a base value of 1,000 points. Until 2012, the total market cap was used to select the 100 companies for the index. But in 2012, this was changed to select companies based on only the free-float market cap. This change was brought into effect from October 15, 2012. Now, we have the recomposed KSE100 Index based on free-float market cap instead of total market cap.
The total market cap is the total market value of a company calculated as the current market price of the company’s share multiplied by the total number of outstanding shares of the company. But note that the market cap of the company is not the most accurate representation of that company’s worth on the exchange. This is because of something called the free float. The free float represents the portion of shares available on the exchange for actual trading in the market. So while a company may have the highest market cap in total, if it is only trading 5% or 10% of its shares on the PSX, then that is the yardstick by which it will be included in the KSE100 index.
The free float means the proportion of total shares issued by a company that are readily available for trading at the Stock Exchange. It generally excludes the shares held by controlling directors, sponsors, promoters, government and other locked-in shares not available for trading in the normal course.
Because of its general representation of the stock market, the KSE100 index is often used as a benchmark against which investors compare their returns. If an investment portfolio gives a higher return than the KSE100, it is considered a decent portfolio performance and vice versa if the portfolio loses against the KSE100.

Historic performance of the KSE100
At the start of 2022, last year, the KSE100 index was at 44,000 index points. By the end of the year, the index had lost more than 4,000 points to close at just below 40,000. This was a negative return of -10%.
According to research by Topline Securities, the losing streak of the KSE100 index in 2022 made PSX the worst performing asset class across a number of assets. It gave worse returns than gold, property, bonds, T-bills, bank deposits, etc. If anyone had invested Rs 100,000 in the KSE100 index at the start of 2022, the value of that investment would have been Rs 90,000 by the end of the year.
On the other hand, since gold posted a return of 40% in the same year, if someone had invested the same amount in gold, the total value of that investment would have been Rs 140,000.
If we take a step back, however, and look at the KSE100 index returns over a longer time period, we see that the KSE100 index performed much better historically for a 12 year period. At the start of 2010, the KSE100 was at 10,000 points. By 2022, the index was at 40,000. This is a significant return of 300% in 12 years. If this was a 10year period, the return would have been the same.
However, if we only add the first three months of 2020 into the 10-year picture, making our time period a total of 10 years and three months, we see that the index lost over 10% of its worth from the start of 2020 due to the COVID pandemic. So a particular period of time is the most important factor when comparing the KSE100 performance.
All in all, most analysts believe that the stock market gives a positive return in the long term. Beginners in the market often think that beating the KSE100 is an easy task but more experienced PSX investors will tell you that it is no simple feat. And instead of trying to come up with an original portfolio that might beat it, sometimes it is simply better to just invest in the index.


KSE100 versus stocks in 2022
While the KSE100 index is an important indicator of how PSX is performing, many prefer to invest in the individual company’s stocks. Let’s focus on four companies in the KSE100 for 2022 to make it clear to readers how different stocks can offer different returns. From this comparison we will see that some companies got the better of the KSE100 index, while others lost to it.
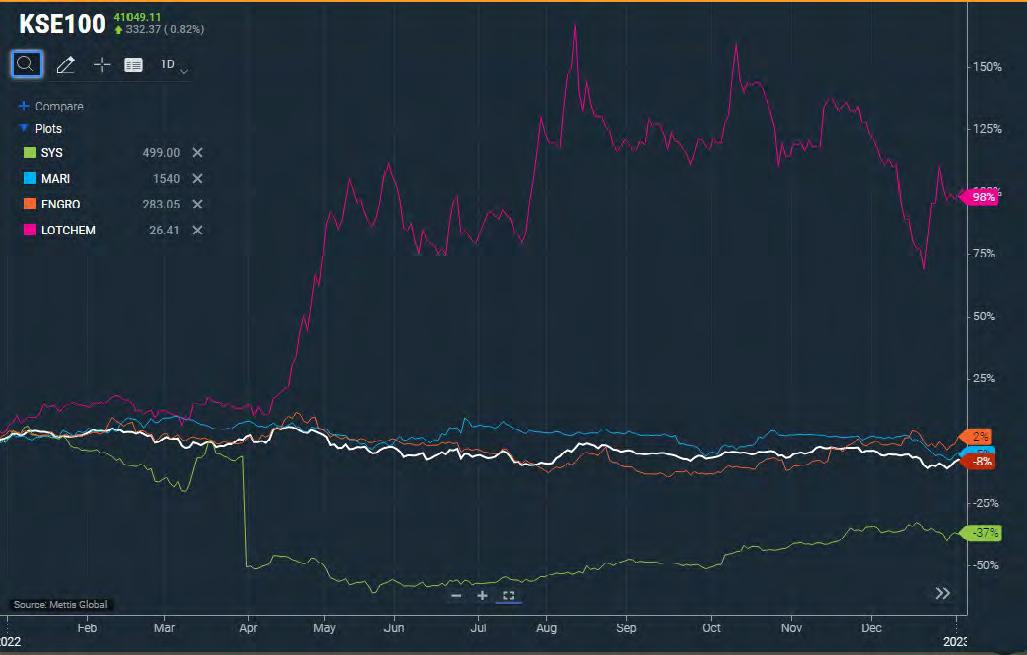
<Insert KSE100 stocks comparison chart>
The KSE100 stock market comparison chart shows the performance of the KSE100 index and four other stocks in the year 2022 (give or take a few days). The four companies’ stocks we chose to compare are Engro Corporation Limited (ENGRO), Systems Limited (SYS), Mari Petroleum Company Limited (MARI), and Lotte Chemical Pakistan Limited (LOTCHEM).
These four have different weightage and impact on the index. The weights represent the position of the company in the index according to their free-float market cap. ENGRO and SYS are the two biggest companies on the index right now which form 5.8% and 5.4% weight of the index respectively. MARI comes at number 15 with a weight of 2.66%. And finally LOTC comes at number 35 with an index weightage of 0.64%.
The KSE100 index posted a return of -8% while ENGRO approximately gave a return of 2%. ENGRO beat the index by almost 10%. However, if we look at the second biggest stock on the index, SYS, we see that its total return was -37%, making it a loser compared to the KSE100 index by almost 30%.
MARI gave a total return of -5%, beating the KSE100 by a marginal 3-4%, but still giving a negative return; a winner in comparison but a loser on its own. Lastly, if we look at LOTC, it gave a total return of 98%, beating the index by giving an over 105% return, a clear winner in 2022 (hurrah).
The aim of an investor is to select a portfolio of stocks which can give a better return than the KSE100, which essentially means beating the market. But in this selection of stocks lies the ultimate challenge for PSX investors.
The KSE100 index represents a selection of 100 stocks in the PSX. It is used as a benchmark index against which investors compare their portfolios. If a portfolio beats the index, it is generally considered a good return. Most investors aim to beat it but only few actually manage to do so. The KSE100 posted a negative return of -10% in the year 2022, making PSX one of the worst performers across different asset classes. But in the longer term (10+ years), the KSE100 has historically given returns of over 100%, making the PSX a viable avenue for investment. n Author’s disclaimer: This article is not meant as an investment advice.

TTP to wind up commercial activities by 8:30pm and dinner functions by 10:00pm: Kh Asif

By The Dependent
The proscribed Tehrik e Taliban Pakistan (TTP) will have to play by the rules when it comes to the implementation of the government’s new energy conservation policies.
“We have told them clearly that all commercial activities, whether it is kidnapping-for-ransom or smuggling, shall have to wind down everyday by 8:30 pm,” said defence minister Khwaja Asif in a press conference. “And their banquets and dinners have to end by 10:00pm.” Khawaja Asif told journalists that measures approved by the cabinet aim to save the cash-strapped country about Rs62 billion ($273.4 million) and help reduce the energy import bill.
“I had said about our Taliban brother that others have the powers but they have God,” said the defence minister, referencing his tweet when the Taliban took over Kabul in 2020. “Well, now they have deadlines as well.”
“Look, we have been very accommodating towards the student militia. The least they can do in return is respect our timings and eat us last.”