ROA Forum Figures for period May 1, 2017 to April 30, 2018
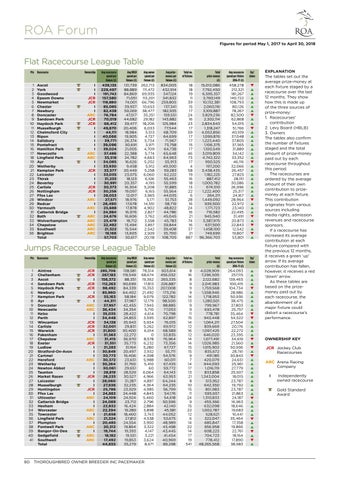
Flat Racecourse League Table Ptn Racecourse
1 2 3 4 5 6 7 8 9 10 11 12 13 14 15 16 17 18 19 20 21 22 23 24 25 26 27 28 29 30 31 32 33 34 35 36
Ascot York Goodwood Epsom Downs Newmarket Chester Newbury Doncaster Sandown Park Haydock Park Musselburgh Chelmsford City Ripon Salisbury Pontefract Hamilton Park Newcastle Lingfield Park Ayr Wetherby Kempton Park Leicester Thirsk Beverley Carlisle Nottingham Ffos Las Windsor Redcar Yarmouth Catterick Bridge Bath Wolverhampton Chepstow Southwell Brighton Total
Ownership
Avg racecourse spend per fixture (£)
Avg HBLB spend per fixture (£)
Avg owner spend per fixture (£)
Avg prizemoney per fixture (£)
Total no. of fixtures
Total prize-money (£)
Avg racecourse spend per fixture 2016-17 (£)
I I I JCR JCR I I ARC JCR JCR I I I I I I ARC ARC I I JCR I I I JCR JCR I ARC I ARC I ARC ARC ARC ARC ARC
439,135 229,497 191,742 157,580 118,880 85,085 82,438 76,784 70,019 66,412 49,870 44,111 40,066 39,771 39,096 39,024 37,486 35,518 34,085 33,930 33,577 33,035 31,235 30,991 30,373 30,256 28,053 27,571 26,490 25,688 24,984 24,676 23,479 22,492 21,322 19,166 57,703
131,739 88,889 84,869 71,051 74,001 39,937 59,269 47,517 44,682 39,477 20,406 18,984 19,905 26,374 30,691 21,005 22,388 24,782 16,626 9,458 20,449 23,075 18,123 20,357 16,304 19,097 12,017 18,976 17,678 17,878 16,976 16,606 18,712 13,494 15,544 13,605 30,617
262,713 111,472 69,935 113,201 66,796 10,653 38,477 35,251 29,182 18,206 6,033 5,513 4,727 5,734 3,971 4,709 5,774 4,663 5,202 5,912 5,258 6,060 6,106 4,195 5,208 6,165 3,965 5,171 14,551 4,902 2,827 3,762 3,558 3,857 2,542 2,929 20,118
834,005 432,914 347,124 341,832 259,805 137,341 182,935 159,551 143,882 125,984 77,544 68,709 64,699 71,967 73,758 64,738 65,648 64,963 55,913 49,300 59,283 62,222 55,463 55,599 51,885 55,564 44,035 51,753 58,719 48,822 44,786 45,045 45,783 39,844 39,408 35,700 108,705
18 18 19 11 39 15 17 24 16 23 17 59 17 17 15 17 46 73 17 4 58 19 16 18 13 22 6 28 16 24 16 21 74 16 37 21 887
15,012,086 7,792,450 6,595,357 3,760,149 10,132,381 2,060,116 3,109,887 3,829,236 2,302,114 2,834,643 1,318,247 4,053,856 1,099,876 1,223,440 1,106,375 1,100,549 3,019,809 4,742,322 950,525 197,200 3,438,435 1,182,225 887,412 1,000,782 674,510 1,222,400 264,211 1,449,092 939,500 1,171,723 716,582 945,940 3,387,975 637,500 1,458,100 749,699 96,366,703
458,278 212,321 181,267 140,722 108,793 80,126 78,267 82,500 62,868 54,015 51,766 40,109 37,048 37,805 37,365 31,889 34,142 33,352 46,116 32,066 26,457 27,825 28,151 30,586 26,996 25,317 24,167 28,964 22,972 23,140 22,495 31,491 20,873 22,843 12,542 19,807 53,801
Up/ down
t s s s s s s t s s t s s s s s s s t s s s s s s s s t s s s t s t s t s
Jumps Racecourse League Table Ptn Racecourse
1 2 3 4 5 6 7 8 9 10 11 12 13 14 15 16 17 18 19 20 21 22 23 24 25 26 27 28 29 30 31 32 33 34 35 36 37 38 39 40 41
Aintree Cheltenham Ascot Sandown Park Haydock Park Newbury Kempton Park Ayr Doncaster Newcastle Kelso Perth Wincanton Carlisle Warwick Fakenham Chepstow Exeter Ludlow Stratford-On-Avon Cartmel Hereford Wetherby Newton Abbot Taunton Market Rasen Leicester Musselburgh Huntingdon Ffos Las Uttoxeter Catterick Bridge Hexham Worcester Towcester Lingfield Park Plumpton Fontwell Park Bangor-On-Dee Sedgefield Southwell Total
Ownership
Avg racecourse spend per fixture (£)
Avg HBLB spend per fixture (£)
Avg owner spend per fixture (£)
Avg prizemoney per fixture (£)
Total no. of fixtures
Total prize-money (£)
Avg racecourse spend per fixture 2016-17 (£)
Up/ down
JCR JCR I JCR JCR I JCR I ARC ARC I I JCR JCR JCR I ARC JCR I I I ARC I I I JCR I I JCR I ARC I I ARC I ARC I ARC I ARC ARC
285,706 267,183 156,372 112,263 98,492 85,960 55,163 44,311 37,957 36,434 35,035 34,448 34,138 32,001 31,800 31,563 31,415 31,351 31,283 30,849 30,773 30,372 30,264 30,061 28,819 28,233 28,060 27,636 25,786 24,883 24,109 24,089 22,832 22,394 21,658 21,324 20,485 20,312 19,744 18,182 17,492 44,655
138,581 119,549 88,351 90,699 84,339 64,402 58,184 37,987 42,455 34,354 28,422 24,853 35,943 29,831 30,400 22,272 36,970 35,773 31,164 20,497 19,406 23,651 31,760 29,651 28,529 30,527 31,287 32,235 23,929 24,448 24,924 23,712 16,424 19,289 18,460 27,812 24,554 19,864 19,393 19,551 19,853 35,279
78,514 68,674 19,362 17,813 15,353 21,492 9,079 12,179 7,945 5,710 4,614 3,595 5,934 5,262 6,014 0 8,578 6,232 5,280 3,932 4,398 5,988 5,410 60 6,064 4,966 4,897 4,364 4,985 4,845 5,460 2,796 2,884 3,898 3,743 4,538 3,950 3,322 4,147 3,221 3,624 8,671
503,614 456,032 265,335 226,887 207,008 173,216 122,782 98,500 88,885 77,053 70,798 62,897 76,015 69,972 68,589 53,835 76,964 73,356 67,727 55,711 54,576 60,011 67,435 59,772 64,143 63,953 64,244 64,235 56,799 54,176 54,618 50,596 42,140 45,581 44,052 53,675 48,989 43,498 43,445 41,454 40,969 89,298
8 16 8 9 9 9 14 13 9 9 11 15 14 12 16 12 14 14 15 15 9 7 14 17 13 21 8 10 15 11 24 9 15 22 12 6 14 22 14 17 19 541
4,028,909 7,296,505 2,122,682 2,041,983 1,759,568 1,558,946 1,718,953 1,280,501 799,967 693,478 778,781 943,448 1,064,211 839,669 1,097,425 646,020 1,077,491 1,026,985 1,015,902 835,672 491,185 420,079 944,093 1,016,119 833,858 1,343,004 513,952 642,350 851,983 595,937 1,310,833 455,366 632,098 1,002,787 528,621 322,047 685,847 956,958 608,223 704,723 778,412 48,265,568
264,093 257,115 139,465 100,415 104,734 28,986 50,936 38,475 37,803 25,757 35,464 54,522 27,504 20,176 22,272 23,395 34,619 21,560 50,936 28,741 30,843 24,651 25,961 27,779 25,937 18,015 23,787 19,792 23,787 21,863 24,187 16,963 18,646 19,683 16,441 35,464 17,358 19,866 22,761 18,164 17,890 38,983
s s s s t s s s s s t t s s s s t s t s t s s s s s s s s s t s s s s t s s t s t s
EXPLANATION The tables set out the average prize-money at each fixture staged by a racecourse over the last 12 months. They show how this is made up of the three sources of prize-money: 1. Racecourses’ contribution 2. Levy Board (HBLB) 3. Owners The tables also confirm the number of fixtures staged and the total amount of prize-money paid out by each racecourse throughout this period. The racecourses are ordered by the average amount of their own contribution to prizemoney at each fixture. This contribution originates from various sources including media rights, admission revenues and racecourse sponsors. If a racecourse has increased its average contribution at each fixture compared with the previous 12 months, it receives a green ‘up’ arrow. If its average contribution has fallen, however, it receives a red ‘down’ arrow. As these tables are based on the prizemoney paid out by each racecourse, the abandonment of a major fixture could distort a racecourse’s performance.
OWNERSHIP KEY JCR Jockey Club Racecourses ARC Arena Racing Company I
Independently owned racecourse
Gold Standard Award
80 THOROUGHBRED OWNER BREEDER INC PACEMAKER
Jun_166_ROA Forum.indd 80
18/05/2018 16:14