25 minute read
Technical

from VTE March 2021
by Possprint

Madeleine Gibson, John Lee, Vindhya Venkatraman, Morgan Price, Jeffrey Lewis, Olivia Montgomery
and Bilge Mutlu, University of Wisconsin Joshua Domeyer and James Foley, Toyota Technical Center USA, Inc. Article courtesy SAE International
INTRODUCTION
Sophisticated technology is already active in vehicle control. Driver assistance systems support lane keeping, parking, speed maintenance, blind spot monitoring, and they also enhance night vision and detect driver impairment. In general, the potential safety benefits of these safety systems and automated vehicles are promising; however, realizing this promise depends on carefully coordinating driver and vehicle behavior. As vehicles become more capable, this coordination can break down if the drivers’ role is not clear.
Types and Levels of Automation
The types and levels taxonomy of automation [1,2] describes how different sets of activities can be allocated to the automation and to what degree. For each stage of information processing from perception to control, levels of automation can range from none to complete. Taxonomies that guide design of vehicle automation [3,4] share some similarities with the types and levels taxonomy: at one extreme the driver does everything and at the other the automation takes full control. The National Highway Traffic Safety Administration (NHTSA) and the Society of Automotive Engineers (SAE) define Level 1 vehicle automation as those that perform one primary vehicle control function - either steering or speed maintenance, while the driver performs the others, monitors the roadway, and remains fully responsible for safe vehicle control. Such automation is available in many vehicles today, for example, where the driver steers manually and engages cruise control. In NHTSA and SAE Level 2 automation, the automation performs at least two primary controls, for example both steering and speed maintenance. The driver is responsible for monitoring the roadway and should be ready to take-over control of the vehicle at any time [3]. Level 3 automation, from both NHTSA and SAE definitions, assigns higher capability to the automation, where the vehicle automation monitors the roadway and performs the primary control tasks; however, the driver may be expected to occasionally take control of the vehicle when the roadway demands exceed the capacity of the automation. The crucial concern for Levels 2 and 3 automation is the potential driver confusion
ABSTRACT
The rapid increase in the sophistication of vehicle automation demands development of evaluation protocols tuned to understanding driver-automation interaction. Driving simulators provide a safe and costefficient tool for studying driver-automation interaction, and this paper outlines general considerations for simulator-based evaluation protocols. Several challenges confront automation evaluation, including the limited utility of standard measures of driver performance (e.g., standard deviation of lane position), and the need to quantify underlying mental processes associated with situation awareness and trust. Implicitly or explicitly vehicle automation encourages drivers to disengage from driving and engage in other activities. Thus secondary tasks play an important role in both creating representative situations for automation use and misuse, as well as providing embedded measures of driver engagement. Latent hazards-hazards that exist in the road environment and merit driver attention, but do not materialize to require a driver response-have been used with great success for understanding the vulnerability of novice drivers. Latent hazards might provide a similarly useful index of driver attention to the road during periods where the automation is vulnerable to failure. With highly automated vehicles, latent hazards include potential roadway threats that might not be sensed by the automation and would require driver attention. This paper describes driving simulator scenarios used to operationalize automation-relevant latent hazards, secondary tasks tuned to index driver disengagement from the driving task, and measures that reflect safety margins rather than driving performance, such as drivers’ trust, situation awareness, and expected time to transition to manual control.
CITATION: Gibson, M., Lee, J., Venkatraman, V., Price, M. et al., “Situation Awareness, Scenarios, and Secondary Tasks: Measuring Driver Performance and Safety Margins in Highly Automated Vehicles,” SAE Int. J. Passeng. Cars – Electron. Electr. Syst. 9(1):2016, doi:10.4271/2016-01-0145.
regarding whether the driver or the automation is primarily responsible for driving. NHTSA Level 4 and SAE Level 4 and Level 5 represent automation that can handle all driving situations and requires very limited control input from the driver. Both Level 2 and Level 3 automation require some amount of driver attention to the roadway, either continuously, at critical moments, or during transitions between levels of automation. Attention to the road for monitoring, compared to attention for control, leads to longer response times and less effective responses [5, 6, 7]. Perception for control involves visual, cognitive, and proprioceptive engagement that is coupled to drivers control inputs and the expected outcomes. Activating vehicle automation can sever the perception-action loop and transform the driver from a controller to a monitor. As a monitor, a driver is on or out of the control loop rather than in the control loop [8,9]. Being on the control loop implies the driver is not perceiving the vehicle and roadway state to control the vehicle, but is actively monitoring the vehicle and roadway state to ensure the automation is controlling effectively. With automation that assumes control of steering and speed, drivers might easily disengage from monitoring and slip from on the loop to out of the loop [10]. Drivers might even think of driving as a distraction from other activities [11], and vehicle automation might be seen as a means of disengaging from driving, even when doing so violates the capabilities of the automation and compromises safety. Therefore, a major consequence of increasing automation might be the drivers’ willingness to switch attention to non-driving tasks. The evolving role of drivers in the context of automated driving and the additional activities drivers engage in present new challenges for evaluating how drivers work with the automation. Specifically, there are no standard scenarios and measures to evaluate joint control of the vehicle. This paper outlines a driving simulator evaluation protocol that captures driver engagement and disengagement in the driving task, and measures the safety margins achieved by drivers and automation.
Failure Modes of Driver-Automation Interaction
Central to assessing driver interaction with highly automated vehicles is the need to anticipate and test for likely failure modes. Risk analysis typically identifies failure modes associated with the mechanical, electronic, and software elements of systems and works to assure those risks remain below an acceptable level. Such risk estimates assume that drivers provide an additional safety margin, compensating for failures of the technology and other sources of unanticipated variability. This assumption is not always justified. Just as technology has failure modes, so do drivers and these failure modes should be assessed as part of a simulator-based evaluation. Although highly automated vehicles lack operational exposure that might reveal prototypical driver-automation failure modes, experience in other domains suggests failure modes that might occur with vehicle automation. A very likely failure mode concerns drivers confusing Level 2 and Level 3 automation, where a critical distinction between these levels involves whether the driver has primary responsibility for monitoring the vehicle. Responsibility diffusion regarding whether the driver or the automation is primarily responsible for vehicle monitoring and control is likely a prominent failure mode. People are poorly suited to the role of monitoring automation and are prone to over trusting and neglecting reliable automation[12,13]. Mode confusion associated with whether automatic control is engaged and if so what mode of control has been engaged is a prominent failure mode with automation in other domains and will likely affect vehicles equipped with combinations of Level 1, 2, and 3 automation [12,14, 15, 16, 17]. Operating envelope awareness, similar to the more degraded situation awareness that can accompany automation introduction, concerns awareness of the intended operating envelope and proximity to safety boundaries of this operating envelope. This failure mode will affect vehicle automation that is not intended to be used on all road types and in all road conditions [18, 19, 20]. Ineffective transfer of control represents a general failure mode that might occur during planned, unplanned, and unwarranted transfers of control from the automation to the person [17,21,22]. Unwarranted transfers of control are those situations where the automation sees no need for driver intervention, but the driver initiates a steering or braking maneuver that might conflict with the automation. These automation failure modes define the requirements for assessing vehicle automation. No single assessment protocol will likely address all the possible driver-automation failure modes. Several previous automated driving studies have focused primarily on the failure mode of ineffective transfer of control. The objective of these studies was to determine how quickly drivers recognize and respond to safety critical events. An alert or warning was used to prompt drivers to regain control of the vehicle when the automation fails. The method for how and when drivers were informed of needed actions was implemented differently across studies. In some cases the warning time was varied across conditions [23,24]. Another study investigated driver response to one and two step processes to indicate a needed take-over [25]. This study also manipulated how drivers were alerted to the automation failure. The primary measure for these studies was the reaction time to begin the take-over process. Other driving performance metrics included minimum headway to lead vehicle, standard deviation of steering wheel position, and standard deviation of road offset (distance from the centerline of the road) for evaluating performance once the driver gained control. Although many studies have focused on how and when control is traded, other automated vehicle studies have considered mode confusion failures and responsibility failure modes. These studies have examined
driver behavior across different levels of automation. For example, manipulating the levels of automation (manual/fully automated) and traffic density (high/ low) and drivers’ willingness to overtake slow moving vehicles, management of car following, and secondary task engagement [26]. Similarly, drivers’ response to automation was compared to an initial manual baseline condition [27]. When drivers experienced increasing levels of automation (i.e., lateral or longitudinal control followed by full automation) they were more willing to focus attention on secondary tasks as automation capability increased. The following sections outline a protocol for addressing failure modes of responsibility diffusion, mode confusion, and operating envelope awareness. Another protocol is needed to address ineffective transfer of control. We describe latent hazards as an important element of driving simulator scenarios, secondary tasks as a central component of driving highly automated vehicles, and measures of safety margin, rather than driver performance, as a critical indicators of resilience in the face of driverautomation failure modes.
DRIVING SIMULATOR PROTOCOL
Driving simulators are usually composed of the following elements: cabs, computers and electronics, vehicle dynamics, scenario, and task environment [28]. Driving simulators have increasingly become a widely used and accepted tool for transportation human factors research due to the several advantages. One major advantage is the safe environment driving simulators provide to understand basic human limitations and driver behavior in safety critical events. For example, in distracted driving studies, experimenters can evaluate invehicle systems through driver engagement in secondary tasks in situations that would be dangerous on the road. Similarly, design of vehicle automation and in-vehicle technologies can be evaluated without the risk inherent in on-road and test track evaluations. Another advantage of driving simulators is the controlled environment. Each participant is exposed to identical driving scenarios, eliminating confounding variables such as weather or traffic found in naturalistic driving environments. Roadway conditions and other vehicle behaviors can be specified for the duration of the experiment. Lastly, driving simulators allow for drivers to experience many test conditions in a short time [29]. During a single study session, drivers can experience many road situations that might take hours or months to occur in naturalistic driving. Although choosing the correct methods for conducting research is important, it is equally, important is choosing driving performance metrics that are sensitive to automation failure modes. Measures used to assess driver distraction with manual driving have included speed, vehicle following (headway), lane keeping, steering wheel metrics, event detection, response times, and subjective ratings. However, these measures do not consider joint performance of the driver and automation, such as when the driver is no longer in control of the vehicle’s primary functions. With automated driving, the driver’s role changes from being directly engaged in control to that of a monitor. Drivers with automation need to be considered part of a joint cognitive system, with the unit of analysis moving from that of the driver to the driver-vehicle combination. Therefore, measures of driver performance should not focus simply on the driver, but on the joint performance of the automation and the driver. Furthermore, because vehicle automation can achieve very high levels of driving performance (e.g., maintain a fixed speed precisely) safety margins are more relevant. A major challenge is to measure safety margins that are maintained by the driver across different levels of automation and in response to a range of roadway situations. More specifically, this involves measuring driver awareness of the automation capability and driver adaptive capacity relative to automation limits. Situation awareness and trust in automation are important indicators of drivers’ adaptive capacity. Situation awareness is defined as “the perception of the elements in the environment within a volume of time and space, the comprehension of their meaning, and the projection of their status in the future” [30]. The first component of situation awareness (SA) has been measured as attention allocation [31], and can be estimated by drivers’ glance behavior to road situations that might challenge the automation. Trust is an attitude that the automation will achieve the drivers’ goals [32], and could be indicated by the degree to which drivers engage in nondriving tasks, neglect the roadway, and keep hands and feet away from the controls.
Latent Hazards to Assess Situation Awareness
Latent hazards offer a promising measure of situation awareness of automation. Latent hazards are possible roadway threats that do not necessarily develop into hazards that require immediate action [33]. Latent hazards have been used for understanding the limits of novice drivers. Novice drivers’ attention to potential threats differs from that of experienced drivers [34,35]. Attention to latent hazards is often measured using glance metrics. Drivers glances can be used as an indicator of what the driver is attention and what information the driver is processing. Whether drivers gaze towards latent hazards can indicate whether they will anticipate the potential threat and are ready to act if needed [36]. Latent hazards might provide a similarly useful measure of driver attention to the road situations where automation is less capable and when the driver needs to resume control. A critical consideration in using latent hazards to evaluate situation awareness of vehicle automation concerns drivers being part of a joint cognitive system consisting of the driver and the automation. Previous use of latent hazards has focused on challenges that drivers must accommodate to maintain safety. When automation acts with drivers to control the vehicle, latent hazards need to be defined in terms of situations that challenge the automation and might require the driver to intervene. We have designed scenarios to reflect

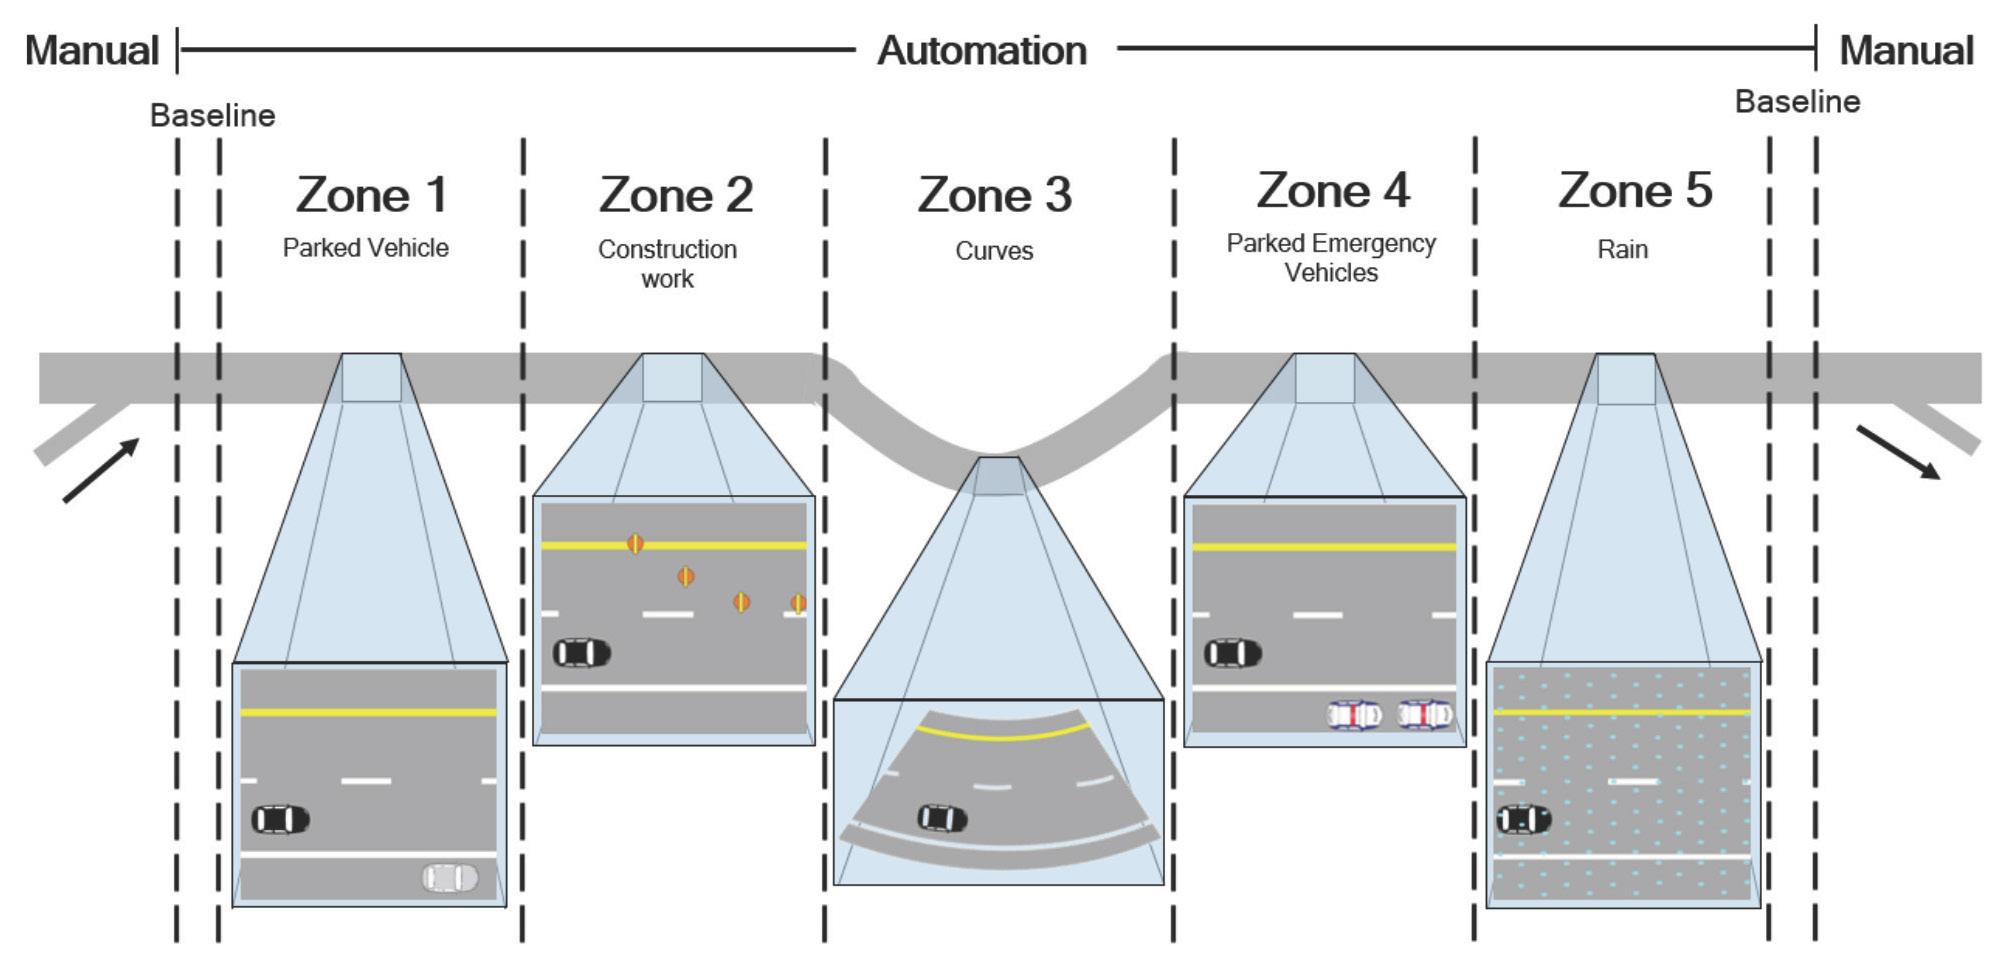
situations that challenge automation. These scenarios were implemented as latent hazards. Such latent hazards involve potential safety conflict situations that do not develop into active threats. However, drivers need to pay attention to the possibility of such hazards. Ideally, drivers are expected to recognize when latent hazards are present and be prepared to intervene to ensure safe operation of the vehicle. The hazards in our scenario do not require any control actions from the drivers. However, drivers can intervene at any point. Figure 1 shows a drive composed of several scenarios. At the start of the drive, drivers manually operate the vehicle to merge onto the highway. When instructed, the drivers engage the automation, followed by one minute of baseline driving with the automation. A one-minute baseline period also occurs at the end of the scenario before switching back to manual control and exiting the highway. The rest of the drive includes five different zones. The zones are equal in distance and each includes one latent hazard. Latent hazards include: stopped vehicle on the side of the road, construction work in the adjacent lane, curves, emergency vehicles on the side of the road, and rain. The duration of the latent hazards is small relative to the period where the vehicle can easily accommodate roadway demands. For example, the construction work is 30 seconds in a zone of several minutes. Measures for assessing drivers’ response to the latent hazards focus on glance behavior: total glance duration to latent hazard, frequency of glance to hazard, and time of first glance to hazard [33,36]. Beyond these measures, trust in automation might be reflected in behaviors that include moving hands to steering wheel, control inputs to the steering wheel, and foot movement towards the brake. The specific latent hazards considered in an evaluation depend on the design features of the automation. Latent hazards should represent situations at the edges of the operating envelope where relying on the automation is not appropriate or situations where drivers are expected to intervene in the event of an automation failure.
Secondary Task Engagement
A major motivation for developing vehicle automation and a major motivation for drivers engaging vehicle automation is the freedom such automation affords in performing secondary tasks. Such secondary tasks include email, social network interactions, and audio and video entertainment. Given the current engagement in secondary tasks while driving, automation evaluation should consider drivers interacting with a relatively engaging secondary task. In addition, secondary task engagement reflects drivers’ trust in the automation and their willingness to neglect the monitoring of the road and automation. Attention to latent hazards measure the engagement in the driving task, secondary task usage measures disengagement from the driving task. When selecting a secondary task to use in an automated driving study, it is important to choose one representative of the experience drivers will enjoy when using automated driving, such as a self-paced interaction with an information system. Many instances of self-paced tasks have been used in previous automated driving studies. These tasks include interaction with the in-vehicle entertainment system, eating, reading magazines, playing hand-held games, watching movies or TV shows, listening to the radio, performing grooming tasks, or completing word puzzles [24,26,27]. The secondary task protocol we developed consists of sorting emails into three categories, 1) Work, 2) Friends and Family, or 3) Trash, as described in Table 1. In the task, the driver sees a series of email subject lines displayed in a touchscreen application that models some basic functions of a common email client on a mobile device. Subject lines from the categories are chosen at random in a distribution of 1:1:4 respectively. To complete the e-mail task, drivers need to press the edit button in the top right corner. This button prompts checkboxes to appear next to the subject lines. Drivers can then select one or more e-mails to sort into the appropriate category. If the driver correctly sorts the email, the count on the top of the homepage is updated to reflect the total number of emails sorted for each category. If the email is incorrectly sorted, the count remains the same. On the
Work
Family & Friends
Trash Emails relate to work, mentioning deliverables and distinctly work related meetings or events. • Senior Developer Project updates • Expense Reports Deadline Tuesday • August Departmental Schedule Request
Emails relate to family affairs and social gatherings • Family Dinner on Sunday at 4 • Grandma Birthday Celebration • Get Together 3/21 Downtown?
Emails are spam, featureing promotions, deals and products. • Google TV, iPad, MacBook Air • Today Only: Save 20% on Holiday Gifts • Celebrate Summer with a Weekend Cruise
TABLE 1: Categories and examples of email messages
FIGURE 2: The main display shows the four emails available for sorting, a header with counts of the number of emails correctly sorted into each category, and the edit button.
Work: 0 Family and Friends: 0 Trash: 0
Edit
Capstone Project Powerpoint Request
Pictures of Scott’s New Baby Girl!
Knitting Club Get Together Tonight?
Strategic Desicion Making Presentation Today
sorting page, a cancel button returns that task to the homepage. Because each subtask is comprised of several discrete actions that require input from the driver, the secondary task can serve as a surrogate for eye glance and driver engagement in the secondary task. To further ensure driver attention is directed to the task, a pop-up message appears if the task is inactive for more than five seconds. The message directs drivers to touch the screen to resume. Data are collected for each button press, and so the task precisely indexes driver engagement. Overall, this task provides an activity representative of what drivers might do in a highly automated vehicle and one that precisely records drivers’ task engagement.
Measures of Driver Performance and Safety Margins
Driving simulator studies often measure driver performance in responding to events or maintaining vehicle control. These measures become less relevant in understanding driver interaction with highly automated vehicles. With measures of driving performance, the underlying assumption is that better driving performance corresponds to improved safety, which may not be the case with highly automated vehicles. Automation might maintain perfect control performance before it fails catastrophically. Because continuous measures of vehicle control, such as standard deviation of lane position, will likely fail to indicate the safety achieved by the joint cognitive system of the driver and automation, alternatives are needed. With highly automated systems the distinction between performance and resilience is critical. Resilience represents the actions, time, and resources that enable a system to accommodate unexpected demands [37]. Automation often performs well, but is brittle, failing in the face of unexpected demands. Humans enhance the resilience of the system through their ability to adapt to the unexpected. A crucial measure is the degree of resilience the automation affords. This resilience can be measured in terms of safety margins. Safety margins reflect the capacity of the automation to respond to road situations and the response time of drivers to compensate for automation limitations. This response time can be estimated as a function of drivers’ trust in the automation and situation awareness. Quantifying such safety margins represents an important measurement challenge in assessing vehicle automation. This paper focused on simulator-based methods for evaluating vehicle automation. Equally important are analytic methods to evaluate automation and assess potential failure modes. Several promising techniques have emerged to support formal evaluation of human-automation interaction [38, 39, 40]. These complement simulator-based methods because the can uncover failure modes that might occur too rarely to be detected in a simulator evaluation and yet these failure modes might substantially undermine vehicle safety.
CONCLUSION
Highly automated vehicles will dramatically change the role of the driver. To ensure such changes enhance rather than degrade driving safety, an evaluation of design assumptions and driver-automation failure modes is needed. Driving simulators offer a promising approach to addressing these failure modes, but only if the scenarios, secondary tasks, and measures are tuned to the particular demands of vehicle automation assessment. Drivers and automation should be considered as part of a joint cognitive system that is vulnerable to new failure modes, and measures of safety margin rather than driving performance are most appropriate to ensuring these failure modes do not compromise driving safety.
REFERENCES
1. Parasuraman, R., Sheridan, T.B., and Wickens,
C.D., “A model for types and levels of human interaction with automation,” IEEE Trans. Syst.
Man Cybern. -Part A Syst. Humans 30(3):286-297, 2000. 2. Sheridan, T.B. and Verplank, W., “Human and computer control of undersea teleoperations,” 1978. 3. NHTSA, “Preliminary statement of policy concerning automated vehicles,” 2013. 4. SAE International Surface Vehicle Information
Report, “Taxonomy and Definitions for Terms
Related to On-Road Motor Vehicle Automated
Driving Systems (J3016),” SAE Standard J3016,
Rev. Jan. 2014. 5. Eprath, A.R. and Young, L.R., “Monitoring vs. man-in-theloop detection of aircraft control failures,” in: Rasmussen, J. and Rouse, W. B., eds., Human Detection and Diagnosis of System
Failures, Plenum Press, New York: 143-154, 1981. 6. Gibson, J.J., “Observations on active touch,”
Psychol. Rev. 69:477-491, 1962. 7. Walker, G.H., Stanton, N., and Young, M.S.,
“The ironies of vehicle feedback in car design,”
Ergonomics 49(2):161-179, 2006. 8. Bainbridge, L., “Ironies of automation,”
Automatica 19(6):775-779, 1983, doi:10.1016/0005-1098(83)90046-8. 9. Wickens, C.D. and Kessel, C., “The Effects of
Participatory Mode and Task Workload on the
Detection of Dynamic System Failures,” IEEE
Trans. Syst. Man. Cybern. 9(1):24-34, 1979, doi:10.1109/TSMC.1979.4310070. 10. Merat, N. and Lee, J.D., “Preface to the Special
Section on Human Factors and Automation in
Vehicles: Designing Highly Automated Vehicles
With the Driver in Mind,” Hum. Factors J. Hum.
Factors Ergon. Soc. 54(5):681-686, 2012. 11. Hancock, P.A., “Driven to Distraction and Back
Again,” in: Regan, M. A., Lee, J. D., and Victor,
T. W., eds., DRiver Distraction and Inattention :
Advances in Research and Countermeasures, 1st ed., Ashgate Publication Limited, Surrey, England: 440, 2013. 12. Bainbridge, L., “Ironies of automation,”
Automatica 19(6):775-779, 1983, doi:10.1016/0005-1098(83)90046-8. 13. Strand, N., Nilsson, J., Karlsson, I.C.M., and
Nilsson, L., “Semi-automated versus highly automated driving in critical situations caused by automation failures,” Transp. Res. Part F Traffic
Psychol. Behav. 27:218-228, 2014, doi:10.1016/j. trf.2014.04.005.
14. Sarter, N.B., Woods, D.D., and Billings, C.E.,
“Automation surprises,” in: Salvendy, G., ed.,
Handbook of Human Factors and Ergonomics, 2nd ed., Wiley, New York: 1926-1943, 1997. 15. Sarter, N.B. and Woods, D.D., “How in the world did we ever get into that mode? Mode error and awareness in supervisory control,” Hum. Factors 37(1):5-19, 1995. 16. Degani, A., Shafto, M., and Kirlik, A., “Modes in automated cockpits: Problems, data analysis, and a modeling framework,” Proceedings of the 36th Israel Annual Conference on Aerospace
Science, Haifa, Israel, 1995. 17. Merat, N. and Lee, J.D., “Preface to the Special
Section on Human Factors and Automation in
Vehicles: Designing highly automated vehicles with the driver in mind,” Hum. Factors J. Hum.
Factors Ergon. Soc. 54(5):681-686, 2012, doi:10.1177/0018720812461374. 18. Pritchett, A.R., “Aviation Automation:
General Perspectives and Specific Guidance for the Design of Modes and Alerts,” Rev.
Hum. Factors Ergon. 5(1):82-113, 2009, doi:10.1518/155723409X448026. 19. Young, M.S., Stanton, N.A., and Harris, D., “Driving automation: Learning from aviation about design philosophies,” Internaltional J. Veh. Des. 45(3):323-338, 2007. 20. Rasmussen, J., “Risk Management in a Dynamic
Society: a modeling problem,” Saf. Sci. 27:183213, 1997, doi:10.1016/S0925-7535(97)00052-0. 21. Merat, N., Jamson, A.H., Lai, F.C.H., Daly, M., and Carsten, O.M.J., “Transition to manual:
Driver behaviour when resuming control from a highly automated vehicle,” Transp. Res. Part F
Traffic Psychol. Behav. 26(PART A):1-9, 2014, doi:10.1016/j.trf.2014.05.006. 22. Parasuraman, R. and Sheridan, T.B., “A model for types and levels of human interaction with automation,” Syst. Man … 30(3):286-297, 2000, doi:10.1109/3468.844354. 23. Gold, C., Dambock, D., Lorenz, L., and Bengler,
K., “‘Take over!’ How long does it take to get the driver back into the loop?,” Proc. Hum. Factors
Ergon. Soc. Annu. Meet. 57(1):1938-1942, 2013, doi:10.1177/1541931213571433. 24. Mok, B., Johns, M., Lee, K.J., Miller, D., Sirkin, D.,
Ive, P., and Ju, W., “Emergency , Automation Off?:
Unstructured Transition Timing for Distracted
Drivers of Automated Vehicles,” Proc. 2015 IEEE 18th Int. Conf. Intell. Transp. Syst., 2015. 25. Miller, D., Sun, A., Johns, M., Ive, H., Sirkin,
D., Aich, S., and Ju, W., “Distraction becomes engagement in automated driving,” Proc. Hum.
Factors Ergon. Soc. Annu. Meet. 2-6, 2015. 26. Jamson, A.H., Merat, N., Carsten, O.M.J., and
Lai, F.C.H., “Behavioural changes in drivers experiencing highly-automated vehicle control in varying traffic conditions,” Transp. Res. Part C
Emerg. Technol. 30:116-125, 2013, doi:10.1016/j. trc.2013.02.008. 27. Carsten, O., Lai, F.C.H., Barnard, Y., Jamson, H., and Merat, N., “Control task substitution in semiautomated driving: Does it matter what aspects are automated?,” Hum. Factors 54(5):747-761, 2012. 28. Allen, R.W., Rosenthal, T., J., and Cook, M., “A short history of driving simulation,” Handbook of driving simulation for engineering, medicine, and psychology, 2-3, 2011. 29. Young, K.L., Regan, M.A., and Lee, J.D.,
“Measuring the effects of driver distraction: direct driving performance methods and measures,” Driver Dirstraction: Theory, Effects, and Mitigation, 86-102, 2009. 30. Endsley, M.R., “Toward a Theory of Situation
Awareness in Dynamic Systems,” Hum. Factors
J. Hum. Factors Ergon. Soc. 37(1):32-64, 1995, doi:10.1518/001872095779049543. 31. Gugerty, L., “Situation awareness in driving,”
Handbook of driving simulation for engineering, medicine, and psychology, 1-8, 2011. 32. Lee, J.D. and See, K.A., “Trust in computer technology and the implications for design and evaluation,” in: Miller, C., ed., Etiquette for Human-
Computer Work: Technical Report FS-02-02, American Association for Artificial Intelligence,
Menlo Park, CA: 20-25, 2002. 33. Vlakveld, W., Romoser, M.R.E., Mehranian, H.,
Diete, F., Pollatsek, A., and Fisher, D.L., “Do
Crashes and Near Crashes in Simulator-Based
Training Enhance Novice Drivers’ Visual Search for Latent Hazards?,” Transp. Res. Rec. J.
Transp. Res. Board 153-160, 2011, doi:10.1016/j. biotechadv.2011.08.021.Secreted. 34. Garay-Vega, L., Fisher, D.L., and Pollatsek,
A., “Hazard Anticipation of Novice and
Experienced Drivers: Empirical Evaluation on a Driving Simulator in Daytime and Nighttime
Conditions,” Transp. Res. Rec. 2009(1):1-7, 2007, doi:10.3141/2009-01. 35. Underwood, G., Crundall, D., and Chapman,
P., “Driving simulator validation with hazard perception,” Transp. Res. Part F Traffic Psychol.
Behav. 14(6):435-446, 2011, doi:10.1016/j. trf.2011.04.008. 36. Taylor, T., Pradhan, A.K., Divekar, G., Romoser, M.,
Muttart, J.W., Gomez, R., Pollatsek, A., and Fisher,
D.L., “The view from the road: The contribution of on-road glance-monitoring technologies to understanding driver behavior.,” Accid. Anal.
Prev. 58(null):175-86, 2013, doi:10.1016/j. aap.2013.02.008. 37. Woods, D.D. and Branlat, M., “Hollnagel’s test:
Being ‘in control’ of highly interdependent multilayered networked systems,” Cogn. Technol.
Work 12(2):95-101, 2010, doi:10.1007/s10111010-0144-5. 38. Degani, A. and Heymann, M., “Formal verification of human-automation interaction.,” Hum. Factors 44(1):28-43, 2002. 39. Bolton, M.L., Bass, E.J., Member, S., and
Siminiceanu, R.I., “Using formal verification to evaluate Human-automation interaction: A review,” 43(3):488-503, 2013. 40. Leveson, N.G., “A systems-theoretic approach to safety in software-intensive systems,” IEEE
Trans. Dependable Secur. Comput. 1(1):66-86, 2004, doi:10.1109/TDSC.2004.1.