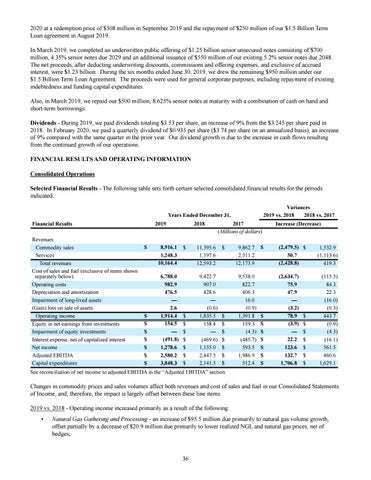
2020 at a redemption price of $308 million in September 2019 and the repayment of $250 million of our $1.5 Billion Term Loan agreement in August 2019. In March 2019, we completed an underwritten public offering of $1.25 billion senior unsecured notes consisting of $700 million, 4.35% senior notes due 2029 and an additional issuance of $550 million of our existing 5.2% senior notes due 2048. The net proceeds, after deducting underwriting discounts, commissions and offering expenses, and exclusive of accrued interest, were $1.23 billion. During the six months ended June 30, 2019, we drew the remaining $950 million under our $1.5 Billion Term Loan Agreement. The proceeds were used for general corporate purposes, including repayment of existing indebtedness and funding capital expenditures. Also, in March 2019, we repaid our $500 million, 8.625% senior notes at maturity with a combination of cash on hand and short-term borrowings. Dividends - During 2019, we paid dividends totaling $3.53 per share, an increase of 9% from the $3.245 per share paid in 2018. In February 2020, we paid a quarterly dividend of $0.935 per share ($3.74 per share on an annualized basis), an increase of 9% compared with the same quarter in the prior year. Our dividend growth is due to the increase in cash flows resulting from the continued growth of our operations. FINANCIAL RESULTS AND OPERATING INFORMATION Consolidated Operations Selected Financial Results - The following table sets forth certain selected consolidated financial results for the periods indicated:
Financial Results Revenues Commodity sales Services Total revenues Cost of sales and fuel (exclusive of items shown separately below) Operating costs Depreciation and amortization Impairment of long-lived assets (Gain) loss on sale of assets Operating income Equity in net earnings from investments Impairment of equity investments Interest expense, net of capitalized interest Net income Adjusted EBITDA Capital expenditures
Years Ended December 31,
Variances 2019 vs. 2018 2018 vs. 2017
2018
Increase (Decrease)
2019
$
$ $ $ $ $ $ $
8,916.1 1,248.3 10,164.4 6,788.0 982.9 476.5 — 2.6 1,914.4 154.5 — (491.8) 1,278.6 2,580.2 3,848.3
$
$ $ $ $ $ $ $
11,395.6 1,197.6 12,593.2 9,422.7 907.0 428.6 — (0.6) 1,835.5 158.4 — (469.6) 1,155.0 2,447.5 2,141.5
2017 (Millions of dollars) $
$ $ $ $ $ $ $
9,862.7 2,311.2 12,173.9 9,538.0 822.7 406.3 16.0 (0.9) 1,391.8 159.3 (4.3) (485.7) 593.5 1,986.9 512.4
$
$ $ $ $ $ $ $
(2,479.5) $ 50.7 (2,428.8) (2,634.7) 75.9 47.9 — (3.2) 78.9 (3.9) — 22.2 123.6 132.7 1,706.8
$ $ $ $ $ $ $
1,532.9 (1,113.6) 419.3 (115.3) 84.3 22.3 (16.0) (0.3) 443.7 (0.9) (4.3) (16.1) 561.5 460.6 1,629.1
See reconciliation of net income to adjusted EBITDA in the “Adjusted EBITDA” section.
Changes in commodity prices and sales volumes affect both revenues and cost of sales and fuel in our Consolidated Statements of Income, and, therefore, the impact is largely offset between these line items. 2019 vs. 2018 - Operating income increased primarily as a result of the following: •
Natural Gas Gathering and Processing - an increase of $95.5 million due primarily to natural gas volume growth, offset partially by a decrease of $20.9 million due primarily to lower realized NGL and natural gas prices, net of hedges;
36