
Research Article
ISSN: 2640-1037
Volume 4
Functional Disparity of Carcinoma Associated Fibroblasts in Different Stages Influences Immune Response in Cancer
Langroudi L1, Hasan ZM*2, Soleimani M3 and Hashemi SM4
1Department of Immunology, School of Medicine, Kerman University of Medical Sciences, Iran
2Department of Immunology, Faculty of Medical Sciences, Tarbiat Modares University, Iran
3Department of Hematology, Faculty of Medical Sciences Tarbiat Modares University, Iran
4Department of Immunology, School of Medicine, Shahid Beheshti University of Medical Sciences, Iran
*Corresponding author:
Zuhair M Hasan, Department of Immunology, Faculty of Medical Sciences, Tarbiat Modares University, Jalal AleAhmad Highway, Nasr Bridge, Tehran, Iran, Email: Hasan_zm@modares.ac.ir
Keywords:
Carcinoma associated fibroblasts; Breast cancer; IDO; iNOS; COX-2
1. Abstract
Received: 02 Feb 2021
Accepted: 03 Mar 2021
Published: 07 Mar 2021
Copyright:
©2021 Hasan ZM, et al. This is an open access article distributed under the terms of the Creative Commons Attribution License, which permits unrestricted use, distribution, and build upon your work non-commercially.
Citation:
Hasan ZM, Functional Disparity of Carcinoma Associated Fibroblasts in Different Stages Influences Immune Response in Cancer. Clin Onco. 2021; 4(1): 1-10.
CAFs in various stages.
1.1. Objectives: Carcinoma associated fibroblasts (CAFs) are known responsible for immune evasion and growth of cancer and the crosstalk between CAFs and the immune system is still unidentified.
1.2. Methods: in this study, two stages of breast cancer were described in a murine model of MBL-6 cell line. CAFs were isolated and characterized from MBL-6 tumors in stages 2 and 4. The immunomodulatory properties and the phenotype of isolated stage 2 and 4 CAFs were characterized and compared. Cytokine production, proliferation and inflammatory enzyme production were analyzed using ELISA, MTT assay and Real-time PCR.
1.3. Results: Here we show CAFs from two stages of a murine breast cancer model show different immunomodulatory properties. Flow cytometry of the surface marker panel showed significantly higher levels of HLA-DR in CAF-IV. Higher levels of TGF-β and IL10 was observed in splenocytes co-cultured with CAF-II and CAF-IV respectively. Gene expression revealed higher expression of IDO in CAF-II and iNOS in CAF-IV.
1.4. Conclusion: Functional differences shown by their surface markers, cytokine and inflammatory enzyme production suggests different microenvironments. The discrepancy observed in cancer therapies may be attributed to the influence of CAFs. Further studies are required to fully elucidate the therapeutic potentials of
2. Introduction
The cancer microenvironment consists of many cell types including endothelial cell, fibroblasts and cells of the immune system. The supporting microenvironment of cancer has been known responsible for cancer development, progression, metastasis and drug resistance [1, 2]. The cancer promoting properties of Carcinoma Associated Fibroblasts (CAFs) have been the target of many studies which have shown the morphological, molecular and functional alterations compared to their normal counterparts [3]. These changes include cell signaling and intra- cellular crosstalk [4], extracellular matrix (ECM) remodeling [5], immune evasion and sustained inflammation [6]. CAFs are the initial barrier to infiltrating immune cells [7]. CAFs secretory and cell surface factors including TGF-β1 [8], PGE2 [9], IL-8 [10], IL-6 [11] and TNF-α [12] influence the immune response leading to immune suppression and cancer-related inflammation. it has been shown that normal fibroblasts can inhibit cancer cell growth [13] and the prevailing view is that cancer has a developmental progression and the microenvironment evolves with cancer cell demands [14].
In agreement with this premise, the changes in fibroblast function from anti-tumorigenic to pro-tumorigenic may be the basis for cancer development and progression. thus, there should be functional differences between CAFs in different stages. In this study we show that with increasing stage, CAFs significantly upregulate
the production of regulatory cytokine IL-10 and iNOS expression compared to TGF-β and IDO. Whereas CAFs induce IL-17 and PGE2 production in both stages. These findings place CAFs as key regulators of cancer microenvironment and suggest new intervention strategies to restore immune response in cancer and related inflammation.
3. Material and Methods
3.1.
Establishment of Stage 2 and 4 Model
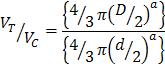
In studies involving mouse models, terms such as “early” and “late” stages is used to denote various stages of cancer. However, this terminology is not applicable when translating animal models into human studies. Therefore, here, we employed the model of human tumor growth kinetics [61, 62] and the metabolic rate differences [63] to establish a stage II and stage IV model of tumor growth in Balb/C mice. According to TNM staging of breast cancer [64], a combination of tumor size, lymph node involvement and metastasis are used to assign a breast cancer stage. Initially, tumor size is the first parameter. In stage II a tumor size of 2-5 cm with/out lymph node involvement and in stage IV, any tumor size with distant metastasis are the chosen criteria. To translate these sizes to mouse tumor growth, tumor size was transformed to number of cancer cells using equation 1.
Equation 1: transforming tumor size to the number of cells in a
washed in PBS and incubated in an enzyme cocktail consisting of 0.5% collagenase IV, 0.02% hyaluronidase, 0.25% trypsin and 0.002% DNaseI in DMEM/F12. After 4 hours in 37°C, cell suspensions were fractioned using ficol separation technique. The interface layer of ficol consisted of fibroblast and the pellet consisted of mostly cancer cells. Fibroblasts were washed in PBS and plated in DMEM/F12 (GIBCO, USA) supplemented with 30% FBS, (GIBCO, USA) and 1% penicillin/streptomycin (Biosera, UK) in flasks coated with 0.1% gelatin (Sigma, Germany). Fibroblastic colonies were passaged in 10% FBS DMEM/F12. The passage 2 and 3 cells were characterized and used for future evaluations.
3.3. CAF Characterization and Immunostaining
The cell surface expression of CAF markers were analyzed using the following antibodies: PE conjugated anti-CD29, anti-CD105, anti-HLA-DR, anti-CD45, anti-CD90 and anti-FAP; FITC conjugated anti-CD104a (PDGFRa), anti-Sca-1 (eBioscience). Cells were divided into aliquots (5 × 10⁵ each), stained with FITC- or PE-conjugated antibodies. Results were analyzed by BD FACS flow cytometry and Flowjo software (version 7.6.1). Additionally, isolated CAFs were stained for expression of FAP-1 using rabbit anti-FAP-1 and FITC conjugated goat anti-rabbit IgG.
3.4. Colony Forming Unit – Fibroblast
Where D is the tumor diameter and d is the cancer cell diameter which was assumed as 10 µm. Therefore, a human tumor with a diameter of 2 cm, has a volume of 4186.67 mm3 and 8×10⁹ number of cells. Counting in the differences in mouse and human metabolic rate (7:1), a stage II cancer of mouse would have approximately 109 cancer cells and 200 mm3 volume. A stage IV cancer in mouse would have 2×10⁹ cells and 600 mm3 volume and distant metastasis.
The cell line of choice was MBL-6. isolated from a spontaneous breast cancer of Balb/C mouse MBL-6 tumors possess similar pathology to human invasive ductal carcinoma [15]. Ten 4-6 weeks old female Balb/C mice (Pasture Institute, Tehran, Iran) were subcutaneously inoculated with 5×10⁵ MBL-6 cells. When the tumors reached an approximate size of 200 mm3 (stage II) and 600 mm3 (stage IV) mice were sacrificed. Tissues including tumor, liver, spleen, lung and lymph nodes were separated aseptically and fixed in 10% formalin for metastasis analysis.
3.2. CAF Isolation
Tumor tissues were aseptically removed, washed in PBS and minced with scalpel into 1-3 mm sized fragments. Fragments were
The CFU-F assay was performed using a modification of a described protocol. Cells cultured were resuspended in the above medium in three concentrations of 100, 500 and 1000 viable cells in 10cm dish. The medium was changed 2 times per week. On the 14th day, cultures were fixed with 4% PFA and stained with crystal violet. Fibroblastic colonies with more than 50 cells and or possessing a diameter greater than 2mm were counted under an inverted microscope. Three CAFs were evaluated in triplicate.
3.5. Growth Curve
CAFs were cultured in DMEM at an initial density of 5000 per well in 24 well plates. At 24-hour intervals, MTT assay was performed and the optical density was corrected using a standard cell curve. The growth curve was evaluated for 13 consecutive days.
3.6. CAFs and the Immune System in Vitro
3.6.1.
Proliferation of Splenocytes:
The ability of CAF to affect immune cell proliferation was assessed using MTT proliferation assay. Triplicates of mitomycin-inactivated CAFs or MBL-6 and splenocytes were co-cultured in contact or with Conditioned Media (CM), in a 96-well plate (TPP) at four ratios of 1:10, 1:50, 1:100 and 1:250 in 200µL of RPMI supplemented with 10% FBS, penicillin/streptomycin (100 mg/mL) and amphotericin B (2.5 ng/ mL) at 37°C in a humid atmosphere containing 5% CO2. PHA was added to stimulate splenocytes. After 72 hours, splenocyte proliferation was assessed using MTT assay. As a positive control, splenocytes were activated by 5µg/ mL PHA (Baharafshan, Teahran, Iran) and the negative control was untreated splenocytes.
Proliferation of treated splenocytes was calculated and expressed as stimulation index.
3.6.2. Cytokine Production: Splenocytes were co-cultured in contact or with conditioned medium of Mitomycin-inactivated CAF and MBL-6 cell line in a 24-well plate (TPP) at 1:10 ratio in 1 mL of RPMI supplemented with 10% FBS, (100 units/mL) penicillin/(100 mg/mL) streptomycin at 37°C in a humid atmosphere containing 5% CO2. PHA was added and After 72 hours, the supernatant was collected and the level of IL-10, IL-17, TGF-β1, and Prostaglandin E2 was assessed by ELISA (DuoSet ELISA Development kit, R&D systems, Minneapolis, MN, USA). All procedures were followed according to the manufacturer’s protocol.
3.7. Nitric Oxide Production
NO levels (nmol/ml) were measured in culture supernatants by the Griess reaction. Briefly, nitrite was measured by adding equal volumes of Griess reagent (1% sulphanilamide and 0.1% naphthylenediamine in 5% phosphoric acid) to conditioned media samples. The optical density at 550 nm was measured by using a microplate reader. Varying concentration solutions of sodium nitrite prepared in the culture medium were used for standard curve calculations. Fresh medium was used as blank for background absorbance of NO production. All chemicals were obtained from Merck (Darmstadt, Germany).
3.8. Gene Expression Analysis Using qRT-PCR
Gene Expression was assessed using Real-Time PCR. After CAF isolation, total cellular RNA was extracted using Trizol (Gibco-BRL, Life Technologies, MD). Random hexamer-primed reverse transcription (Metabion) was performed on aliquots (1 µg) of total RNA as a template. The resulting cDNA was used for Real-Time PCR amplification. Primers for cycloxygenase 2 (COX-2), inducible Nitric Oxide Synthetase (iNOS), Indolamine Deoxygenase (IDO), Matrix Metalloproteinase 2 (MMP2) and 9 (MMP9) and beta-actin were synthesized based on the reported sequences as follows:
• COX-2 (145 bp) forward: AGACAGATCATAAGCGAGGAC, reverse: CCACCAATGACCTGATATTTC;
• INOS (142 bp): forward: TGTGCGAAGTGTCAGTGG, reverse: TCCTTTGAGCCCTTTGTG;
• IDO (168 bp): forward: GGATGCGTGACTTTGTGG, reverse: TGGAAGATGCTGCTCTGG;
• MMP2 (150 bp): forward: AGACAAGTTCTGGAGATACAATG, reverse: GCACCCTTGAAGAAGTAGC;
• MMP9 (136 bp): forward: GGCGTGTCTGGAGATTCG, reverse: TGGCAGAAATAGGCTTTGTC
Real-time PCR reaction mixtures (final volume of 30 ul) contained 1 µl cDNA, 30 pmol of each primer, 3 µl of 200 µM dNTP, and 1U Taq-DNA polymerase (MBI Fermentas Inc., Burlington, ON). Amplification conditions were as follows: 25 cycles of 94°C for 30
s; 55°C for 60 s; and 72°C for 1 min, followed by 72°C incubation for 10 min (Corbett cycler). The results of primer amplification were analyzed using Rotor-Gene 6000 and REST software.
4. Statistical Analysis
All data is presented as mean±SEM otherwise stated. Data was analyzed by SPSS v.19 software and GraphPad Prism v. 8. The relative expressions and heatmap demonstration were analyzed using REST software and R studio respectively. A P-value less than 0.05 was considered as statistical significance.
5. Results
5.1. Two Pathological Stages Were Successfully Established in Tumor Bearing Balb/C Mice
MBL-6 is a cell line isolated from a spontaneous invasive ductal carcinoma of mammary glands of Balb/C mouse. This tumor was preserved using SC transplantations [15]. This model has the advantage of long in situ growth prior to metastasis formation, permitting various evaluations. Subcutaneous growth of cell line was measured with a digital vernier caliper (Mitutoyo, Japan) and tumor volume was converted to cell number. When the number of estimated cells reached 1×10⁹ or 2×10⁹ cells, mice were grouped as stage II and IV respectively. after tumors became palpable, they were measured daily. As seen in Figure 1a, after ten days, they reached stage II. after 1 week they reached stage IV. At this time point metastasis was evaluated using H&E staining of various tissues. As shown in figure 1b in stage-II none of the resected tissues showed traces of metastasis where as in stage-IV all the tissues showed cancer cell growths.
5.2. Stage II CAFs Show Higher Proliferation Capacities
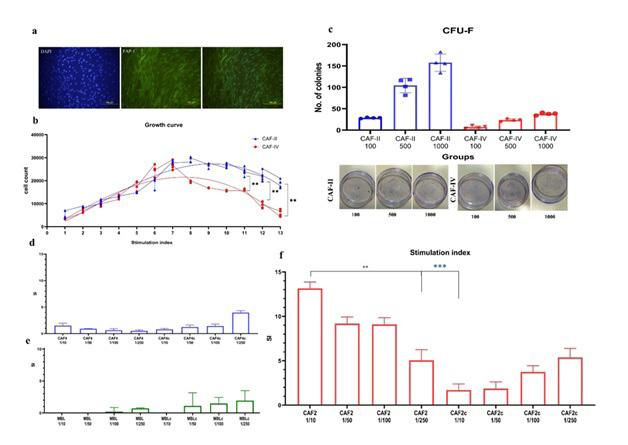
Isolated fibroblasts were evaluated for their surface marker expression (figure 1c). CD29, CD90, CD105, FAP-1, HLA-DR, CD45, CD11b and SCA-1 comparison showed that stage-II and -IV CAFs have similar marker expression. However, the expression of HLADR was higher in stage IV CAFs (P<0.05) (figure 1d). Additionally, immune staining of CAFS in culture showed FAP-1 expression in stage-II and -IV CAFs (figure 2a). these results confirm that the isolation technique was able to efficiently isolate carcinoma associated fibroblasts from two different stages.
Growth curve of isolated CAFs was evaluated for 13 consecutive days. Each day, proliferation of 5000 seeded cells were evaluated using MTT assay. The optical density was corrected using a MTT-cell standard curve. As shown in figure 2b CAFs growth curve was similar until day 8 from which stage IV CAFs showed lower proliferation capacity. Statistical analysis showed that from day 11 the growth of CAF-II was significantly higher compared to CAF-IV. Curve equation evaluations calculated the doubling time of CAF-II as 2.891 and CAF-IV as 1.607 days. The ability of CAFs to form fibroblastic colonies was evaluated using CFU-F assay. figure 2c depicts the number of CFU-F cells obtained at passage 3. CFU-F assay was performed in three concentrations;
1000, 500,100. Number of colonies was counted in three repeats for three separate isolated CAF. Statistical analysis showed significant difference between the numbers of colonies CAF-II was able
to launch (p-value< 0.001). the number of colonies were lower in CAFs derived from stage IV.
Figure 1. (a) In vivo tumor growth curve of MBL-6 in Balb/C mice showed 100% engraftment. After 10-12 days, tumors reached 109 cells. These mice were grouped as stage-II. After 4 weeks of inoculation they reached 2×10⁹ cells which were grouped as stage-IV. (b) Metastasis growth in the liver, spleen, lung and lymph node of stage II and IV of tumor bearing mice compared to healthy tissues. The H&E staining of tissue sections revealed that mice in stage II had minor metastasis to lymph node and liver (n=1 in 5) and mice in stage IV showed signs of metastasis in all the tissues evaluated (n=5). (c) Flow cytometry was used for comparison of CAFs’ surface markers. Expression of CD29, CD90, CD105, FAP-1, HLA-DR, CD45, CD11b and SCA-1 was evaluated and data revealed that expression of HLA-DR was higher in stage 4 CAFs (P-value <0.001).
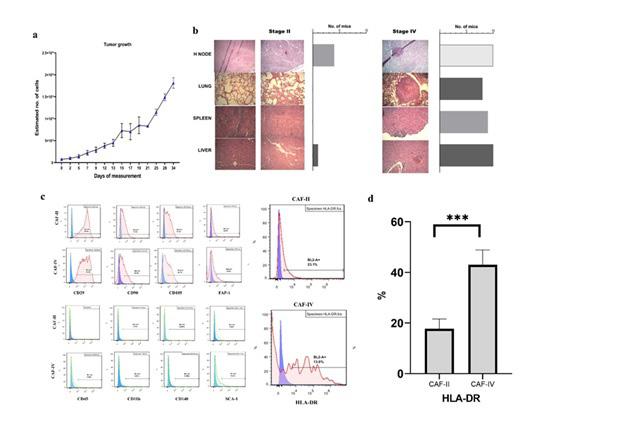
Figure 2: (a) immunocytochemistry of stage IV CAFs stained with rabbit anti-FAP-1 and secondary FITC conjugated goat anti-rabbit IgG. (b) growth curve comparison of stage II and stage IV CAFs demonstrated higher proliferation capacities of CAF-II cells. (c) CFU-F assay of isolated CAFs revealed significantly higher proliferation potential in CAF-II cells. Stimulation index of splenocytes in co-culture with (d)CAF-IV (e) MBL-6 and (f) CAF-II cells and their respective conditioned media (CAF2c, CAF4c and MBL-6c) was performed in four ratios. Coculture with stage-II CAFS (f) significantly augmented splenocyte proliferation in a cell contact dose dependent manner. The same pattern was observed with stage-IV CAFs however the increase in splenocyte proliferation was significantly higher in stage-II cultures (P value <.000). Coculture with MBL-6 or its CM suppressed splenocyte proliferation which was greater in the highest ratio (P value >.05 for in group comparisons and CAF-IV, p value < 0.00 with CAF-II).
5.3. Stage II and IV CAFs Utilize Different Mechanisms of Immune Suppression
MTT assay was used to measure the proliferation of splenocytes co-cultured with Triplicates of mitomycin-inactivated CAFs in cell contact or conditioned media at four ratios. Results showed that the presence of stage-II CAFs (figure 2f) induced the proliferation of splenocytes in a cell contact dose dependent manner. On the other hand, CAF-II secretome had inhibitory properties. The greatest SI was seen in co-culture of 1:10 ratio of CAFs-II (P value=.000) and the SI decreased with lowering ratio. What causes the inhibitory properties of CAF-II secretome? Inhibitory cytokines include IL10 and TGF-β. Evaluation of cytokines revealed that CAF-II produced= copious amounts of TGF-β but negligible levels of IL-10 (figure 3a). However, they were able to induce IL-10 in activated splenocytes. Therefore, the inhibition of splenocyte proliferation were due to TGF-β and possibly regulatory T cell differentiation indicated by IL-10 production. the same result was not observed in co-cultures with CAF-IV and MBL-6 which suppressed splenocyte proliferation through cellular contact and their secretome.
CAF-IV and MBL-6 did not produce IL-10 or TGF-β but were able to induce IL-10 in activated splenocytes which efficiently halts splenocyte proliferation.
Results indicated that IL10 production was limited to splenocytes and either activated with PHA or not stimulated, the production of IL10 by splenocytes alone was significantly lower than other
cocultures. CAFs and MBL-6 cell line did not produce IL10 even under PHA stimulation (figure 3a). Therefore, in cocultures it can be assumed that the IL10 is of splenocyte origin. Spontaneous production of TGF-β1 was seen in activated and not activated splenocytes, however not significantly different. Additionally, Production of TGF-β1 in other cocultures was not statistically significant compared to splenocytes. However, production of TGF-β1 was highest in stage 2 CAFs. In this case TGF-β1 was produced mainly by CAF-II cells. Therefore, its expression in splenocytes needs further investigation.
5.4. Inflammatory Status of CAFs are Similar in Both Stages but Different Suppression Mechanisms are Employed
IL-17 is an inflammatory cytokine with both pro- and anti-tumor functions. Spontaneous production of Splenocytes with/out PHA was not significant figure 3a and resembled that of media and CAFs. Therefore, it can be assumed that IL-17 is only produced from slpenocytes. in the presence of CAFs, splenocytes produced copious amounts of IL17 (figure 3a). Production of IL17 was induced only in the presence of PHA and in cellular contact with CAFs (P value < .000). Both stages of CAFs were able to induce IL17 (P value >.05). The importance of cellular contact for induction of IL17 indicates involvement of CAFs’ surface molecules and secretory factors are not able to induce IL17 alone. cell line or secretome of CAFs did not affect the production of IL17 comparable to spontaneous production of splenocytes.
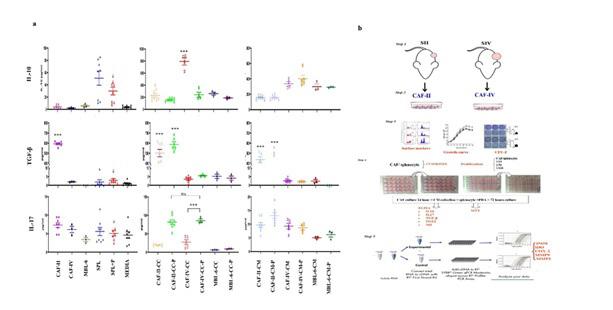
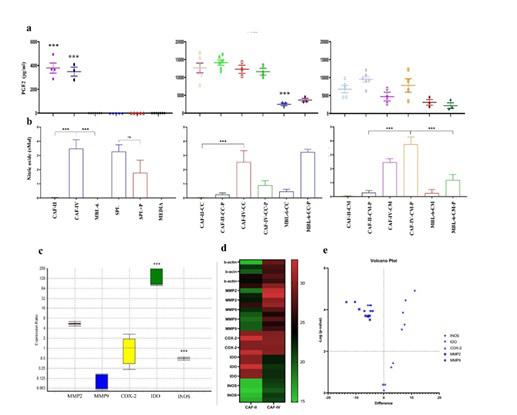
Figure 3: (a) cytokine pattern of CAFs, MBL-6 and their corresponding cocultures (CC) or with conditioned media (CM), with/out PHA (P) stimulation of splenocytes (SPL) in vitro were evaluated with ELISA. Similar patterns of IL-10, IL-17 and PGE2 production was observed however the expression of TGF-β1 was significantly higher in stage 2 CAFs (P<.000). (b) study design included (step 1) initial stage establishment and (step 2) CAF isolation. Afterwards (step 3) CAFs were characterized using surface marker expression, growth curve and CFU-F assay. in step 4 we evaluated the immunomodulatory properties using splenocyte proliferation and cytokine profiling of CAFs and in coculture with splenocytes. Step 5, Inflammatory enzymes and mediators were evaluated using real-time qPCR.
Gene expression and ELISA revealed that Both stage 2 and stage 4 CAFs express COX-2 and produce PGE2 and splenocytes, either activated or not, and the cell line do not produce any PGE2 (P>0.05). in co cultures of CAFs and splenocytes the production
of PGE2 was significantly higher compared to CM cultures, which indicates cellular interactions are involved (Figure 4a). The origin of this PGE2 is not clear however it can be an indication of increased inflammatory milieu in the tumor microenvironment.
Nonspecific production of NO was seen in splenocytes, with/ out PHA stimulation (figure 4). However, production of NO was augmented when CAF-IV or cell line or their CM was present. As shown in figure 4b, MBL-6 had no production of NO, but in cellular contact with splenocytes, increased amount of NO was observed. Highest amount of NO was observed from CAF-IV cultures (P value = .009) and in coculture with splenocytes, the amount of NO was not significantly altered (P value > .05). Interestingly, significantly low amount of NO was seen in CAF-II and their cocultures with splenocytes (P value < .001). gene expression analysis showed that the level of IDO mRNA was higher in stage
2 CAFs by a mean factor of 182.9 (P< .000) and iNOS was significantly higher in stage 4 CAFs by a mean factor of 0.490 (P<.000). The expression of matrix metalloproteinase 2 and 9 were analyzed by qPCR. The relative mRNA expression, heatmap comparison and volcano plots are shown in figure 4 c-e. The relative expressions and heatmap demonstration were analyzed using REST software and R studio respectively. Real-time PCR analysis revealed that the expression of MMP2 and MMP9 was similar in both CAFs (P>.05). however not significant but MMP2 was higher in CAF-II and MMP9 was higher in CAF-IV.
Figure 4: a production of PGE2 in CAFs, MBL-6 and their corresponding cocultures with splenocytes in vitro was evaluated with ELISA. b Nitric oxide production was evaluated using Griess reagent. Data revealed that highest amount of NO was produced by stage 4 CAFs (P<.000) and stage 2 CAFs produced very low amounts of NO. With no production of NO itself, MBL-6 was able to induce NO in splenocytes with higher production in cell-cell contact. relative gene expression analysis (c), heatmap comparison (d) and volcano plot (d) of MMP2, MMP9, COX-2, IDO, and iNOS expression. mRNAs were extracted from CAFs in passage 2. cDNA was synthesized and Real-time PCR was used to compare gene expressions. CAF-IV was used as Control and CAF-II as the Target in REST analysis. Significant increase in IDO expression was observed in CAF-II and iNOS expression was significantly higher in CAF-IV. (***: P<.000)
6. Discussion
Cellular communications can be done through cell to cell or through molecule to molecule. The immune system employs both and to fully clarify the interactions influencing the immune response in tumors, numerous molecules must be investigated. Additionally, the inflammatory milieu of cancer microenvironment is more divergent, aiding tumor growth and progression. Therefore, in this study, we investigated the level of cytokines and inflammatory enzymes in cocultures of carcinoma associated fibroblasts and splenocytes.
The MBL-6 cell line is isolated from a spontaneous tumor in bal-
b/c mice and was able to form stable growing tumors in Balb/C mice [15]. Using tumor kinetics and metabolic differences, we were able to correctly predict the time of each stage. This allows for closer observation of tumor progression and opens the possibility for comparison of different aspects of tumor biology and treatment in various stages in animal models. In addition, the relatively moderate growth rate in vivo, this line can provide increased accuracy of experimental settings. Accordingly, a tangible stroma is provided by this model, which permits tumor microenvironment assessments. Activated stroma is observed in many cancers [16, 17] and carcinoma associated fibroblasts represent the supporting stroma.
From both stage II and stage IV tumor tissue, CAFs were isolated and characterized which showed similar phenotypes. Although other researches have reported that CAFs do not express HLA-DR [18, 19], our study showed increased expression of HLA-DR on stage IV CAFs which can be the result of inflammatory microenvironment [20, 21]. This variance can be due to evaluations in different stages in different studies. In the absence of co-stimulation CAFs can induce anergy in activated T cells [22], which was evident as lower stimulation index in stage IV co-cultures. Similar study by Peng et. al. showed lower proliferation of T cells in response to dendritic cells pre-treated with HCC isolated CAFs [23]. It has been shown that in inflammatory states, fibroblasts are able to express HLA-DR [24-27] and in some cases antigen presentation was observed [27, 28]. Therefore, CAFs are not merely modulators of immune response in the tumor microenvironment, they can actively alter the response by direct engagement with activated T cells. In cellular contact, Stage-II CAFs, showed stimulating properties with significant increase in splenocyte proliferation. As they express lower levels of HLA-DR, the cytokine milieu may promote T cell survival [29], albeit, our study revealed that CAFII conditioned media suppressed splenocyte proliferation in a dose dependent manner. studies have shown that interaction of immune cells and CAFs promote expression of co-inhibitory markers such as TIM-3, PD-1, CTLA-4 and LAG-3 in proliferating CD4+ and CD8+ T-cells 18, which indicates Treg differentiation
Cytokines are potent drivers of immune responses and are expressed not only by immune cells but various cell types are able to produce cytokines in response to microenvironment stimuli. Although CAFs are not responsible for IL-10 production, they were able to induce IL-10 production in splenocyte. Looking into the cause, production of PGE2 in the presence of TGF-β1 increases the production of IL-10 and inhibits IL-12 [30, 31]. Therefore, the increased expression of COX-2 in CAFs and TGF-β1 production could lead to Treg differentiation and IL-10 production in activated T cells. In addition, nitric oxide also interferes with IL-2 signaling required for T cell proliferation [32] which is increased in stage-IV CAFs. Therefore, CAF-IV inhibited immune cell proliferation via multiple routes and alter their differentiation.
IL-17 is known for its pro-tumorigenic and angiogenic properties [33-35]. It is shown that PGE2 promotes IL-17 production 36 and Treg differentiation via PGE2/COX-2 pathway [37, 38]. Our results showed that IL-17 is produced in both stages, only in cellular contact and requires PHA stimulation. Studies have shown that
TH17 differentiation and IL-17 production increases with gastric cancer stage [39] and is involved in promoting metastasis [40]. Other studies have shown the elevated levels of TGF-β1 in stromal cells of cancerous tissues [41], however the stage in which the expression was evaluated was not defined. It is noteworthy that in cocultures with MBL-6 no significant amount of differentiation cytokine was produced. Although this cannot be extrapolated to other cell lines, but it can be presumed that the role of CAFs in immunosuppression is superior to cancer cells.
IDO is a wound healing enzyme [42, 43] and is induced by IFN-γ [44], IL-12 and IL-18 [45] and PGE2 which requires additional signaling from other cytokines such as TNF-α [46]. IDO plays an important role in the immune response by catalyzing the oxidative degradation of l-tryptophan that contributes to immune-suppression [47]. In response to TGF-β1, pDCs express IDO and show tolergenic properties and has a tonic, nonenzymic function that contributes to TGF-b-driven tolerance [48]. However, IDO is sensitive to NO [49-51], therefore as seen in our results and other studies, with advancing stage in which iNOS is increasingly expressed, IDO declines. In a study by Jian-Pei Feng, a cross-regulatory pathway was shown between the IDO and NO pathways, in which the inhibition of IDO stimulated the iNOS pathway and vice versa [52]. In this study it was shown that only when both pathways were inhibited tolerance was abrogated. Thus, both pathways are involved in tolerance. Hence when considering immune activation in cancer therapies, numerous pathways must be considered.
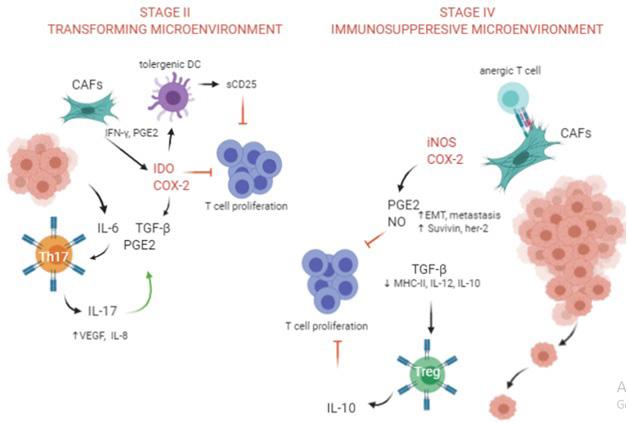
In conclusion, the main difference between the CAFs, was the expression of TGF-β1 and IL-10. TGF-β1 and PGE2 induce IL-10 production [53-55], Additionally, IL-10 inhibits IL-17 and PGE2 production [56-59]. Therefore, increased expression of IL-10 in stage-IV could be an attempt to control inflammation. There are differences between TGF-β1 and IL-10 suppression. TGF-β1 suppression is at translational level and consist of 12-16 hours and IL10 suppression increases mRNA degradation and take in 3 hours [60]. Considering these differences, stage-II cancer can be considered a transforming stage with acute inflammation profile and stage-IV has an immunosuppressive chronic inflammation profile (Figure 5). There are many queries regarding the tumor microenvironment and additional studies are required. In view of our results, when considering an immunotherapy regiment, it is advisable to investigate the microenvironment and whether it is compliant to the type of intended treatment, thereby increasing the probability of successful therapy.
Figure 5: comparison of different immune suppression mechanisms in stage-II and sage-IV microenvironments. In stage II CAFs produce IDO and COX-2 which in conjugation with TGF-β induce IL-17 and VEGF and consequently tumor growth and progression. In stage IV, CAFs produce NO and COX-2 leading to Treg cell differentiation, MMP9 production and EMT.
References
1. Valkenburg KC, de Groot AE, Pienta KJ. Targeting the tumour stroma to improve cancer therapy. Nat Rev Clin Oncol. 2018; 15: 36681.
2. Bremnes RM, Dønnem T, Al-Saad S, et al. The Role of Tumor Stroma in Cancer Progression and Prognosis: Emphasis on Carcinoma-Associated Fibroblasts and Non-small Cell Lung Cancer. Journal of Thoracic Oncology. 2011; 6: 209-17.
3. Räsänen K, Vaheri A. Activation of fibroblasts in cancer stroma. Experimental cell research. 2010; 316: 2713-22.
4. Erez N, Truitt M, Olson P, Hanahan D. Cancer-associated fibroblasts are activated in incipient neoplasia to orchestrate tumor-promoting inflammation in an NF-κB-dependent manner. Cancer cell. 2010; 17: 135-47.
5. Erdogan B, Webb DJ. Cancer-associated fibroblasts modulate growth factor signaling and extracellular matrix remodeling to regulate tumor metastasis. Biochemical Society Transactions. 2017; 45: 229-36.
6. Servais C, Erez N. From sentinel cells to inflammatory culprits: cancer-associated fibroblasts in tumour-related inflammation. The Journal of pathology. 2013; 229: 198-207.
7. Nielsen MFB, Mortensen MB, Detlefsen S. Key players in pancreatic cancer-stroma interaction: Cancer-associated fibroblasts, endothelial and inflammatory cells. World journal of gastroenterology. 2016; 22: 2678.
8. Hawinkels L, Paauwe M, Verspaget H, et al. Interaction with colon cancer cells hyperactivates TGF-β signaling in cancer-associated fibroblasts. Oncogene. 2014; 33: 97-107.
9. Li T, Yang Y, Hua X, et al. Hepatocellular carcinoma-associated fibroblasts trigger NK cell dysfunction via PGE2 and IDO. Cancer letters. 2012; 318: 154-61.
10. Zhai J, Shen J, Xie G, et al. Cancer-associated fibroblasts-derived IL-8 mediates resistance to cisplatin in human gastric cancer. Cancer letters. 2019; 454: 37-43.
11. Nagasaki T, Hara M, Nakanishi H, Takahashi H, Sato M, Takeyama H. Interleukin-6 released by colon cancer-associated fibroblasts is critical for tumour angiogenesis: anti-interleukin-6 receptor antibody suppressed angiogenesis and inhibited tumour–stroma interaction. British journal of cancer. 2014; 110: 469-78.
12. Zhou Q, Wu X, Wang X, et al. The reciprocal interaction between tumor cells and activated fibroblasts mediated by TNF-α/IL-33/ST2L signaling promotes gastric cancer metastasis. Oncogene. 2020; 39: 1414-1428.
13. Tsellou E, Kiaris H. Fibroblast independency in tumors: implications in cancer therapy. 2008.
14. Räsänen K, Virtanen I, Salmenperä P, Grenman R, Vaheri A. Differences in the nemosis response of normal and cancer-associated fibroblasts from patients with oral squamous cell carcinoma. PLoS One. 2009; 4: e6879.
15. Langroudi L, Hasan ZM, Ardeshirylajimi A, Soleimani M. Isolation and characterization of a new cell line from spontaneous mouse mammary tumour, MBL-6, for in vivo cancer studies. Veterinary Science Development. 2017; 7.
16. De Wever O, Mareel M. Role of tissue stroma in cancer cell invasion. The Journal of Pathology: A Journal of the Pathological Society of Great Britain and Ireland. 2003; 200: 429-47.
17. Shimoda M, Mellody KT, Orimo A. Carcinoma-associated fibroblasts are a rate-limiting determinant for tumour progression. Seminars in Cell & Developmental Biology. 2010; 21: 19-25.
18. Gorchs L, Fernández Moro C, Bankhead P, et al. Human pancreatic carcinoma-associated fibroblasts promote expression of co-inhibitory markers on CD4+ and CD8+ T-cells. Frontiers in immunology. 2019; 10: 847.
19. Gunaydin G, Kesikli SA, Guc D. Cancer associated fibroblasts have phenotypic and functional characteristics similar to the fibrocytes that represent a novel MDSC subset. 2015; 4(9): e1034918.
20. Epstein SP, Gadaria-Rathod N, Wei Y, Maguire MG, Asbell PA. HLA-DR expression as a biomarker of inflammation for multicenter clinical trials of ocular surface disease. Exp Eye Res. 2013; 111: 95-104.
21. Newman PJ. The biology of PECAM-1. The Journal of clinical investigation. 1997; 99: 3-8.
22. Wang S-F, Fouquet S, Chapon M, et al. Early T cell signalling is reversibly altered in PD-1+ T lymphocytes infiltrating human tumors. PloS one. 2011; 6: e17621.
23. Cheng J, Deng Y, Yi H, et al. Hepatic carcinoma-associated fibroblasts induce IDO-producing regulatory dendritic cells through IL-6-mediated STAT3 activation. Oncogenesis. 2016; 5: e198-e198.
24. Boots A, Wimmers-Bertens A, Rijnders A. Antigen-presenting capacity of rheumatoid synovial fibroblasts. Immunology. 1994; 82: 268.
25. Olsson M, Rosenqvist M, Nilsson J. Expression of HLA-DR antigen and smooth muscle cell differentiation markers by valvular fibroblasts in degenerative aortic stenosis. Journal of the American College of Cardiology. 1994; 24: 1664-71.
26. Lochhead RB, Ordoñez D, Arvikar SL, et al. Interferon-gamma production in Lyme arthritis synovial tissue promotes differentiation of fibroblast-like synoviocytes into immune effector cells. Cellular microbiology. 2019; 21: e12992.
27. Hutton AJ, Polak ME, Spalluto CM, et al. Human lung fibroblasts present bacterial antigens to autologous lung Th cells. The Journal of Immunology. 2017; 198: 110-8.
28. Elyada E, Bolisetty M, Laise P, et al. Cross-species single-cell analysis of pancreatic ductal adenocarcinoma reveals antigen-presenting cancer-associated fibroblasts. Cancer discovery. 2019; 9: 1102-23.
29. Scott S, Pandolfi F, Kurnick JT. Fibroblasts mediate T cell survival: a proposed mechanism for retention of primed T cells. The Journal of experimental medicine. 1990; 172: 1873-6.
30. Van der Pouw Kraan T, Boeije L, Smeenk R, Wijdenes J, Aarden LA. Prostaglandin-E2 is a potent inhibitor of human interleukin 12 production. The Journal of experimental medicine. 1995; 181: 7759.
31. Yao G, Wang S, Sun L. Thu0226 Mesenchymal Stem Cell Transplantation Ameliorates Experimental Sjögren’s Syndrome by Downregualting Mdscs Via Cox2/Pge2 Pathway. BMJ Publishing Group Ltd; 2020.
32. Sato K, Ozaki K, Oh I, et al. Nitric oxide plays a critical role in suppression of T-cell proliferation by mesenchymal stem cells. Blood. 2007; 109: 228-234.
33. Wu X, Yang T, Liu X, et al. IL-17 promotes tumor angiogenesis through Stat3 pathway mediated upregulation of VEGF in gastric cancer. Tumor Biology. 2016; 37: 5493-501.
34. Li T-J, Jiang Y-M, Hu Y-F, et al. Interleukin-17–producing neutrophils link inflammatory stimuli to disease progression by promoting angiogenesis in gastric cancer. Clinical Cancer Research. 2017; 23: 1575-85.
35. Huang Q, Qian X, Fan J, et al. IL-17 promotes angiogenic factors IL-6, IL-8, and Vegf production via Stat1 in lung adenocarcinoma. Scientific reports. 2016; 6: 36551.
36. Du B, Zhu M, Li Y, Li G, Xi X. The prostaglandin E2 increases the production of IL‐17 and the expression of costimulatory molecules on γδ T cells in rheumatoid arthritis. Scandinavian Journal of Immunology. 2020; 91: e12872.
37. Bai M, Zhang L, Fu B, et al. IL-17A improves the efficacy of mesenchymal stem cells in ischemic-reperfusion renal injury by increasing Treg percentages by the COX-2/PGE2 pathway. Kidney International. 2018; 93: 814-25.
38. Paulissen SM, van Hamburg JP, Davelaar N, Asmawidjaja PS, Hazes JM, Lubberts E. Synovial fibroblasts directly induce Th17 pathogenicity via the cyclooxygenase/prostaglandin E2 pathway, independent of IL-23. The Journal of Immunology. 2013; 191: 13641372.
39. Zhang B, Rong G, Wei H, et al. The prevalence of Th17 cells in patients with gastric cancer. Biochemical and biophysical research communications. 2008; 374: 533-7.
40. Li Q, Han Y, Fei G, Guo Z, Ren T, Liu Z. IL-17 promoted metastasis of non-small-cell lung cancer cells. Immunology letters. 2012; 148: 144-50.
41. Rosenthal E, McCrory A, Talbert M, Young G, Murphy-Ullrich J, Gladson C. Elevated expression of TGF-β1 in head and neck cancer–associated fibroblasts. Molecular Carcinogenesis: Published in cooperation with the University of Texas MD Anderson Cancer Center. 2004; 40: 116-21.
42. Bandeira LG, Bortolot BS, Cecatto MJ, Monte-Alto-Costa A, Romana-Souza B. Exogenous tryptophan promotes cutaneous wound healing of chronically stressed mice through inhibition of TNF-α and IDO activation. PloS one 2015; 10: e0128439.
43. Ito H, Ando T, Ogiso H, Arioka Y, Saito K, Seishima M. Inhibition of indoleamine 2, 3-dioxygenase activity accelerates skin wound healing. Biomaterials. 2015; 53: 221-8.
44. Pereiro P, Figueras A, Novoa B. Insights into teleost interferon-gamma biology: An update. Fish & Shellfish Immunology. 2019; 90: 150-64.
45. Liebau C, Baltzer A, Schmidt S, et al. Interleukin-12 and interleukin-18 induce indoleamine 2, 3-dioxygenase (IDO) activity in human osteosarcoma cell lines independently from interferon-gamma.
Anticancer research. 2002; 22: 931-6.
46. Braun D, Longman RS, Albert ML. A two-step induction of indoleamine 2, 3 dioxygenase (IDO) activity during dendritic-cell maturation. Blood. 2005; 106: 2375-81.
47. Hornyák L, Dobos N, Koncz G, et al. The role of indoleamine-2, 3-dioxygenase in cancer development, diagnostics, and therapy. Frontiers in immunology. 2018; 9: 151.
48. Pallotta MT, Orabona C, Volpi C, et al. Indoleamine 2, 3-dioxygenase is a signaling protein in long-term tolerance by dendritic cells. Nature immunology. 2011; 12: 870-8.
49. Thomas SR, Mohr D, Stocker R. Nitric oxide inhibits indoleamine 2, 3-dioxygenase activity in interferon-gamma primed mononuclear phagocytes. Journal of Biological Chemistry. 1994; 269: 14457-64.
50. Hucke C, MacKenzie CR, Adjogble KD, Takikawa O, Däubener W. Nitric oxide-mediated regulation of gamma interferon-induced bacteriostasis: inhibition and degradation of human indoleamine 2, 3-dioxygenase. Infection and immunity. 2004; 72: 2723-30.
51. López AS, Alegre E, Díaz A, Mugueta C, González A. Bimodal effect of nitric oxide in the enzymatic activity of indoleamine 2, 3-dioxygenase in human monocytic cells. Immunology letters. 2006; 106: 163-71.
52. Ye QX, Xu LH, Shi PJ, Xia T, Fang JP. Indoleamine 2,3-dioxygenase and inducible nitric oxide synthase mediate immune tolerance induced by CTLA4Ig and anti-CD154 hematopoietic stem cell transplantation in a sensitized mouse model. Exp Ther Med. 2017; 14: 1884-91.
53. MacKenzie KF, Clark K, Naqvi S, et al. PGE2 induces macrophage IL-10 production and a regulatory-like phenotype via a protein kinase A–SIK–CRTC3 pathway. The Journal of Immunology. 2013; 190: 565-77.
54. Alvarez Y, Municio C, Alonso S, Crespo MS, Fernández N. The induction of IL-10 by zymosan in dendritic cells depends on CREB activation by the coactivators CREB-binding protein and TORC2 and autocrine PGE2. The Journal of Immunology. 2009; 183: 1471-9.
55. Maeda H, Kuwahara H, Ichimura Y, Ohtsuki M, Kurakata S, Shiraishi A. TGF-beta enhances macrophage ability to produce IL-10 in normal and tumor-bearing mice. The Journal of Immunology. 1995; 155: 4926-32.
56. Niiro H, Otsuka T, Kuga S, et al. IL-10 inhibits prostaglandin E2 production by lipopolysaccharide-stimulated monocytes. International immunology. 1994; 6: 661-4.
57. Liu B, Tonkonogy SL, Sartor RB. Antigen-presenting cell production of IL-10 inhibits T-helper 1 and 17 cell responses and suppresses colitis in mice. Gastroenterology. 2011; 141: 653-62. e654.
58. Gu Y, Yang J, Ouyang X, et al. Interleukin 10 suppresses Th17 cytokines secreted by macrophages and T cells. European journal of immunology. 2008; 38: 1807-13.
59. Wang P-L, Shirasu S, Shinohar M, et al. IL-10 inhibits Porphyromonas gingivalis LPS-stimulated human gingival fibroblasts production of IL-6. Biochemical and biophysical research communications. 1999; 263: 372-7.
60. Bogdan C, Paik J, Vodovotz Y, Nathan C. Contrasting mechanisms for suppression of macrophage cytokine release by transforming growth factor-beta and interleukin-10. Journal of Biological Chemistry. 1992; 267: 23301-8.
61. Bajzer Ž, Vuk-Pavlović S, Huzak M. Mathematical modeling of tumor growth kinetics. A Survey of Models for Tumor-Immune System Dynamics: Springer 1997; 89-133.
62. Edelstein-Keshet L. Mathematical models in biology. SIAM, 2005.
63. Terpstra A. Differences between humans and mice in efficacy of the body fat lowering effect of conjugated linoleic acid: role of metabolic rate. The Journal of nutrition. 2001; 131: 2067-8.
64. Cserni G, Chmielik E, Cserni B, Tot T. The new TNM-based staging of breast cancer. Virchows Archiv. 2018; 472: 697-703.