COMMODITY CORNER Spreading the word on fertilizer Farmers and ranchers manage their soil and plant health, and fertilizers are an important tool used to ensure proper plant nutrition roper nutrition plays a vital role in supporting life of all kinds, and agricultural producers fertilize their crops to promote plant health, growth and production. Plant nutrients are categorized as either macronutrients or micronutrients. Macronutrients are the main focus for farmers and ranchers since they are the main nutrients needed by plants, and are therefore the key components of most fertilizers used in agricultural production. The plant macronutrients are nitrogen, phosphorous and potassium. When applying fertilizers, farmers look at the three macronutrient values – abbreviated as N, P and K – which are often listed as three separate numerical values separated by dashes, such as 11-52-0. These numbers represent the percentage of N, P and K, respectively, contained in a fertilizer.
N
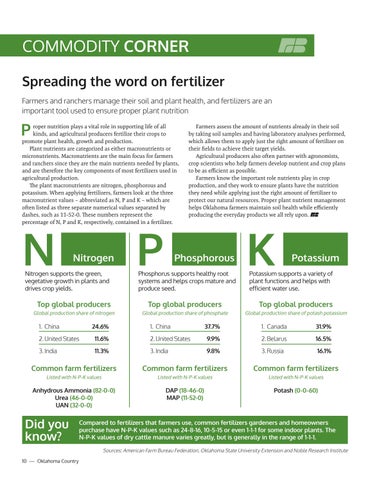
Nitrogen
Nitrogen supports the green, vegetative growth in plants and drives crop yields.
P
Farmers assess the amount of nutrients already in their soil by taking soil samples and having laboratory analyses performed, which allows them to apply just the right amount of fertilizer on their fields to achieve their target yields. Agricultural producers also often partner with agronomists, crop scientists who help farmers develop nutrient and crop plans to be as efficient as possible. Farmers know the important role nutrients play in crop production, and they work to ensure plants have the nutrition they need while applying just the right amount of fertilizer to protect our natural resources. Proper plant nutrient management helps Oklahoma farmers maintain soil health while efficiently producing the everyday products we all rely upon.
Phosphorous
Phosphorus supports healthy root systems and helps crops mature and produce seed.
K
Potassium
Potassium supports a variety of plant functions and helps with efficient water use.
Top global producers
Top global producers
Top global producers
Global production share of nitrogen
Global production share of phosphate
Global production share of potash potassium
24.6%
1. China
1. China
37.7%
1. Canada
31.9%
2. United States
11.6%
2. United States
9.9%
2. Belarus
16.5%
3. India
11.3%
3. India
9.8%
3. Russia
16.1%
Common farm fertilizers
Common farm fertilizers
Common farm fertilizers
Listed with N-P-K values
Listed with N-P-K values
Listed with N-P-K values
Anhydrous Ammonia (82-0-0) Urea (46-0-0) UAN (32-0-0)
DAP (18-46-0) MAP (11-52-0)
Potash (0-0-60)
Did you know?
Compared to fertilizers that farmers use, common fertilizers gardeners and homeowners purchase have N-P-K values such as 24-8-16, 10-5-15 or even 1-1-1 for some indoor plants. The N-P-K values of dry cattle manure varies greatly, but is generally in the range of 1-1-1. Sources: American Farm Bureau Federation, Oklahoma State University Extension and Noble Research Institute
10 — Oklahoma Country