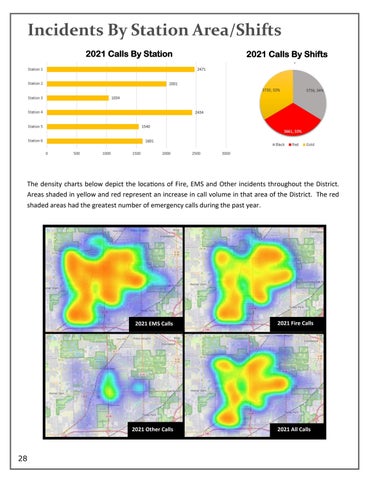
Incidents By Station Area/Shifts 2021 Calls By Station
2021 Calls By Shifts
The density charts below depict the locations of Fire, EMS and Other incidents throughout the District. Areas shaded in yellow and red represent an increase in call volume in that area of the District. The red shaded areas had the greatest number of emergency calls during the past year.
28
2021 EMS Calls
2021 Fire Calls
2021 Other Calls
2021 All Calls