OECD: Measuring the transformation of the economy - green growth Indicators
The environmental and resource productivity of the economy GGIs build on the interaction between economic growth and the environment, central to this is the environmental and resource efficiency of production and consumption. Progress toward green growth can be monitored by relating the use - across time, place and sectors - of environmental services in production to the output generated. Environmental services are functional attributes of natural ecosystems (land, water
and air) and natural resources and materials (energy, pollutants and other residuals). Productivity is commonly defined as a ratio between the volume of output and the volume of inputs. In other words, it measures how efficiently production inputs, such as labour and financial capital, are being used in an economy to produce a given level of output.
The OECD GGIs under this heading focus on: Environmentally adjusted multi-factor productivity,4 which accounts for the role of environmental services in productivity growth. Economic growth can be increased either by raising the labour and capital inputs used in production, or by improving the overall efficiency in how these inputs are used together, i.e. higher multifactor productivity (MFP) growth. Growth in MFP is measured as the residual growth, i.e., that part of GDP growth that cannot be explained by growth in labour or capital input (OECD, 2013c).
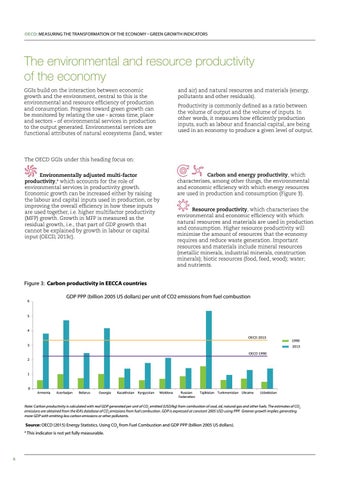
Carbon and energy productivity, which characterises, among other things, the environmental and economic efficiency with which energy resources are used in production and consumption (Figure 3). Resource productivity, which characterises the environmental and economic efficiency with which natural resources and materials are used in production and consumption. Higher resource productivity will minimise the amount of resources that the economy requires and reduce waste generation. Important resources and materials include mineral resources (metallic minerals, industrial minerals, construction minerals); biotic resources (food, feed, wood); water; and nutrients.
Figure 3: Carbon productivity in EECCA countries GDP PPP (billion 2005 US dollars) per unit of CO2 emissions from fuel combustion
6
5
4 OECD 2013 3
1990 2013
OECD 1990 2
1
0
Armenia
Azerbaijan
Belarus
Georgia
Kazakhstan Kyrgyzstan
Moldova
Russian Federation
Tajikistan Turkmenistan Ukraine
Uzbekistan
Note: Carbon productivity is calculated with real GDP generated per unit of CO2 emitted (USD/kg) from combustion of coal, oil, natural gas and other fuels. The estimates of CO2 emissions are obtained from the IEA’s database of CO2 emissions from fuel combustion. GDP is expressed at constant 2005 USD using PPP. Greener growth implies generating more GDP with emitting less carbon emissions or other pollutants.
Source: OECD (2015) Energy Statistics. Using CO2 from Fuel Combustion and GDP PPP (billion 2005 US dollars). 4
6
This indicator is not yet fully measurable.