OECD: Measuring the transformation of the economy - green growth Indicators
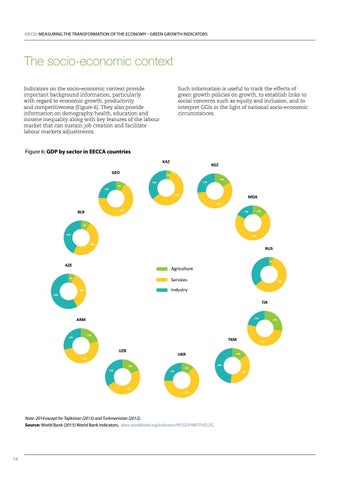
The socio-economic context Indicators on the socio-economic context provide important background information, particularly with regard to economic growth, productivity and competitiveness (Figure 6). They also provide information on demography, health, education and income inequality along with key features of the labour market that can sustain job creation and facilitate labour markets adjustments.
Such information is useful to track the effects of green growth policies on growth, to establish links to social concerns such as equity and inclusion, and to interpret GGIs in the light of national socio-economic circumstances.
Figure 6: GDP by sector in EECCA countries KAZ GEO
KGZ
5% 27%
36%
17%
9%
24%
59%
MDA 56%
36%
67%
BLR
15%
17%
9%
42%
68% 49%
RUS 4%
AZE
Agriculture Services
6%
60%
Industry
36% 58% 58%
TJK
22%
ARM
21%
29%
TKM UZB
UKR
50% 19% 34%
25%
12%
63%
Note: 2014 except for Tajikistan (2013) and Turkmenistan (2012). Source: World Bank (2015) World Bank Indicators, data.worldbank.org/indicator/NY.GDP.MKTP.KD.ZG.
14
51%
15%
48% 37%
47%
27%