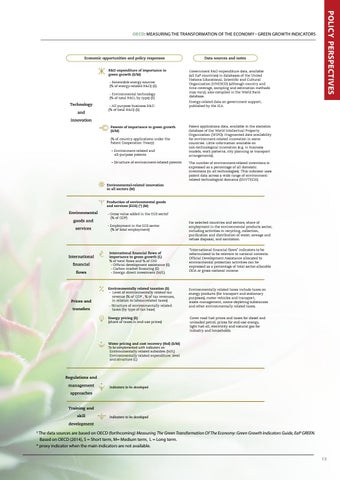
Economic opportunities and policy responses R&D expenditure of importance to green growth (S/M) - Renewable energy sources (% of energy-related R&D) (S) - Environmental technology (% of total R&D, by type) (S)
Technology and
- All purpose business R&D (% of total R&D) (S)
Data sources and notes
Government R&D expenditure data, available (all EaP countries) in databases of the United Nations Educational, Scientific and Cultural Organization (UNESCO) (although country and time coverage, sampling and estimation methods may vary); also complied in the World Bank database.
policy Perspectives
OECD: Measuring the transformation of the economy - green growth Indicators
Energy-related data on government support, published by the IEA.
innovation Patents of importance to green growth (S/M) (% of country applications under the Patent Cooperation Treaty) - Environment-related and all-purpose patents - Structure of environment-related patents
Patent applications data, available in the statistics database of the World Intellectual Property Organization (WIPO). Fragmented data availability for environment-related innovation in some countries. Little information available on non-technological innovation (e.g. in business models, work patterns, city planning or transport arrangements). The number of environment-related inventions is expressed as a percentage of all domestic inventions (in all technologies). This indicator uses patent data across a wide range of environmentrelated technological domains (ENVTECH).
Environmental-related innovation in all sectors (M)
Production of environmental goods and services (EGS) (*) (M)
Environmental goods and services
International financial flows
- Gross value added in the EGS sectof (% of GDP) - Employment in the EGS sector (% of total employment)
International financial flows of importance to green growth (L) % of total flows and % of GNI - Official development assistance (S) - Carbon market financing (S) - Foreign direct investment (M/L)
Prices and
Environmentally related taxation (S) - Level of environmentally related tax revenue (% of GDP , % of tax revenues, in relation to labour-related taxes)
transfers
- Structure of environmentally related taxes (by type of tax base) Energy pricing (S) (share of taxes in end-use prices)
For selected countries and sectors, share of employment in the environmental products sector, including activities in recycling, collection, purification and distribution of water, sewage and refuse disposal, and sanitation. “International financial flows� indicators to be reformulated to be relevant to national contexts. Official Development Assistance allocated to environmental protection activities can be expressed as a percentage of total sector-allocable ODA or gross national income.
Environmentally related taxes include taxes on energy products (for transport and stationary purposes), motor vehicles and transport, waste management, ozone-depleting substances and other environmentally related taxes. Cover road fuel prices and taxes for diesel and unleaded petrol; prices for end-use energy, light fuel oil, electricity and natural gas for industry and households.
Water pricing and cost recovery (tbd) (S/M) To be complemented with indicators on: Environmentally related subsidies (M/L) Environmentally related expenditure: level and structure (L)
Regulations and management
Indicators to be developed
approaches
Training and skill
Indicators to be developed
development
The data sources are based on OECD (forthcoming) Measuring The Green Transformation Of The Economy: Green Growth Indicators Guide, EaP GREEN. Based on OECD (2014), S = Short term, M= Medium term, L = Long term. * proxy indicator when the main indicators are not available.
1
13