280 _
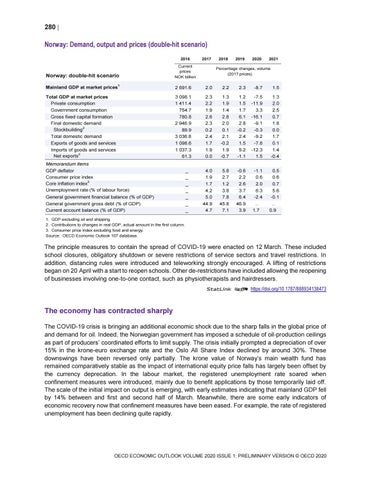
Norway: Demand, output and prices (double-hit scenario) 2016
2017
2018
2019
2020
2021
Norway: double-hit scenario
Current prices NOK billion
Mainland GDP at market prices1
2 691.6
2.0
2.2
2.3
-8.7
1.5
Total GDP at market prices Private consumption Government consumption Gross fixed capital formation Final domestic demand Stockbuilding2
3 098.1 1 411.4 754.7 780.8 2 946.9 89.9 3 036.8 1 098.6 1 037.3 61.3
2.3 2.2 1.9 2.6 2.3 0.2 2.4 1.7 1.9 0.0
1.3 1.9 1.4 2.8 2.0 0.1 2.1 -0.2 1.9 -0.7
1.2 1.5 1.7 6.1 2.8 -0.2 2.4 1.5 5.2 -1.1
-7.5 -11.9 3.3 -16.1 -9.1 -0.3 -9.2 -7.8 -12.3 1.5
1.3 2.0 2.5 0.7 1.8 0.0 1.7 0.1 1.4 -0.4
4.0 1.9 1.7 4.2 5.0 44.9 4.7
5.8 2.7 1.2 3.8 7.8 45.8 7.1
-0.6 2.2 2.6 3.7 6.4 46.9 3.9
-1.1 0.6 2.0 6.3 -2.4 .. 1.7
0.5 0.6 0.7 5.6 -0.1 .. 0.9
Total domestic demand Exports of goods and services Imports of goods and services Net exports2 Memorandum items GDP deflator Consumer price index Core inflation index3 Unemployment rate (% of labour force) General government financial balance (% of GDP) General government gross debt (% of GDP) Current account balance (% of GDP)
_ _ _ _ _ _ _
Percentage changes, volume (2017 prices)
1. GDP excluding oil and shipping. 2. Contributions to changes in real GDP, actual amount in the first column. 3. Consumer price index excluding food and energy. Source: OECD Economic Outlook 107 database.
The principle measures to contain the spread of COVID-19 were enacted on 12 March. These included school closures, obligatory shutdown or severe restrictions of service sectors and travel restrictions. In addition, distancing rules were introduced and teleworking strongly encouraged. A lifting of restrictions began on 20 April with a start to reopen schools. Other de-restrictions have included allowing the reopening of businesses involving one-to-one contact, such as physiotherapists and hairdressers. StatLink 2 https://doi.org/10.1787/888934138473
The economy has contracted sharply The COVID-19 crisis is bringing an additional economic shock due to the sharp falls in the global price of and demand for oil. Indeed, the Norwegian government has imposed a schedule of oil-production ceilings as part of producers’ coordinated efforts to limit supply. The crisis initially prompted a depreciation of over 15% in the krone-euro exchange rate and the Oslo All Share Index declined by around 30%. These downswings have been reversed only partially. The krone value of Norway’s main wealth fund has remained comparatively stable as the impact of international equity price falls has largely been offset by the currency deprecation. In the labour market, the registered unemployment rate soared when confinement measures were introduced, mainly due to benefit applications by those temporarily laid off. The scale of the initial impact on output is emerging, with early estimates indicating that mainland GDP fell by 14% between and first and second half of March. Meanwhile, there are some early indicators of economic recovery now that confinement measures have been eased. For example, the rate of registered unemployment has been declining quite rapidly.
OECD ECONOMIC OUTLOOK VOLUME 2020 ISSUE 1: PRELIMINARY VERSION © OECD 2020