FEATURE
©iStock 2019. Pixfly
HOW HAS THE BARCLAYS PREMIER LEAGUE BECOME MORE UNEQUAL THAN ZIMBABWE? By Daniel Ford, Economics (2021)
A
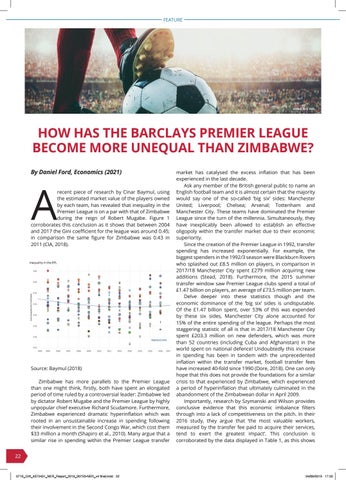
recent piece of research by Cinar Baymul, using the estimated market value of the players owned by each team, has revealed that inequality in the Premier League is on a par with that of Zimbabwe during the reign of Robert Mugabe. Figure 1 corroborates this conclusion as it shows that between 2004 and 2017 the Gini coefficient for the league was around 0.45; in comparison the same figure for Zimbabwe was 0.43 in 2011 (CIA, 2018).
Source: Baymul (2018) Zimbabwe has more parallels to the Premier League than one might think, firstly, both have spent an elongated period of time ruled by a controversial leader: Zimbabwe led by dictator Robert Mugabe and the Premier League by highly unpopular chief executive Richard Scudamore. Furthermore, Zimbabwe experienced dramatic hyperinflation which was rooted in an unsustainable increase in spending following their involvement in the Second Congo War, which cost them $33 million a month (Shapiro et al., 2010). Many argue that a similar rise in spending within the Premier League transfer
market has catalysed the excess inflation that has been experienced in the last decade. Ask any member of the British general public to name an English football team and it is almost certain that the majority would say one of the so-called ‘big six’ sides: Manchester United; Liverpool; Chelsea; Arsenal; Tottenham and Manchester City. These teams have dominated the Premier League since the turn of the millennia. Simultaneously, they have inexplicably been allowed to establish an effective oligopoly within the transfer market due to their economic superiority. Since the creation of the Premier League in 1992, transfer spending has increased exponentially. For example, the biggest spenders in the 1992/3 season were Blackburn Rovers who splashed out £8.5 million on players, in comparison in 2017/18 Manchester City spent £279 million acquiring new additions (Stead, 2018). Furthermore, the 2015 summer transfer window saw Premier League clubs spend a total of £1.47 billion on players, an average of £73.5 million per team. Delve deeper into these statistics though and the economic dominance of the ‘big six’ sides is undisputable. Of the £1.47 billion spent, over 53% of this was expended by these six sides, Manchester City alone accounted for 15% of the entire spending of the league. Perhaps the most staggering statistic of all is that in 2017/18 Manchester City spent £203.3 million on new defenders, which was more than 52 countries (including Cuba and Afghanistan) in the world spent on national defence! Undoubtedly this increase in spending has been in tandem with the unprecedented inflation within the transfer market, football transfer fees have increased 40-fold since 1990 (Dore, 2018). One can only hope that this does not provide the foundations for a similar crisis to that experienced by Zimbabwe, which experienced a period of hyperinflation that ultimately culminated in the abandonment of the Zimbabwean dollar in April 2009. Importantly, research by Szymanski and Wilson provides conclusive evidence that this economic imbalance filters through into a lack of competitiveness on the pitch. In their 2016 study, they argue that ‘the most valuable workers, measured by the transfer fee paid to acquire their services, tend to exert the greatest impact’. This conclusion is corroborated by the data displayed in Table 1, as this shows
22
0716_GW_4372431_NER_Report_2019_00723-NER_v4 final.indd 22
04/09/2019 17:55


