17 minute read
A Comparative Study of High-Pressure vs Low-Pressure Grease Dispensing Systems For Applying Rail Curve Grease


Dr. Lou A. Honary and Mr. Saeed Zaher Soleimani Environmental Lubricants Manufacturing, Inc. Grundy Center, IA 50638, USA
Abstract
This paper reports results from over a year of field test investigation of two grease dispensers on a short line railroad. Testing took place in the northern Iowa region that offers extremes of hot and cold temperatures. These conditions are suitable for investigation of the effectiveness of systems for applying grease at both temperature extremes.
Grease dispensing equipment, also called lubricators, is typically operated by batteries that are charged on location by solar collectors. A wheel sensor placed ahead of a lubricator senses the arrival of the train wheels and signals the battery-operated electric motor to run the pump to force the grease into the grease delivery bars attached to the inside of the gauge faces of the track.
In this study, two grease lubricators from two OEMs were placed in the middle of an S-shaped track curve. Each lubricator delivered grease to one of the tracks. Then, using a tribometer, engineers collected friction readings on the tracks at different distances from the lubricators in both directions. Additionally, the collected data included daily temperature readings, grease flow via an automated flow recorder, and other pertinent information.
The results of this study should be helpful to railroad friction management personnel, grease manufacturers, and grease lubricator designers and manufacturers.
Railway Curve Lubricants
Lubricants and friction modifiers for railroad tracks are available in several forms including grease, oil, water, and polymer-based mixtures. Solids such as graphite, molybdenum disulfide, solid stick lubricants, pastes, and sprays are also applied to the track or to the wheel flange via various applicators.
The established methods for lubricating railway tracks or wheel flanges include wayside, on-board, and high-rail lubrication methods.
In the wayside method, track lubricant or friction modifier, typically a grease, is applied to each wheel flange. The lubricated flange rubs the grease on the inside part of the track’s profile known as the gauge face. This is where the track curves and wheel flanges exert lateral forces.
The high-rail method relies on a small truck with flanged wheels that drives on the portions of the track that need lubrication. The truck carries the grease in a reservoir and uses a pump to apply beads of grease to the gauge face of the track.
An on-board unit uses a pump and hoses to deliver the grease to a nozzle that applies a bead of grease to the gauge face of the track.
sensor, and a control system that modulates the duration of operation of the pump based on the number of wheels passing the proximity sensor. Hoses deliver the grease to the rail through wiper bars attached to the gauge face of the rail. Wheel flanges come in contact with grease on the gauge faces and carry it along the track curve and beyond.
• Wayside lubricator • Trackside reservoir • Battery, electric motor, and pump • Solar Panel • Wiper bars clamped to the inside rails
Figure 1: Basic components of a wayside grease dispenser (lubricator) and grease on gauge face1
In principle, a rail curve grease seems simple because it is applied once and then is lost to the environment. But in practice, it requires a multitude of performance attributes that make it a complex product. While there are no internationally accepted standards for rail greases currently, desired attributes include the following:
1. High extreme pressure property 2. Adequate level of adhesion to wheel flanges and gauge faces of tracks 3. Adequate level of cohesiveness necessary for “carry” down the track and for preventing pump cavitation 4. Good cold temperature flowability in hoses and lines from the reservoir to the distribution bars 5. Adequate flowability within the reservoir for continued flow into the pump inlet at lower grease levels in the reservoir 6. Acceptable anti-rust and anti-corrosion properties 7. Desired level of conductivity so as to not interfere with electrical signals 8. 8. High thin film strength for base oil 9. 9. High viscosity index (VI) for base oil 10. 10. High flash and fire points for base oil 11. 11. Biodegradability so as to not accumulate in the ballast or layer of gravel on which the railroad ties are laid, which could render the tracks unstable.
Testing in an Environmental Chamber and Results
Before they were tested in the field, two OEM lubricators were first tested in an environmental chamber where the temperatures of the equipment and grease were changed from about 65 °C (149 °F) to -23 °C (-9.4 °F). The amount of grease pumped at various temperatures was documented. Figure 2 shows the two lubricators in the environmental chamber.
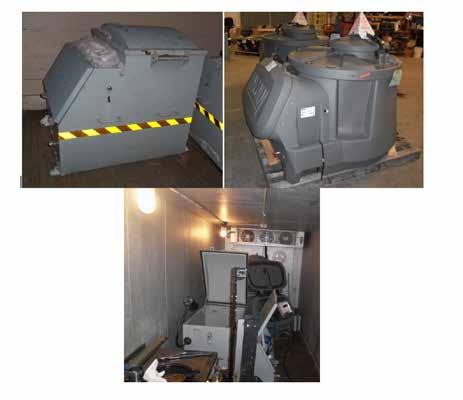
Figure 2: The high-pressure Unit 1 (top right) and the low-pressure Unit 2 (top left) were tested in the environmental chamber (bottom).
The two lubricators were tested in the environmental chamber to simulate the passing of 50 consecutive 25-car trains with 60 ft. (18.3 m) car centers running at 5 mph (8 kph). After each train passed, there was a 1 min delay before the next train arrived in the simulation.
a. Through experimentation with the simulation, it was determined that Unit 1 should be set to pump for 0.35 sec every 5 axles to output 0.3778 lb (0.1714 kg) of grease at 100 °F (30.5 °C) during the passage of one train. Unit 2 was set to pump for 3.5 sec on every axle to match the output of Unit 1. The settings on Unit 2 are such because a relay is used to simulate a wheel count every time the Unit 1 pump engages. It is also determined that these settings on the Unit 2 output 0.3908 lb (0.1773 kg) under the same conditions, above. The output for each lubricator was similar under the same conditions and close to a desirable 0.8 lb (0.4 kg) grease per 100 wheels. (One bar system should be half of that value.)
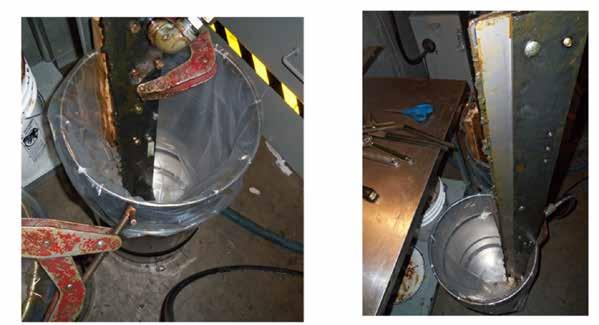
b. After each simulation, the environmental chamber was cooled to the next lower temperature and the grease allowed to acclimate to the new temperature for a minimum of 24 h. The same simulation was run at each temperature. Figure 3 shows the reservoir of each lubricator before the start of the test. The grease in each reservoir was leveled and the height of the grease in the tank was recorded. Figure 4 shows the grease dispensing bar from each manufacturer and the drum used to collect and determine the weight of the grease after each test.
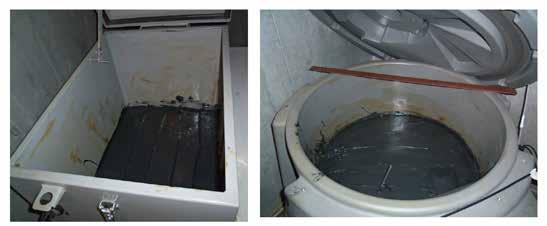
Figure 3: The lubricators from the two OEMs were filled with the same quantity of grease and tested at the same temperature in the environmental chamber.
In addition to determining the amount of grease pumped by each lubricator, other visual monitoring included observation of the shape of the grease in each reservoir and measurement of the level of the grease at the center and side wall of each reservoir. However, no distinguishable visual difference between the shape of greases in the reservoirs was observed.
Field Testing and Results
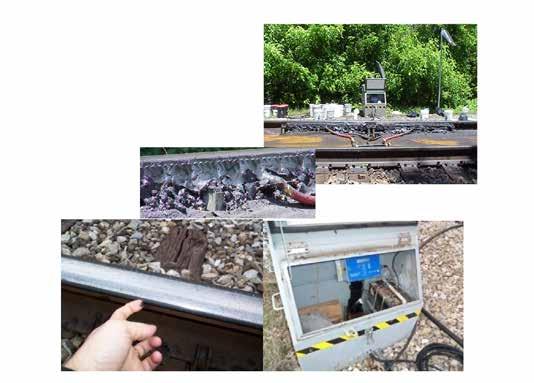
Two grease lubricators from two OEMs were placed in the middle of an S-shaped track curve where each fed grease to one of the tracks. Figure 5 shows the test set up at the Iowa Northern Railway test location. The two grease dispensers were placed next to each other, but the outlet hose from each one fed the grease to one track. The bi-directional traffic at the location allowed the grease to be carried in both directions. When the train travels around curves, the outside track (the high rail) and the inside track (low rail) are exposed to different loads and wear.
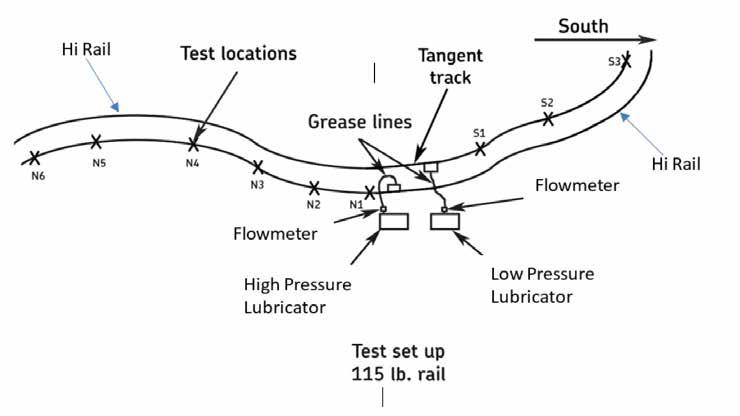
Figure 5: Schematic of test set up of high-pressure Unit 1 and low-pressure Unit 2 on an S-shaped curve
On an S-shaped curve, each track can be a high rail for the train going in one direction or a low rail when the train travels in the opposite direction. Figure 6 shows photos of the lubricators on location, on the lefthand side of the tracks facing north. Figure 7 presents the tribometer used for measuring the coefficient of friction at predetermined locations.
The main differences between the two lubricators are the pump and the means of distributing grease to the outlets of the lubricator bars.
In Unit 1, the high-pressure pump is a positive displacement mechanical shovel pump. The benefit of this pump design is that the mechanical shovel maintains a 98% prime of the pump when the grease gets stiff at cold temperatures.
In Unit 2, the low-pressure unit uses a gear pump, and priming of the pump can suffer when the grease is stiff at colder temperatures, thus reducing output.
Another difference is that the high-pressure Unit 1 uses positive displacement valves to evenly distribute grease at the lubrication bar outlets. The low-pressure Unit 2 used variable orifices to distribute the grease out of the lubrication bar. Lubricator bars were 1,400 mm (54 in) in length for both systems.
Figure 6: Test site facing north with the lubricators
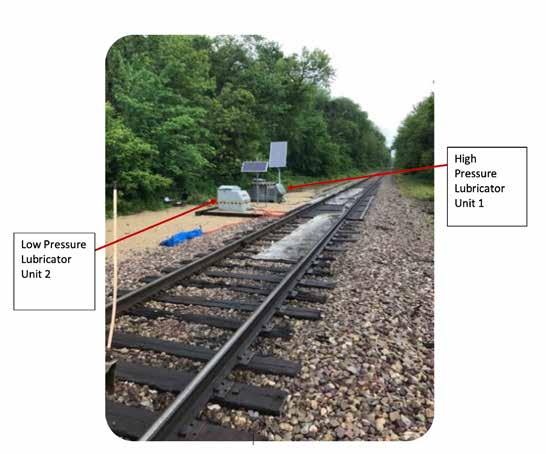
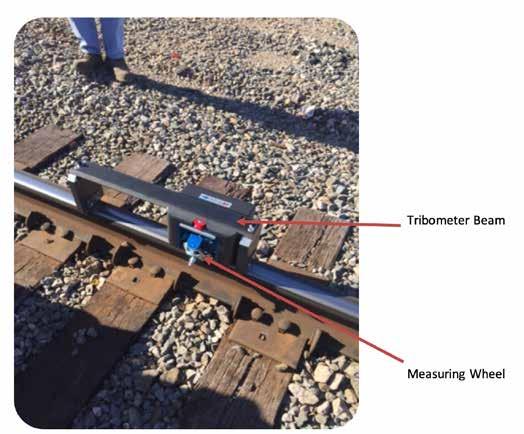
Figure 7: Tribometer used for measuring the coefficient of friction
The output from the low-pressure Unit 2 was applied to the far side (low rail) for trains travelling in the south direction, and the opposite (high rail) for trains going in the north direction. The output of the high-pressure Unit 1 was applied to the near side (high rail) for south-bound trains and on the low rail for north-bound trains.
The Data Measuring Technology - The On-Track Tribometer
The tribometer used in this study (Figure 7) operates based on stick slip mechanics and is different from the previous versions of tribometers, which were hand operated or truck mounted. This portable lightweight device obtains friction data by measuring lateral and vertical force values on a test wheel. The wheel is oriented from 1 to 3 degrees from the longitudinal path of the track to obtain lateral friction forces. The vertical friction force is obtained by applying force directly down on the test wheel.
The tribometer is fully self-contained, requiring only that the operator correctly sets the head with respect to the gauge corner of the candidate rail and locks the magnets that affix the beam to the top of the candidate rail. For safety, the beam can be grasped and quickly pulled off in case there are any approaching vehicles. Control is provided via a generic tablet with a Wi-Fi link and a standard browser.
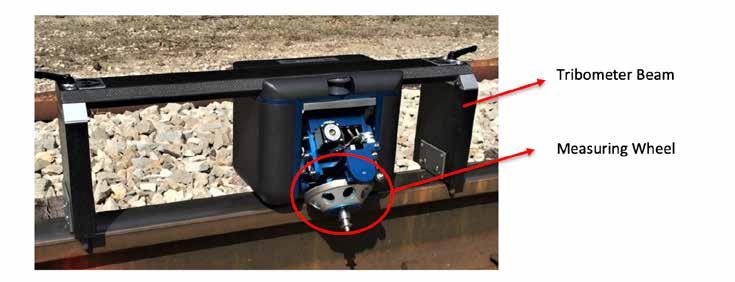
The operator sets the head positions and the desired Hertzian forces for a given series of tests and touches the ‘Run’ button. Results are plotted on the tablet and document the location of measurement via GPS to a cell phone, notepad, or remote storage. A quick-release measuring wheel tread allows for easy removal and cleaning so that each new test location has a fresh surface condition on the measuring wheel. Figure 8 shows a close-up view of the measuring wheel.
According to Harrison (2015), “Determining the coefficient of friction (µ) at the wheel/rail interface is a key diagnostic tool for optimizing the maintenance of freight and transit infrastructure, as well as improving the quality of analytical models used to predict vehicle performance.” Unlike some lubricants that are visible to the naked eye, solid friction management and lubricant products involve the deposition of a layer from 0.5 to 5 µm thick within the wheel-rail interface. At this thickness, it is impossible to visually confirm its presence. Hence, tribometers can be effective tools for objectively determining the presence of lubricant at the desired location on the rail.
Figure 8: A close-up view of the tribometer’s measuring wheel at the measuring position
Validation Testing of the On-Track Tribometer
Before field testing was performed, it was necessary to verify if the tribometer can measure L/V (lateral/ vertical) friction data that can detect the presence of grease on a gauge face compared to a dry track (no lubricant). With test rails in the lab, 10 measurements were taken and recorded. Two rails were used, one smooth and one rough. Friction data were recorded for each rail in dry and lubricated states. The mean and standard deviation of the friction for each set of conditions were calculated with the following results:
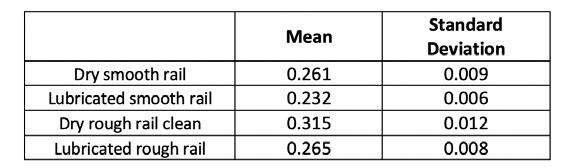
Table 1: The means and standard deviations of friction measurements in the lab
The results of the laboratory tests indicated that this tribometer can effectively detect the presence of lubrication on gauge faces.
Field Testing
The locations where the friction readings were taken are shown in Figure 9. Additionally, the collected data included daily temperature readings, grease flow via an automated flow recorder, and other pertinent information.
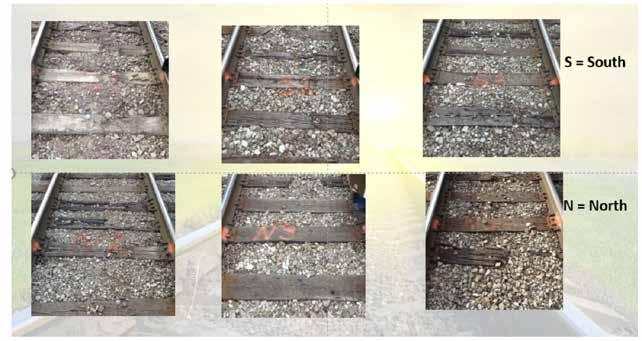
Figure 9: Example of mark ings on the track locations where friction was measured
Table 3 shows the axle counts throughout the test period. The axle counts represent the total axle count, which includes both directions. Approximately 50% of axle counts are in each direction. A conventional mineral oil-based grease was used in both lubricators starting August 23, 2016. Then, the grease in both lubricators was changed to a biobased grease September 13, 2017. The grease was changed at the request of Iowa Northern Railway because the conventional grease was not being carried along the tracks to locations that were farthest from the applicators.
Table 3: Test dates and axle counts with approximately 50% travel in each direction
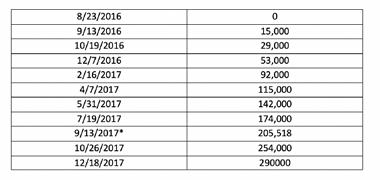
* The grease was changed from a mineral oil-based to a biobased gauge-face formulation.
Figure 10 shows the friction coefficients as measured at the test locations for the high-pressure Unit 1 (top) and the low-pressure Unit 2 (bottom).
Figure 10: The friction coefficients as measured at the test locations for the high-pressure (top) and lowpressure (bottom) grease dispensers.
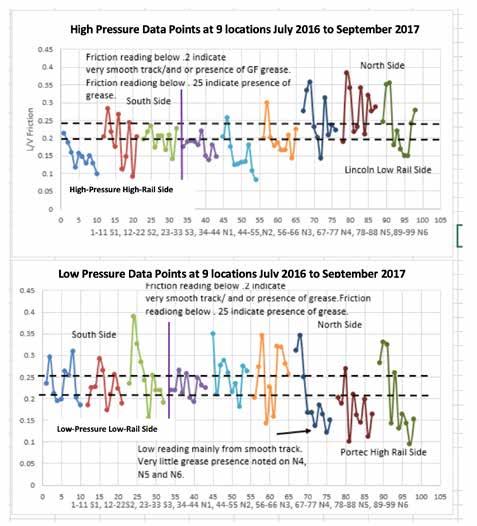
Figure 10 shows plots of the friction values recorded over the life of the testing. Each grouping of lines is a test location. From left to right, the south directions are S1, S2, and S3 with S3 being furthest from the lubricator. In the north direction, the locations are, from left to right, N1 to N6 with N6 being furthest from the lubricator.
Figure 9 shows an example of markings on the rail ties where friction measurements were taken on both tracks to determine the presence of grease. Generally, the friction readings were lower when the temperature was warmer, above 70 °F (21.1 °C). The charts in Figure 10 generally show this behavior.
Each test point in a group corresponds to the date the test was conducted. Eleven measurements were taken from July 2016 to December 2017. The date of each test is listed in Table 1. From September 2017, grease was changed to a biobased product. This grease tended to show better carry rate and carry over longer distances than the original grease, which was a mineral oil-based product.
It was observed that with a friction value below 0.25, there was some presence of grease on the gauge face. With friction below 0.20, there was a combination of smooth track often with some presence of grease. Readings above 0.30 were generally due to a dirty track or track with surface rail defects.
Grease carry was most noticeable on the high rail side. As shown in the lower graph in Figure 10, grease was present on the high rail (north side) out to N6, which was furthest from the lubricator. This indicated a better carry distance.
Figure 11 (below) shows the rate of grease carry on high and low rails. The general trend over the test was an average drop in friction on the gauge face of 14% on the low rail and 19% on the high rail.
Lower grease carry rates were observed below 30 °F (-1.1 °C), and higher grease carry rates above 70 °F (21.1 °C).
Grease yield stress was measured. A yield stress below 250 Pa is too thin for good carry as the grease drips off the lubricator bars. And a grease yield stress above 500 Pa is too stiff for the grease to adhere and be carried down the track. Figure 12 shows the temperature during the testing time.
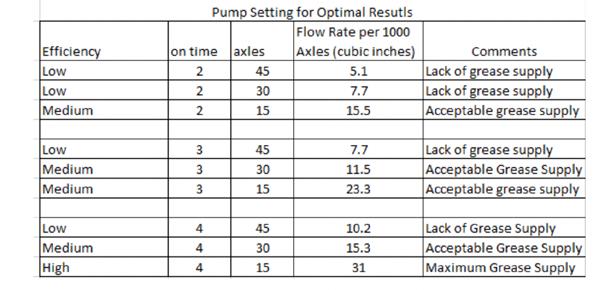
Table 2: Pump settings for optimal results. Higher than 4 sec on 15 axles caused grease run off from the lubricator bar
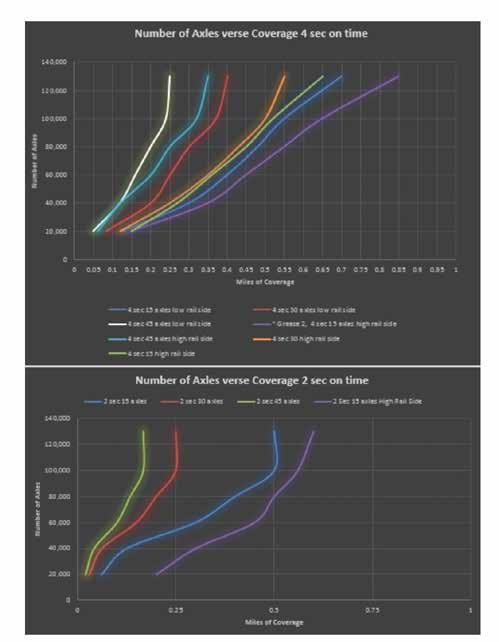
Figure 11: Miles of coverage verses axle count
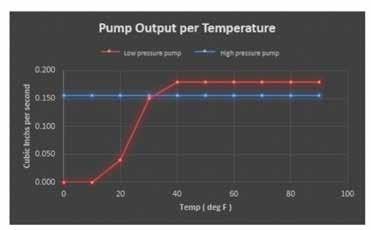
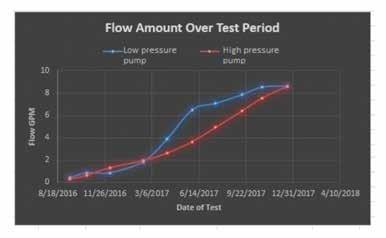
Figure 12:
Output of each pump at different ambient temperature
Figure 13:
Cumulative flow at measurement dates
Flow rate was consistent for the high-pressure Unit 1 over the temperature range. Flow settings increased in June of 2017. Output flow for low-pressure Unit 2 fluctuated over the temperature range with reduction in flow at colder temperatures.
Temperature Effects
During the cold months and lower temperatures during this study, the flowrate for the high-pressure Unit 1 stayed consistent. Whereas for the low-pressure Unit 2, the output flow fluctuated and presented noticeable reduction at low temperatures. Consequently, the grease coverage on the corresponding track was lower for Unit 2 in comparison to Unit 1.
Ideal Grease Properties
One of the most important properties of an effective rail grease is its adherence to the gauge face. Lubricant must stay on the gauge face in order to be carried along the track by the wheel flanges. It is crucial that grease not migrate from the gauge face to the top of the rail (the crown). If the grease migrates to the top of the track (due to overgreasing or inadequate formulation), then it could create problems with braking and wheel slippage going uphill.
For an appropriate level of adhesion, gauge face grease needs the right level of tackiness. Too much tackiness can cause the grease to remain on the applicator bars and not be carried by the wheel flanges. In other words, an effective rail grease must demonstrate a balance between adhesiveness and cohesiveness. This balance should be maintained within the operating temperature range of the grease.
In order to achieve the best grease performance during the course of this study, the grease was changed according to the seasonal temperatures so the operating temperature range of the rail grease was met. Therefore, at the beginning of each season, the lubricators’ reservoirs were emptied and the delivery lines were flushed. The lubricators’ reservoirs were filled with a rail grease that was rated for the season temperatures.
Summary
The results from this study showed that a high-pressure applicator performed better than a low-pressure applicator. The high-pressure applicator delivered grease more consistently over a wide temperature range, but especially at the extremely cold temperatures, in comparison to the low-pressure applicator. Total grease consumption of the two units was very close over the entire test period. Both lubricator systems used positive displacement pumps that were programmed properly to deliver the same amount of grease. At extreme cold temperatures, the high-pressure unit was better able to overcome the flow resistance of the grease. Hence it delivered a more consistent amount of lubricant at those temperatures than the low-pressure unit.
Grease was carried farther on the track treated with the high-pressure applicator than the low-pressure applicator, perhaps due to more continuous delivery at colder temperatures. This was detected on both north and south sides of the tracks.
Reference
1. Harrison, H. D. (2015). Development of a Third Generation Tribometer. Proceedings from CM ‘2015: 10th International Conference on Contact Mechanics of Wheel/Rail Systems Colorado Springs, Colorado.
Acknowledgements
The authors would like to thank Mr. Paul Conley, Chief Technologist - Lubrication Business Unit, SKF Industrial Market, Strategic Industries, for sponsorship and full support of this project. Additionally, the authors thank Mr. William Magee, Manager of Iowa Northern Railway, and his team for support in equipment installation and data collection throughout the project.


