25 minute read
Initial Steps of Lithium Soap Grease Thickener Agglomeration


Paul Shiller The University of Akron Akron, OH 44325
Presented at the NLGI 85th Annual Meeting Coeur D’Alene, ID June 9-12, 2018
Abstract
In lithium soap thickened greases, soap molecules form a fibrous network. This fundamental study investigated the arrangement of lithium 12-hydroxystearic acid molecules at the earliest stage of thickening in mineral oil. Experimental data suggested that an initial structure or arrangement of thickener molecules formed when about 4% soap thickener was dispersed in base oil. Rheological measurements showed that at this concentration, the mixture first exhibited viscoelastic properties with its solid-like storage modulus at about the same value as its liquid-like viscous modulus. This concentration was defined as the critical micelle concentration (CMC). Infrared analysis spectra were consistent with results from computer models that showed that the lowest energy arrangement for two lithium 12-hydroxystearic acid (Li-12HSA) molecules was a structure where the tails were opposite the head groups, due to a repulsion between the tail groups, and with the head groups in a planar arrangement.
Introduction: What do we know about grease?
The common understanding of how grease lubrication thickeners work is a “sponge” analogy. It is difficult to determine when this analogy started, but in 1951, Bondi et al. stated that the consistency of grease is due to the thin fibrous shapes of the soap particles forming a latticework that holds the oil by capillary action where the oil can easily flow into the small narrow spaces between the grease fibers.1 In 1954, Boner et al. reviewed the literature discussion about syneresis and bleed.2 Syneresis is the expulsion of liquid as the fibrous lattice structure collapses, and bleed is release of oil due to defects in the network. These terms (syneresis and bleed) are used interchangeably and are related to the effects of pressure on the lubricating grease; i.e., a sponge that can hold oil and release it under pressure. The fibrous structure of soap thickener in grease was known from the 1950s through electron micrographs produced by Brown, Huddson, and Loring.3
Grease, as it is known today, is a three-dimensional network of thickener particles in oil. These thickener particles interact with each other and the oil, forming a matrix through physical forces. The pores of this network are filled with oil.
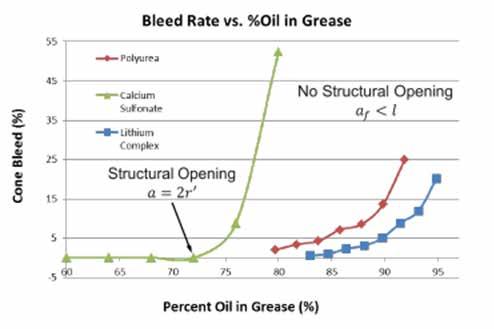
Recently, Saatchi et al. developed an oil bleed model that uses the grease thickener and its associated hydrodynamic volume; i.e., the volume of the thickener particles plus the oil bound with them, to calculate oil bleed amounts of grease.4 Saatchi et al. proposed a ‘point of structural opening’ in which the thickener particles, with their associated hydrodynamic volume, are spaced far enough apart to allow open channels and oil bleed. This model fit the data for oil bleed of lithium soap, polyurea, and calcium sulfonate thickened greases. It was particularly useful for predicting the increase in bleed for calcium sulfonate thickened grease. Figure 1 shows the ASTM D6184 data for bleed rate for greases as a function of percent oil in the grease.
Figure 1 Cone bleed versus percent of oil in grease for lithium complex (blue), polyurea (red), and calcium sulfonate (green) thickened greases. Structural opening refers to the point at which channels of flow open between previously isolated pores.
Saatchi’s model depended on not only the size of the thickener particles but also their shape. Their measurements showed that lithium soap formed a fibrous structure (as was previously known), while polyurea thickeners formed plate-like structures, and calcium sulfonate formed spherical structures.
This paper builds on the work of Saatchi et al. to increase the fundamental knowledge of how grease thickener structures form. The findings in this paper shed light on how and why the thickener particles form into fibers. Further work will be extended to the formation of plates and spherical structures. Controlling the shape of the thickener particles may ultimately lead to methods that can control how the grease bleeds.
Thickeners
Grease is thickened using a number of different compounds, but generally these thickeners can be described as soap or non-soap. The soap thickeners can be simple, complex, or mixed. Soap is the metal salt of a fatty acid. The metal is usually from Group 1 (alkali metals lithium, sodium, etc.) or Group 2 (alkaline earth metals magnesium, calcium, etc.) of the periodic table. The fatty acid is a monocarboxylic acid that may contain carbon-carbon double bonds or -OH substituents and is typically from a plant and animal source. A simple soap results from the acid-base reaction of a single fatty acid and a metal hydroxide.
A complex soap results from the acid-base reaction of a single metal hydroxide with one fatty acid and a complexing agent. Complexing agents are fatty acids of different chain lengths, dicarboxylic acids, or other compounds. The addition of a complexing agent disrupts the crystallization of the soap particles, giving complex grease with higher operating temperatures than simple greases. Soap thickened grease is often referred to by the metal in the hydroxide used to make it, e.g., lithium grease for lithium metal soap thickened grease. Mixed soap grease combines soaps made from different metals to get the best properties from each of the metal soaps. Mixing lithium and calcium thickeners is a common practice. Non-soap thickeners are polymers like polyurea or polytetrafluoroethylene, inorganics like clay or silica, and others. Sulfonates as in calcium sulfonate thickener, are structurally similar to soaps in that they have a head and tail group.
Soap and detergent molecules have a similar structure consisting of a polar ionic ‘head’ group and a non-polar hydrocarbon ‘tail’. This molecular structure allows these molecules to form ‘bridges’ between polar and non-polar phases. When the thickener concentration gets large enough, the soap molecules self-assemble into micelles; this concentration is known as the critical micelle concentration (CMC). Micelles are discrete particle-like structures as opposed to a three-dimensional fibrous network structure. Nagarajan defined a packing factor to describe the structure of micelles that self-assemble in an aqueous solution.5 In water, a polar solvent, the polar heads of the molecules are hydrophilic (compatible with water), and the nonpolar tails are hydrophobic (incompatible with water).
The packing factor was based on the length of the tail and the area of the head, assuming that the hydrophobic tails point towards each other and away from the polar water solvent. Packing factors predict spherical or cylindrical micelles, or even bilayer structures. Lubricating grease is a non-aqueous system, and the self-assembly of soap thickener molecules is not so straightforward because the hydrophobic tails face outward from the micelle to interact with the non-aqueous solvent. The self-assembled soap structure is described as a reverse or inverse micelle as shown in Figure 2.
Although micelles are pictured as spherical structures, there is a continuum of structures based on the concentrations of water, oil, and surfactant (soap). This continuum includes spherical, cylindrical, lamellar, bicontinuous, inverse, and other mixed structures. Because there is a continuum of shapes associated with thickeners in oil, what shape do the thickener particles actually have in greases? How do these shapes affect grease properties?
Particle Shape Theory
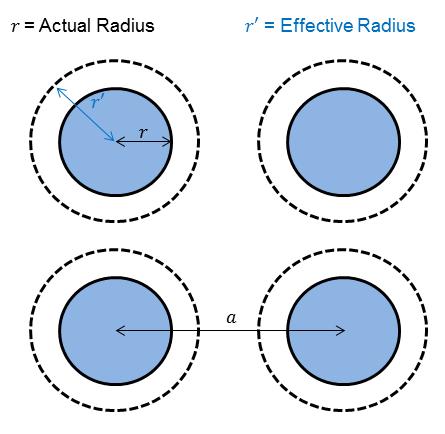
According to Saatchi et al., thickeners form cylindrical (fibrous), plate-like, or spherical structures in oil. How do these structures relate to grease bleed? As in the work by Saatchi et al., a thickener structure can be modeled as n independent spherical particles arranged in a simple cubic lattice and spaced a distance a apart. The particles have a radius of r with an associated hydrodynamic volume that increases the radius to r’ .[ ] The oil held in this hydrodynamic volume moves, within the assumptions of this model, rigidly with the particles. Oil not associated with the hydrodynamic volume is free to flow. The parameters n, a, r, and r’ have not been set yet. The structure is given in Figure 3.
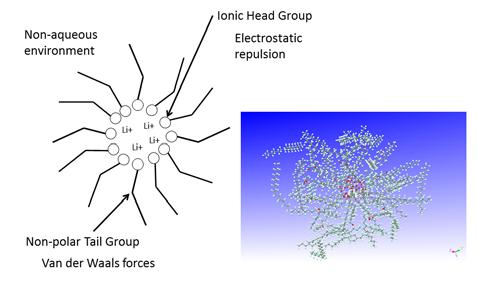
Figure 2 Stylized picture of an inverse or reverse micelle along with a 3D molecular model from a computer simulation.
Figure 3 Simple cubic lattice of spherical particles and their associated hydrodynamic volume used to develop the particle shape theory, where r is the radius of a particle, r’ is the radius of a particle with its associated hydrodynamic volume, and a is the particle separation.

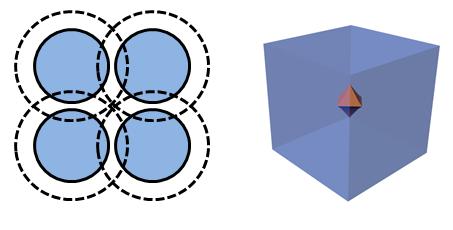
Figure 4 Particle shape theory Condition #1 with the particles touching and isolated pores. Figure 5 Particle shape theory Condition #2 with the internal pores interconnected and forming a tortuous flow path for oil flow.
Figure 6 Particle shape theory Condition #3 with the particles not touching and the fluid free to flow between them.
This model leads to three possible conditions: • Condition #1: The particles with their associated hydrodynamic volume touch, and there are no connected pores for oil flow. See Figure 4. • Condition #2: The particles move apart and some pores connect for limited oil flow. See Figure 5. • Condition #3: The particles and the associated hydrodynamic volumes do not touch and there is free flow of oil in channels. See Figure 6.

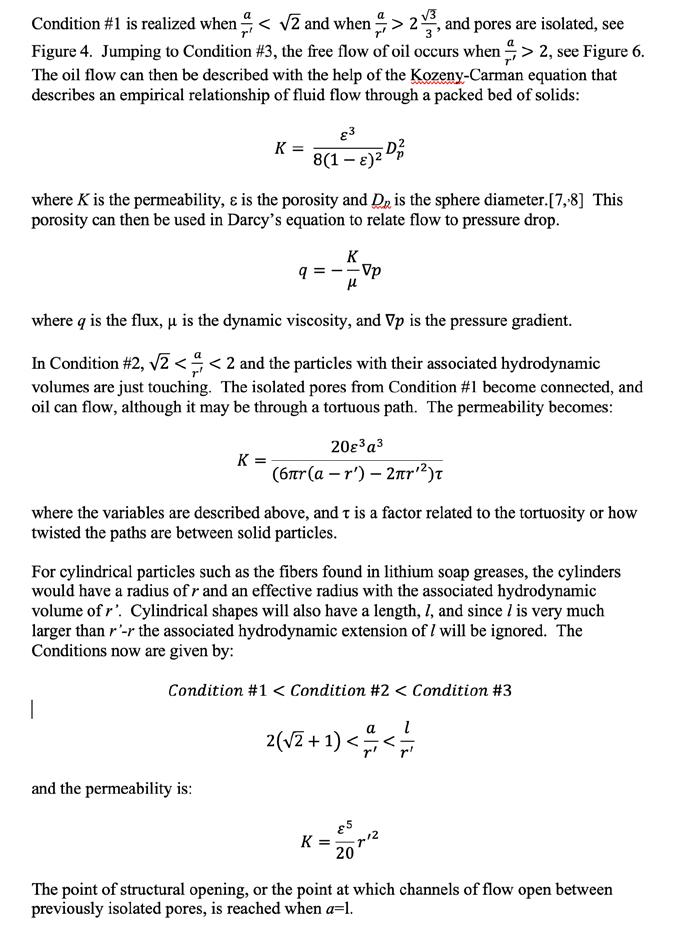
The bleed properties of grease are important in the lubrication mechanism of rolling element bearings. This is particularly important in fretting; a damage mode caused by the inability of lubricant to re-enter a contact under small amplitude sliding motion. In Figure 7, plots of the bleed rate (ASTM D6184) of three greases versus bearing wear from a Fafnir test (ASTM D4170-16) show a relation between bleed and wear.9
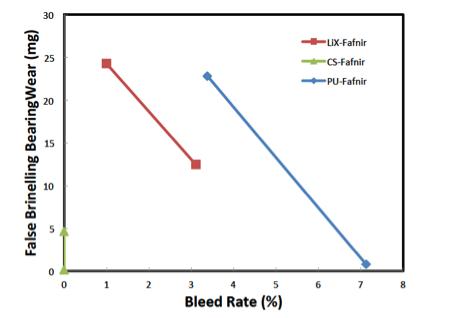
Figure 7 False brinelling wear versus bleed rate for three different greases in the Fafnir Friction Oxidation test. Results are for lithium complex (LiX, red), calcium sulfonate (CS, green) and polyurea (PU, blue) thickened greases. The bleed of oil is important in grease applications, but can the bleed be controlled? How thickener particles selfassemble into spheres, fibers, or plates is not well known. Developing a model of the self-assembly of thickener particles requires knowing first, the concentration of the thickener at which the self-assembled particles form, the CMC, and second, the energetics of the thickener particle interactions. Once the CMC is found, can the mechanism for self-assembly be found based on the energy of interaction? Is there a way to verify the structure?
Methods
Grease was manufactured in an open kettle. ISO VG 68 mineral base oil with rust and oxidation inhibiters was heated to 200 °F (93 °C) in a mixing bowl and continuously stirred. 12-hydroxystearic acid (12HSA) was added to the oil and melted. The temperature was increased to 250 °F (119 °C), and a slurry of LiOH in water was slowly added. The mixture was left to react and was considered completely reacted when all of the water was removed, as indicated by the absence of bubbles and by performing Karl Fisher titrations. The mixture was cooled slowly to room temperature. The grease formed as the mixture cooled. The amounts of 12HSA and LiOH were measured to give the required percentage of soap in the final grease. This mixture was used as made or diluted to control the final thickener concentration.
Rheological measurements were performed on a TA Instruments AR-G2 cone on plate rheometer. The cone was 40 mm in diameter with a 2° cone angle. The cone rotated against an aluminum plate that was temperature controlled using a Peltier system. An oscillating procedure was used, an appropriate choice for viscoelastic materials such as greases. The oscillating procedure was used to measure the storage, G’, and loss, G”, moduli as functions of applied stress. The storage modulus is the solid-like response and in-phase with the driving signal. The loss modulus is the viscous response and out-of-phase with the driving signal. When the storage and loss moduli cross, the nature of the material changes from either a solid-like to viscous or a viscous to solid-like material when plotted against the applied stress.
Computer models and calculations were used to study the behavior of individual thickener molecules. Computations of the interaction energies between lithium carboxylate groups were carried out using the Gaussian 03W program.[ ] Density Functional Theory (DFT) was used with a Becke, three parameter, Lee-Yang-Parr exchange correlation functional at the unrestricted level (UB3LYP). The basis sets are Poples 6-31++G(d,p) for the first two row elements and LANL2DZ for transition metals along with the corresponding LANL2DZ effective core potential. The goal for the calculations was to survey the energy surface to determine possible structures so the basis sets were not optimized for the structures. Binding energy, the energy needed to make or break a bond, was calculated as the difference in energy between the energy of a full structure and the energies of its component parts.
Infrared spectra were obtained with a Thermo-Scientific Nicolet 8700 FTIR. Samples were irradiated in the main compartment. Both the mid and far IR ranges were scanned, covering from about 100 to 4000 cm-1. A KBr beam splitter was used for the mid IR range, and a solid substrate beam splitter was used for the far IR range. The samples were placed between KBr salt plates with a 0.1 mm spacer to give quantitative results.
Rheological Results
An oscillating stress sweep experiment ranged in stress from 10 to 8000 Pa at 40 °C, with 1 Hz oscillation. The measured values were the storage modulus, G’, or the solid-like portion of the viscoelastic response, and the loss modulus, G”, or the liquid-like portion of the viscoelastic response. A typical curve is shown in Figure 8. Measured values of interest were the moduli (G’ and G”) in the plateau region, the stress at the onset point where the linear range ended, and the stress at the flow point. At the flow point, the loss modulus, G”, exceeded the storage modulus, G’, and the response of the material changed from solid-like to liquid-like. Values of stress in the plateau region will be used in subsequent rheological testing that requires the material to be in the linear viscoelastic region.
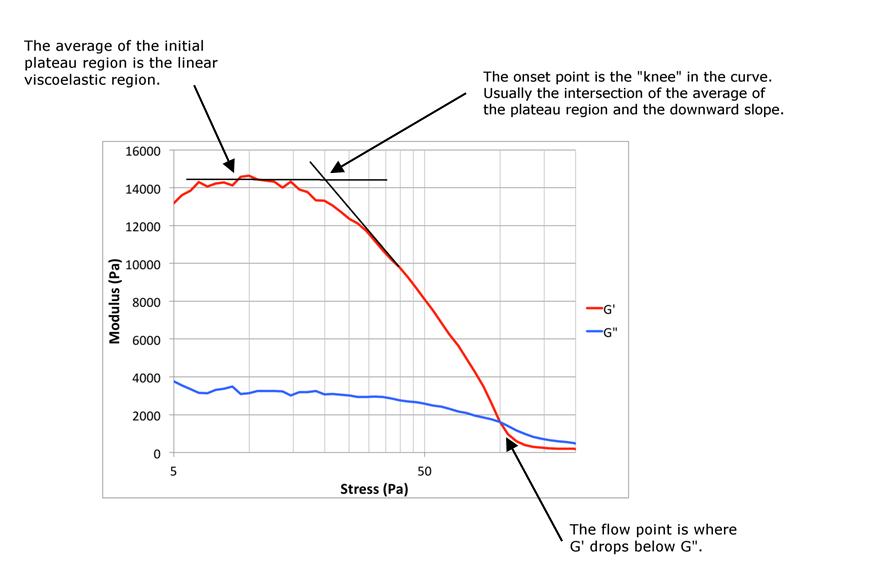
Figure 8 Typical modulus data from a cone on plate oscillating stress sweep measurement for a grease, G’ (red) is the elastic modulus and G’’ (blue) is the viscous modulus.
The measurements on the grease samples were focused on the plateau region and the relative positions of the G’ and G” traces as the concentration of thickener was changed. For a fully formed grease, the G’ trace was above the G” trace, which indicated that the material acted solid-like. Performing the same analysis on the base oil was difficult, since the base oil was a Newtonian fluid and not viscoelastic. The result was a single G” trace, and low stress indicated a viscous material. These are shown in Figure 9.
Figure 9 Oscillating stress sweep results for the fully formed grease and base oil at 40 C for comparison. The grease was diluted to 2, 4, and 5% concentrations of soap in oil for rheological testing. The measurements are shown in Figure 10. The 4% concentration showed G’ and G” with nearly equal values. With a little more soap, 5%, G’ > G” indicated a solid-like material. With a little less soap, 2%, showed G’ < G” indicating a viscous material. These results showed that the CMC was 4% soap in oil.
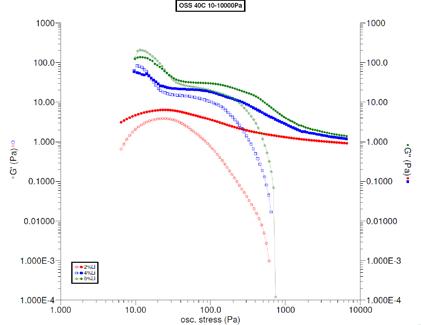
Figure 10 Oscillating stress sweep of the grease diluted to concentrations around the critical micelle concentration. Data are shown for 2 (red), 4 (blue), and 5% (green) Li-12HSA thickened in mineral oil at 40 C.
Calculation Results
The geometry of a Li-12HSA molecule was optimized to give the lowest energy, see Figure 11. Charges on the atoms were calculated using the Merz-Singh-Kollman (MK) scheme.11 The MK scheme gives charges that better fit the electrostatic potential. The binding energy of 12HSA-1 to Li+1 was 8.2 eV. The energy stored in the CO2Li atoms by electrostatic charges was calculated to be -12.15 eV. Of this, about 6 eV of electrostatic energy was in the binding of the Li atom to the COO group.

Figure 11 Geometry of a single Li-12HSA molecule from a computer model and calculations that included charges on atoms. An additional Li-12HSA molecule was added to the one calculated above to make a system of two Li-12HSA molecules. The geometry of the two molecules was optimized to give the lowest energy as above, and the charges were calculated on this geometry as shown in Figure 12. In the arrangement of two molecules with the lowest energy, the axes of the hydrocarbon tails were skewed but seemed to remain linear. The Li on the top molecule sat among 3 O atoms. The Li on the bottom molecule seemed to be in a position to interact with a third molecule, placing it in the center of three O atoms. The O-Li-O-Li chain seemed to form a circle in 3D space related to the size of the initial aggregate. Calculating the radius gave about 3.6 Å (3.6 x 10⁻¹⁰ m). The binding energy of the top Li atom to the complex was 9.9 eV. The energy of the top Li atom in this system of COO-LiCOO was about 5.7 eV and attractive. The binding energy of the top Li-12HSA to the bottom Li-12HSA was 1.3 eV.
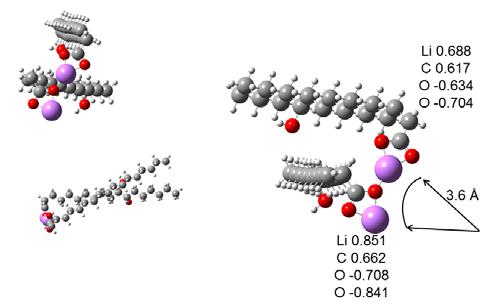
Figure 12 Geometry and charges for two Li-12HSA molecules with their tails aligned on the same side of their head groups, from computer models and calculations that minimized the energy.
In the optimizations performed above, the tail sections were positioned on the same side of the head groups. This increased the interaction between the tails. The tail-tail interaction had both an attractive and a repulsive component. The tails could also be positioned opposite from the head groups as in Figure 13. The calculated results gave a binding energy for the top Li atom to the complex that was 8.5 eV. The energy of the top Li atom in this system of COO-LiCOO was about 6.0 eV and attractive. The binding energy of the top Li-12HSA to the bottom Li-12HSA was 2.2 eV. In this configuration, the Li and O atoms were planar. The molecules could be arranged so that the Li and O atoms were not coplanar as in Figure 14. The binding energy of this configuration was -3.6 eV, indicating an unstable structure requiring energy to form.
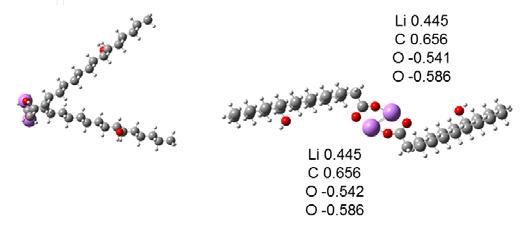
Figure 13 Geometry and charges for two Li-12HSA molecules with their tails aligned opposite from their head groups, from computer models and calculations.
Figure 14 Geometry and charges for two Li-12HSA molecules arranged with non-coplanar head groups, from computer models and calculations.

Figure 15 plots the energy of the system as a function of the configuration. As the tail was rotated from the optimized structure (where they were on the same side of the head group) to the linear planar structure (with the tails opposite the head groups), there was a jump in energy. The energy stabilized (becomes lower) as the tails separated. This indicated that the tail-tail interaction was repulsive. These interactions occur in all micelle forming molecules with an attractive end (ionic head) and a repulsive end (hydrocarbon tail) and give rise to the various shapes of micelles.
Figure 15 Energy along the y-axis plotted as a function of geometry for two Li-12HSA molecules with their tail groups rotating around their head groups. Energy is in units eV.
Infrared Spectroscopy Results
The configurations calculated above showed another arrangement of the Li and O atoms where the Li and O atoms could form a staggered formation with a -Li-O-Li-O- configuration. Or, they could form a planar structure with two Li atoms surrounded by four O atoms. It may be possible to resolve the structural issue using infrared analysis.
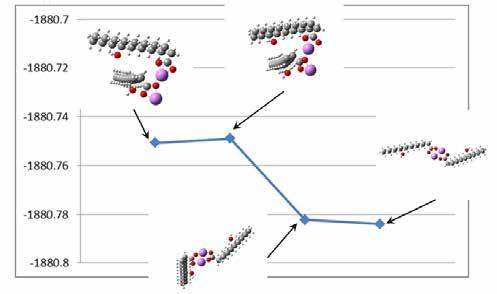
Figure 16 shows the calculated infrared spectra from about 400 to 800 cm-1. The molecules used in the calculation were Li acetate instead of Li-12HSA. The calculations were performed with tails consisting of only two carbon atoms instead of the 18 in stearic acid to reduce the computation time and to simplify the calculated infrared structure. There were 3N-6 infrared modes of vibration, so this simplification removed about 96 infrared modes that would mainly have been in the C-H and C-C region. The hydrocarbon chains had a 720 cm-1 peak in this region, which was an overtone band of the C-H bonding. The images show the vibrations that correspond to the largest peaks in the spectra and have a large Li component to the vibration.
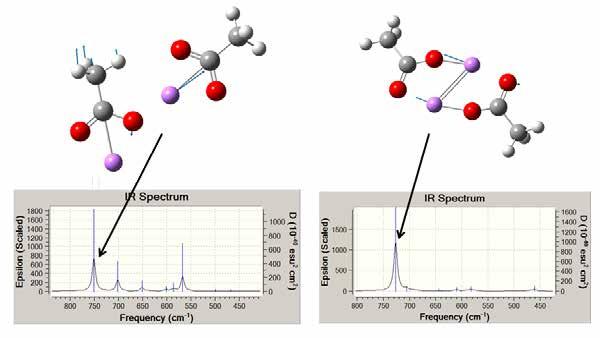
Figure 16 Calculated infrared vibration spectra and associated vibration modes for the peaks indicated. These calculations are for two Li-acetate molecules.
The spectra of 4% Li-12HSA in ISO 150 and neat ISO 150 oil were measured, overlaid, and shown in Figure 17. The spectra were obtained at 1 cm-1 resolution from 400 to 800 cm-1. The peak at 720 cm-1 was due to the C-C vibration along with CH2 and CH3 overtone vibrations in the hydrocarbon oil. The peak at 667 cm-1 was due to the CO2 bending vibration. There was virtually no difference between the experimental spectrum for the grease and the calculated spectrum for two molecules, which suggested that the initial structure in the grease was the linear planar interaction (or arrangement) and the 720 cm-1 peak, as calculated above, was buried in the hydrocarbon peak.
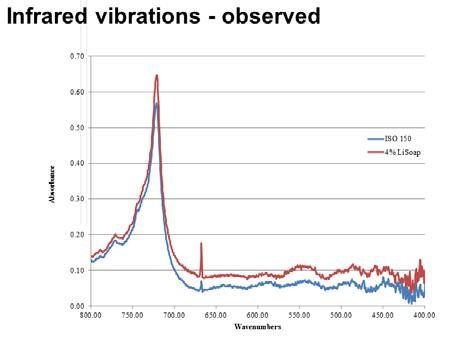
Figure 17 Experimental IR spectrum for grease thickened with 4% Li-12HSA overlaid with the base oil spectrum.
Conclusions
• A Li-12HSA soap thickened grease began to show viscoelastic properties at about 4% soap concentration in ISO VG 68 mineral oil. – At this concentration, the solid-like or storage modulus was about the same as the viscous or loss modulus. – This 4% concentration was defined as the critical micelle concentration for Li-12HSA in this mineral oil. • Interactions of two Li-12HSA molecules in several different arrangements were compared using computer models.. – In the most stable structure (lowest energy), the Li and O atoms were in a planar structure, and the tails of the molecules were on opposite sides of the head groups. – This stable structure was supported by infrared analysis. – The tails had a repulsive interaction of about 0.9 eV, which was in the range of Van der Waals forces.
References
1 Bondi, A.; Caruso, J. P.; Fraser, H. M.; Smith, J. D.; Abrams, S. T.; Cravath, A. M.; Moore, R. J.; Peterson, W. H.; Smith, A. L.; Stross, F. H.; White, E. R.; Wilson, J. N. Developments in the Field of Soda Base Greases. (1951). Proceedings of the 3rd World Petroleum Congress. World Petroleum Congress.
2 C. J. Boner, Manufacture and application of lubricating greases, (1954), New York : Reinhold Publishing Corporation.
3 J.A. Brown, C.N. Huddson, L.D. Loring, Lithium compounds—electron microscope study of lithium greases, NLGI (Natl. Lubr. Grease Inst.) Spokesman, 15 (11) (1952), p. 8.
4 Saatchi, A., Shiller, P. J., Eghtesadi, S. A., Liu, T., and Doll, G. L. A Fundamental Study of Oil Release Mechanism in Soap and Non-soap Thickened Greases. Tribology International, 110, pp 333-340.
5 R. Nagarajan, Langmuir 2002, 18, 31-38
6 F. Cyriac, P. Lugt, R. Bosman, C. Padberg, C. Venner, “Effect of Thickener Particle Geometry and Concentration on the Grease …” Tribology Letters, 2016
7 Martins, A. A.; Laranjeira, P. E.; Braga, C. H.; and Mata, T. M. Modeling of Transport Phenomena in Porous Media Using Network Models, Progress in Porous Media Research Chapter 5, (2009) Nova Science Publishers, Inc.
8 Wyllie, M. R. and Gregory, A. R. Fluid flow through unconsolidated porous aggregates: Effect of porosity and particle shape on Kozeny-Carmen constants, Industrial and Engineering Chemistry, 47, 7, (1955), 13791388.
9 ASTM Standard D4170, 2016, “Standard test method for fretting wear protection by lubricating greases,” ASTM International, West Conshohocken, PA, 2003, www.astm.org.
10 Gaussian 03, Revision E.01, M. J. Frisch, G. W. Trucks, H. B. Schlegel, G. E. Scuseria, M. A. Robb, J. R. Cheeseman, J. A. Montgomery, Jr., T. Vreven, K. N. Kudin, J. C. Burant, J. M. Millam, S. S. Iyengar, J. Tomasi, V. Barone, B. Mennucci, M. Cossi, G. Scalmani, N. Rega, G. A. Petersson, H. Nakatsuji, M. Hada, M. Ehara, K. Toyota, R. Fukuda, J. Hasegawa, M. Ishida, T. Nakajima, Y. Honda, O. Kitao, H. Nakai, M. Klene, X. Li, J. E. Knox, H. P. Hratchian, J. B. Cross, V. Bakken, C. Adamo, J. Jaramillo, R. Gomperts, R. E. Stratmann, O. Yazyev, A. J. Austin, R. Cammi, C. Pomelli, J. W. Ochterski, P. Y. Ayala, K. Morokuma, G. A. Voth, P. Salvador, J. J. Dannenberg, V. G. Zakrzewski, S. Dapprich, A. D. Daniels, M. C. Strain, O. Farkas, D. K. Malick, A. D. Rabuck, K. Raghavachari, J. B. Foresman, J. V. Ortiz, Q. Cui, A. G. Baboul, S. Clifford, J. Cioslowski, B. B. Stefanov, G. Liu, A. Liashenko, P. Piskorz, I. Komaromi, R. L. Martin, D. J. Fox, T. Keith, M. A. Al-Laham, C. Y. Peng, A. Nanayakkara, M. Challacombe, P. M. W. Gill, B. Johnson, W. Chen, M. W. Wong, C. Gonzalez, and J. A. Pople, Gaussian, Inc., Wallingford CT, 2004.
11 Singh, U. C. and Kollman, P. A. An approach to computing electrostatic charges for molecules J. Comp. Chem. 5, (1984), 129-145.
Density Functional Theory
Density functional theory or DFT is a method of computing the energy of a molecular structure. It isan ab-initio method in that the only information needed is the coordinatesand types of the atoms in the molecule.The energy is calculated by solvingSchrödinger’s equation:
where H is the Hamiltonian operator and E are the energy eigenvalues. is a wavefunction describing the positionsof the electronsin the molecule. There are two main methods of solving this equation: choose a model wavefunction (molecular orbital theory) or choose the electron density (density functional theory).
But what does the term“functional” mean? Normally we think of a function as an operation that maps one number to another; i.e. ����(����)= ����. A functional maps a set of functions to a number; i.e. {����(����)}→����. This is essentially a function of functions.
The Hamiltonian operator is simply the potential and kinetic energy operator of the electrons and nuclei of the molecule but it is the interactions of all of the particles that complicate the form. Mathematically the Hamiltonian is given by:
where the T are the kinetic energy operators of the electrons and nuclei, respectively. V are the potential energy operators of the electron –electron interactions, the nucleus –nucleus interactions, and the electron –nucleus interactions.
When constructing the Hamiltonian using the Born-Oppenheimer approximation keeps the atomic nuclei stationary so Tn is zero and Vn-n is constant. Ve-n can be considered as an external field of the nucleus charge acting on the electron. What is left, Te + Ve-e is approximated in the various DFT methods. The approximations are given by functions of the electron density, ����(���� ⃗).
In DFT,functionals are chosen that fitcalculated energies of a test set of molecules with known energies. Density functional theory uses functionals of electron density to approximate the two-electron interaction when constructing Schrödinger’s equation. Wavefunctions comprised of a linear combination of basis sets are used to solve Schrödinger’s equation based on the Kohn-Sham method to calculate the energy of a molecule given the coordinates of and types of atoms.
The most popular functional is designatedthe B3LYP functional and is popular because it gives good energy calculations in a reasonable computational time. B3LYP combines a correlation functional with an exchange functional. The B3 is a 3
parameter functional for the electron exchangedeveloped by Becke. LYP is a correlation functional developed by Lee, Yang, and Parr. There are other functionals that are used in different chemical structures and charge distributions.
In 1965 Kohn and Sham suggested an implementation of DFT to compute the energies. Their method was similar to the wavefunction method and relied on a linear combination of basis sets ��������(���� ⃗)=∑��������,������������(���� ⃗)
and a diagonalization of a matrix composed of the Hamiltonianand energy operators acting on the basis sets. Because thewavefunction method requires the calculation of electron-electron interactions but the DFT method accounts for this with the density functional sothe electron-electron interactions do not need to be calculated,it isvery much simpler.
For this project,a set of Gaussian type orbitals(GTO)were usedas the basis set and designated as 6-31++G(d,p). This shorthand notation indicates that the orbitals on a heavy atom (anything heavier than H) is composed of a group of 6 GTOs for the S orbital, twogroupsof3 GTOs and 1 GTO for the SP orbitals. The ++ adds additional P and D GTOs to polarizethe orbitals. The (d,p) adds additional D and P GTOs to create larger orbitals that diffuse the electron density. These additions are used to increase the accuracy of the calculated energy.
Joint ELGI / NLGI Working Group Position Paper
Regarding the selection and usage of Food Safe Lubricants
Q&A and making the right choices for food grade lubricants
DOWNLOAD HERE
About the European Lubricating Grease Institute (ELGI) & NLGI The main objective of both organisations is to promote the understanding of all matters concerning Lubricating Grease and it’s associate products, to disseminate information that can lead to the development of both better products for the consumer and also to provide improved lubrication services to the industry. In addition, the two organisations facilitate the exchange of information concerning design, manufacture and use, handling and sale of Lubricating Grease between all interested organisations and individuals. Both organisations are not‐for‐profit technical institutes, funded by it’s members primarily composed of grease manufactures and marketers, raw material and equipment suppliers, end users and other technical and trade associated bodies.
One way that some of these objectives are met is through active working groups between both organisations. Both institutes work continuously to strengthen their association with the industry by rendering services to the end user as well as those on the manufacturing and supply side. Food Grade Lubricants Working Group (FGLWG) Food lubricants are among the most crucial products in the food chain; small volumes with high impact. As food safety is more and more in the centre of the news, we as an industry must continue to react and be proactive. It is in the industries interest to cooperate with decision makers to define and meet global standards. The Food Grade Lubricants Work Group is the platform where future developments on standards and legislation are reviewed.
In this paper, the reference to the food industry include, food, beverage preparation & filling, animal feed and foods, personal care products and the pharmaceutical industry. This can be extended to cover any production facility that wishes to operate in or supply to the food chain, for example a mineral preparation company supplying to the food supplement sector. For simplicity throughout, reference is made to the food industry.
The ELGI & NLGI supports the concerns of the FGLWG members position paper on the selection and usage of food safe lubricants. and underwrites the attached Terry Dicken David Como Andre Adam Aslee Breitner ELGI Chairman NLGI President FGLWG Chairperson FGLWG Chairperson All interested parties are encouraged to distribute affected party. this document as a whole to any interested or
Page 1 of 4


