
6 minute read
Adapting to a changing climate

by NIWA_NZ


PLANNING FOR CLIMATE CHANGE
Advertisement
• High-resolution projections of climate and ocean state • Increased understanding of the impacts of climate change • Guidance and tools to support better planning for climate change
IMPROVING RESILIENCE TO NATURAL HAZARDS
• 24/7 multi-hazard forecasting system • Enhanced tools and guidance to help mitigate weather and climate hazard impacts • Work with international partners to advance weather, climate and hazard forecasting
REDUCING ADVERSE EFFECTS OF CLIMATE CHANGE
• Hydrological models to inform changes in water flows and storage • Predict the effects of sea-level rise on coastal ecosystems and infrastructure • Increase understanding of the effects of ocean acidification on ecosystems, including in Antarctica
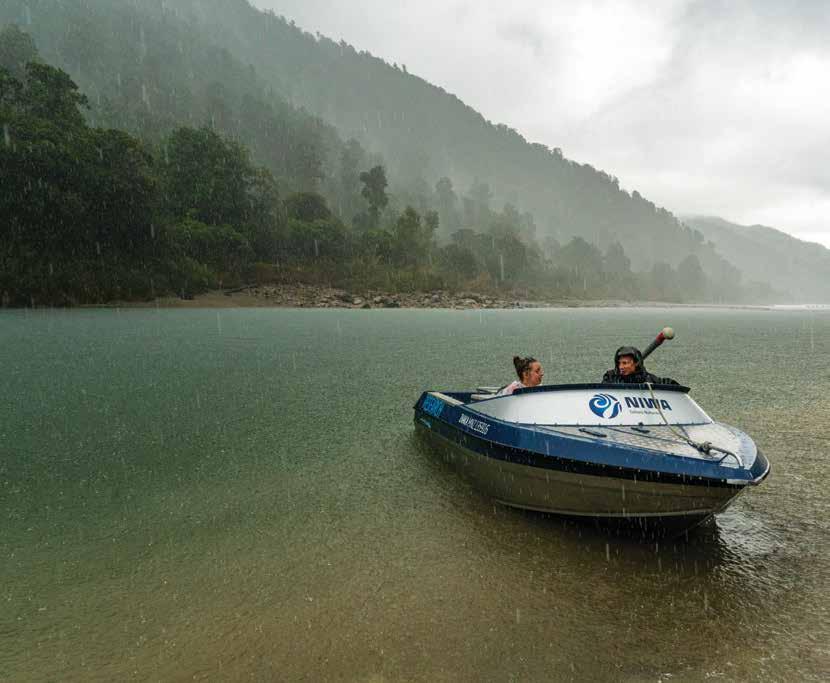
NIWA environmental monitoring technician Michael O’Driscoll (right) at the NIWA and West Coast Regional Council river gauges, which form part of the Westport Early Flood Warning System. [Stuart Mackay]
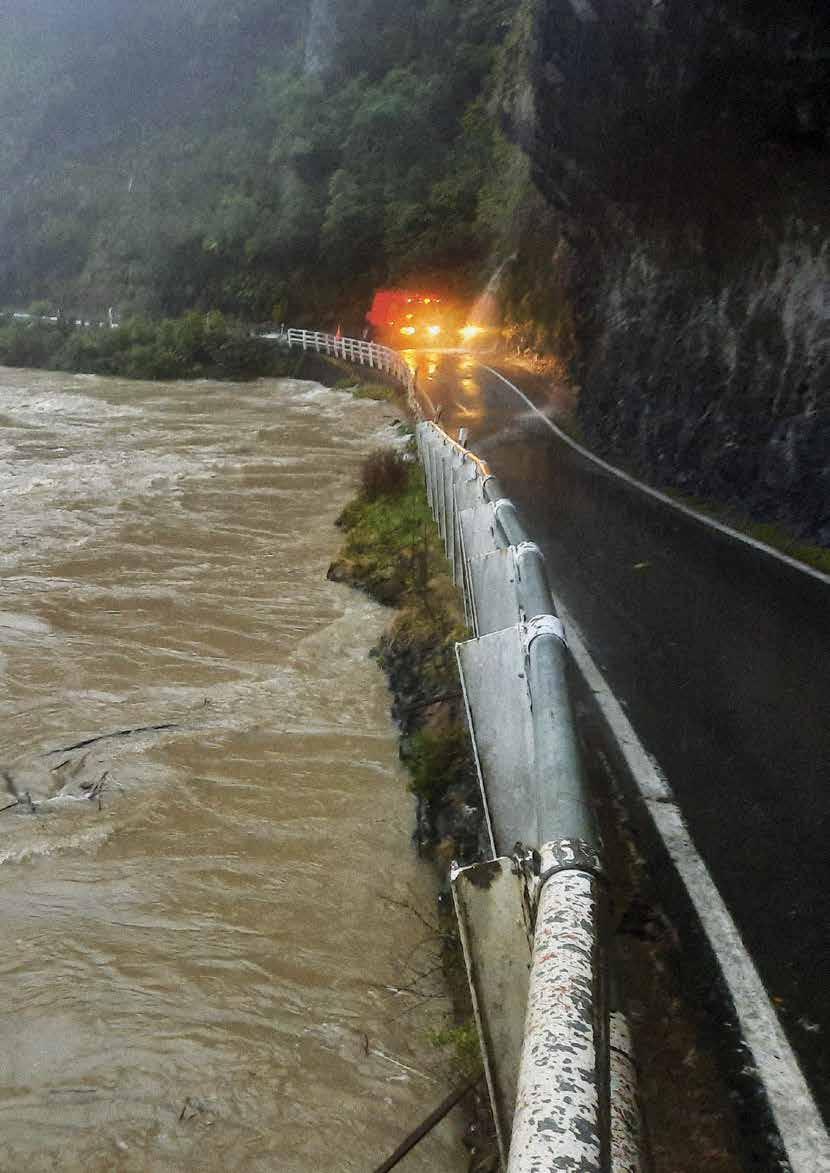
West Coast flood forecasting put to the test again
After a record-breaking flood devastated Westport when the Buller River broke its banks in July 2021, the region was hit by another deluge in August 2022. NIWA has been working with the West Coast Regional Council since just before the 2021 event to develop a dedicated flood forecasting system. While the team wasn’t expecting the system to be put through its paces again so soon, once again it proved an invaluable information source to help emergency responders make decisions to keep people safe. The system is underpinned by NIWA’s river flow forecasting tool and surface water flow model, which the research team is fine tuning for the West Coast region by updating the flood flow model for Buller and developing inundation scenarios. Strong relationships between NIWA and the council mean we can provide detailed flood, sea-level and wave forecasts as soon as heavy rain is predicted. The project is funded by Kānoa – the MBIE regional Economic Development & Investment Unit, under the Infrastructure Reference Group funding, to enhance economic development opportunities in regional New Zealand. As our climate changes, we expect storm systems to become more frequent and more severe. Science can’t stop it raining, but it can help communities prepare for the worst and plan for the future – and that’s just what the flood forecasting system for the West Coast is doing.
Will marine heatwaves become a permanent fixture?
New Zealand could experience very long and very severe marine heatwaves, with analysis indicating an 80–100% increase by the end of the century under a high CO2-emission scenario. New research by NIWA ocean modellers has shown that the impact of climate change means that what is now an intense marine heatwave scenario will start to become the norm. Marine heatwaves will accelerate the impacts of warming both at sea and on land. These include a reduced nutrient supply and a reduction in phytoplankton, a shift in the distribution of marine organisms towards Antarctica and into deeper water, and marine organisms adapted to warmer waters expanding their range into New Zealand waters. They will affect the fishing and aquaculture industries – warming seas have already negatively affected mussel and salmon farms. Our modelling has been carried out using three emission scenarios, ranging from low emissions (the best-case scenario) to high emissions (the worst-case scenario). It has also shown substantial disparities between regions, with some coastal areas experiencing much more severe impacts. This regional assessment is possible because the high-resolution ocean grid in the New Zealand Earth System Model, developed by NIWA scientists as part of the Deep South National Science Challenge, allows us to differentiate between the regions.
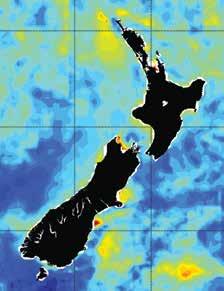
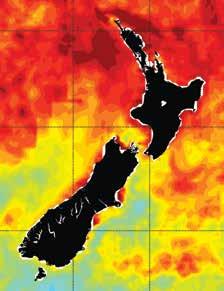
The intensity of marine heatwaves in present-day conditions (left) compared with the potential intensity in 2100 (right). [NIWA]
How is climate change affecting Antarctica?
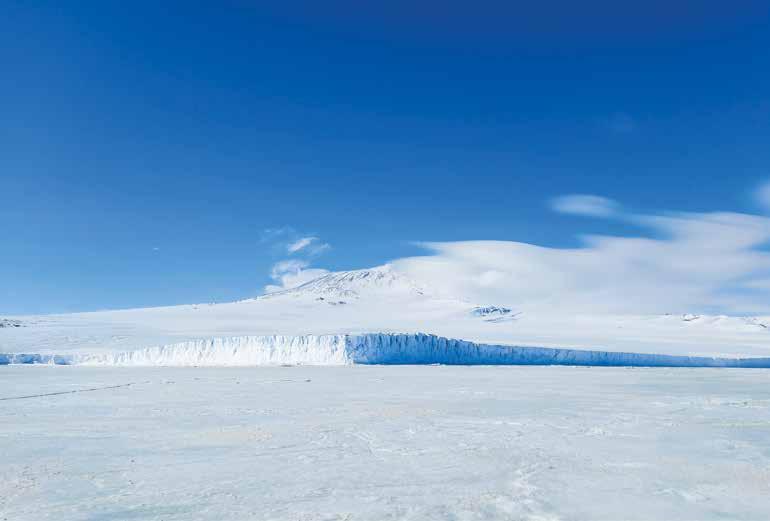
The Ross Ice Shelf – the world’s largest – is the floating southern boundary of the Ross Sea, and lies almost due south of New Zealand. Ice shelves play an important role, because they apply backwards pressure on the glaciers that feed them, acting as “brakes”. But when they warm up, this brake eases and more ice slides off the land and into the water, increasing sea levels and changing the Southern Ocean’s delicate ecosystem. NIWA scientists, with their New Zealand and international colleagues, are working to piece together what is happening in the Ross Sea and the Ross Ice Shelf, and how they might be impacted by climate change. Using a combination of radar technology, ocean instruments and float information, the researchers have been able to determine ice thickness, melt rates and the impacts on the water below. This information helps us simulate the impact on the ice shelves, so we can better predict the implications of the warming climate on the shelves and sea level. The team on the ice in January 2022 were also able to detect changes following the dramatic eruption of the Tonga volcano, Hunga Tonga–Hunga Ha’apai, as the tsunami generated by the eruption made its way through one of the ice cavities they were monitoring – an important reminder that our whole world is very much interconnected.
Nestled into the ice are radar units transmitting hourly data on ice-shelf thickness back to New Zealand every hour for more than a year via satellite, giving a real-time map of the melting rates from 12 sites. [Craig Stewart] The Barne Glacier, which flows down from Mount Erebus, is one of the glaciers that feeds into the Ross Ice Shelf. [Natalie Robinson]


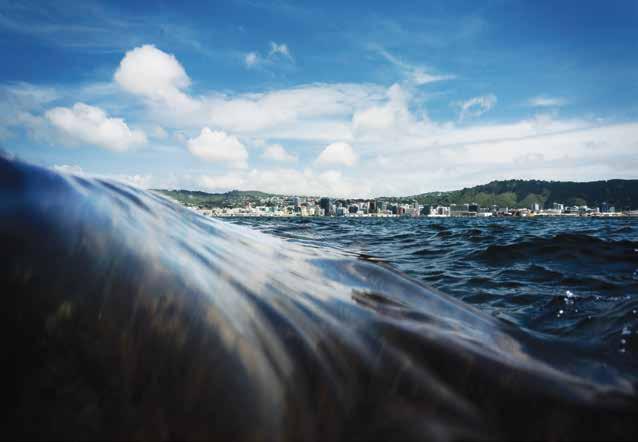
Wellington. [Dave Allen]
Digital twin of Wellington to model climate change
NIWA is working with Wellington City Council to visualise climate change and its consequences as part of a US$1 million ‘Digital Twin’ project. Wellington was one of just 15 cities worldwide selected from 631 applications. The project, funded by the Bloomberg Philanthropies’ Mayors Challenge, is designed to spark innovative and replicable ideas for improving cities and the lives of people living in them. NIWA coastal and social scientists are contributing coastal modelling, coastal engineering and social science methodology to the project, which will be completed in 2025. When completed, the Digital Twin will be accessible through your digital device and through community facilities such as libraries. The code of the model will be open source, so others can use it and develop it further. A virtual reality 3D visualisation will bring to life the science, data and hypothetical scenarios for climate change. Interactive maps will allow people to see what the Wellington coastline could look like in the future – for example, how will roads, buildings or coastlines be affected by different increases in sea-level rise?
A mock-up of one of the 3D maps from the Digital Twin project, showing the Wellington waterfront and central city.


