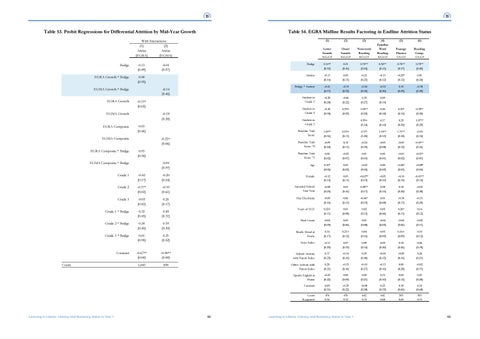
Table 53. Probit Regressions for Differential Attrition by Mid-Year Growth
Table 54. EGRA Midline Results Factoring in Endline Attrition Status (1)
(2)
(3)
(5)
(6)
Non-word Reading KG-G3
(4) Familiar Word Reading KG-G3
Letter Sounds KG-G2
Onset Sounds KG-G2
Passage Fluency G1-G3
Reading Comp. G1-G3
Bridge
2.14** (0.32)
0.21 (0.16)
0.75** (0.24)
0.55** (0.13)
0.75** (0.17)
0.72** (0.20)
Attritor
-0.13 (0.14)
0.05 (0.13)
-0.21 (0.23)
-0.13 (0.12)
-0.25* (0.12)
0.01 (0.24)
Bridge * Attritor
-0.41 (0.37)
-0.19 (0.22)
-0.44 (0.30)
-0.12 (0.20)
0.10 (0.29)
-0.38 (0.29)
Student in Grade 1
-0.28 (0.28)
-0.06 (0.22)
0.39 (0.27)
0.09 (0.14)
Student in Grade 2
-0.18 (0.38)
0.39+ (0.22)
1.05** (0.22)
0.26 (0.18)
0.30* (0.15)
0.78** (0.20)
0.59+ (0.34)
0.17 (0.14)
0.29 (0.20)
1.07** (0.29)
With Interactions (1) (2) Attrite Attrite (EGRA) (EGMA) Bridge
0.13 (0.49)
EGRA Growth * Bridge
0.00 (0.95)
EGMA Growth * Bridge EGRA Growth
-0.14 (0.46) -0.13* (0.02)
EGMA Growth EGRA Composite
-0.18 (0.20)
Student in Grade 3
0.03 (0.46)
EGMA Composite EGRA Composite * Bridge
-0.01 (0.97)
Baseline Task Score
1.45** (0.36)
0.19+ (0.11)
2.37* (1.05)
1.34** (0.12)
1.73** (0.18)
-0.10 (0.34)
Baseline Task Score ^2
-0.09 (0.18)
0.12 (0.11)
-0.24 (0.39)
-0.03 (0.08)
-0.03 (0.12)
0.43** (0.16)
Baseline Task Score ^3
0.00 (0.02)
-0.05 (0.07)
0.01 (0.03)
0.00 (0.01)
-0.01 (0.02)
-0.03* (0.01)
-0.01 (0.97)
Age
0.10* (0.05)
0.03 (0.02)
-0.02 (0.04)
0.00 (0.02)
-0.06* (0.03)
-0.08* (0.04)
-0.22+ (0.06) 0.03 (0.58)
EGMA Composite * Bridge Grade 1
-0.42 (0.17)
-0.20 (0.54)
Female
-0.12 (0.14)
0.03 (0.11)
-0.62** (0.19)
-0.05 (0.10)
-0.10 (0.10)
-0.43** (0.14)
Grade 2
-0.37* (0.02)
-0.10 (0.61)
Attended School Last Year
-0.08 (0.25)
0.01 (0.16)
0.48** (0.17)
0.08 (0.15)
0.18 (0.20)
-0.02 (0.28)
Grade 3
-0.03 (0.82)
0.26 (0.17)
Has Electricity
-0.05 (0.16)
0.06 (0.13)
-0.46* (0.19)
0.01 (0.08)
-0.18 (0.13)
-0.33 (0.20)
Grade 1 * Bridge
0.32 (0.45)
0.49 (0.31)
Years of ECE
0.22+ (0.11)
0.01 (0.08)
0.02 (0.12)
0.05 (0.06)
0.26* (0.11)
0.14 (0.12)
Grade 2 * Bridge
0.24 (0.40)
0.39 (0.30)
Meal Count
-0.04 (0.09)
0.03 (0.06)
0.01 (0.08)
-0.04 (0.05)
-0.04 (0.06)
-0.02 (0.11)
Grade 3 * Bridge
0.01 (0.98)
0.21 (0.52)
Reads Aloud at Home
0.16 (0.17)
0.21+ (0.12)
0.04 (0.16)
0.05 (0.09)
0.16+ (0.09)
0.10 (0.12)
Asset Index
-0.11 (0.29)
0.07 (0.19)
0.09 (0.34)
0.09 (0.20)
0.18 (0.26)
0.06 (0.39)
-0.67** (0.00)
-0.90** (0.00)
School Activity with Parent Index
0.37 (0.25)
-0.14 (0.16)
0.29 (0.40)
-0.04 (0.12)
-0.09 (0.16)
0.26 (0.21)
1,043
690
Other Activity with Parent Index
0.20 (0.21)
-0.15 (0.16)
-0.10 (0.27)
-0.13 (0.16)
0.00 (0.28)
-0.02 (0.37)
Speaks English at Home
-0.22 (0.22)
0.05 (0.09)
0.02 (0.21)
0.14 (0.10)
0.05 (0.12)
0.23 (0.20)
Constant
-0.81 (0.51)
-0.29 (0.22)
-0.08 (0.58)
0.25 (0.39)
0.18 (0.60)
0.10 (0.68)
Count R-squared
476 0.54
476 0.12
642 0.34
642 0.68
503 0.65
503 0.33
Constant Count
Learning in Liberia: Literacy and Numeracy Gains in Year 1
92
Learning in Liberia: Literacy and Numeracy Gains in Year 1
93