Experiment 1A: Starting Point for Plot Aggregation Experiment 1 / Iteration 1
Iteration 1 / Population 0 49
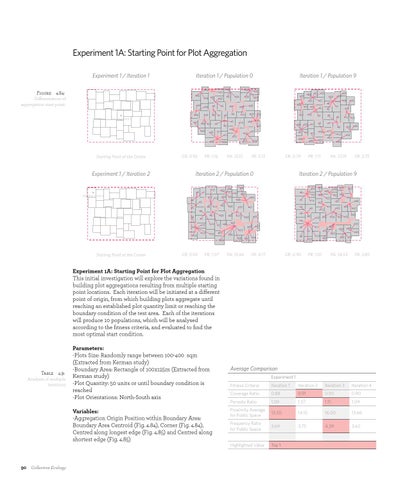
Figure*4.84: Differentation of aggregation start point.
45
39
33
38
9
46
34
8
47
40 37
44
Starting Point 1
43
2
CR: 0.92
Experiment 1 / Iteration 2
5
7
6 11
12
PR: 1.16
30
21
17
13
24
23
PA: 12.15
0 4 5 6 16 19
13
1
FR: 3.13
2 8
33
22
11
28
35
9
7 15 17
14
20
27
21 25
18
23
PR: 1.07
31
37
38
34 38
PA: 15.66
3
45
35
12
16
9
15
13
42
45
41
PA: 13.19
41
40
21
29
14
FR: 3.75
8
47
7 6
44
FR: 4.17
CR: 0.90
16
23
PR: 1.10
46 34
25
18 20
15 12
44
27
19
11
5
47
37
33
22
13 10
48
39
35
17
9
4
43
40
6
11
PR: 1.11
2
29
26
36
1
41 39
1
43
14
Iteration 2 / Population 9
46
36
2 0
10
0
42
7
4
31 25 19
44 40
8
3
17
22
34
26
5
18
CR: 0.79
3
24
CR: 0.93
37
30
10 12
20
49
48
32
24
27
22
10
36
25
18
14
32 21
23 28
19
15
33
39
29
30 20
16 4
0
32
28
Iteration 2 / Population 0
Starting Point 2
Starting Point at the Corner
26
3
1
35
42
27
29
41
Starting Point at the Centre
48
31
Iteration 1 / Population 9
42 43
31 32
45 26
36 49
24 30
28
PA: 14.53
38
FR: 3.85
Experiment 1A: Starting Point for Plot Aggregation This initial investigation will explore the variations found in building plot aggregations resulting from multiple starting point locations. Each iteration will be initiated at a different point of origin, from which building plots aggregate until reaching an established plot quantity limit or reaching the boundary condition of the test area. Each of the iterations will produce 10 populations, which will be analysed according to the fitness criteria, and evaluated to find the most optimal start condition.
Table*4.9: Analysis of multiple iterations
Parameters: -Plots Size: Randomly range between 100-400 sqm (Extracted from Kerman study) -Boundary Area: Rectangle of 100x125m (Extracted from Kerman study) -Plot Quantity: 50 units or until boundary condition is reached -Plot Orientations: North-South axis Variables: -Aggregation Origin Position within Boundary Area: Boundary Area Centroid (Fig. 4.84), Corner (Fig. 4.84), Centred along longest edge (Fig. 4.85) and Centred along shortest edge (Fig. 4.85)
90!Collective Ecology
Average Comparison Experiment 1 Fitness Criteria
Iteration 1
Iteration 2
Iteration 3
Iteration 4
Coverage Ratio
0.88
0.91
0.90
0.90
Porosity Ratio
1.09
1.07
1.11
1.09
Proximity Average for Public Space
13.50
14.15
16.00
13.66
Frequency Ratio for Public Space
3.69
3.75
4.39
3.62
Highlighted Value
Top 1