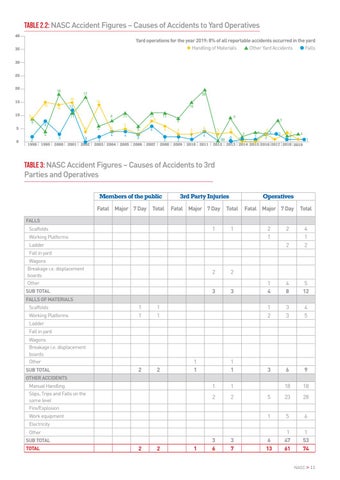
Table 2.2: NASC Accident Figures – Causes of Accidents to Yard Operatives 40
Yard operations for the year 2019: 8% of all reportable accidents occurred in the yard u Handling of Materials s Other Yard Accidents l Falls
35 30 25 20
18
15 10
15
20 14
11
4 2 1998
8
8
5
1999
4 3 2000
15
12
14
9 9
0
17 15
0 2001
2002
6
4 4
2 2003 2004
11 5 4 2005
11 8
11
6
5
6
3 2006
9
9
2 2008
2007
3 2 2009
4
3 1
4
2010 2011
7
4
3
3
4 3 4 3 3 1 0 1 1 1 00 0 1 0 2012 2013 2014 2015 2016 2017 2018 2019 2
1
4
3
Table 3: NASC Accident Figures – Causes of Accidents to 3rd Parties and Operatives Members of the public Fatal Major 7 Day
Total
3rd Party Injuries Fatal Major 7 Day
Operatives
Total
Fatal Major 7 Day
Total
1
2 1
2
4 1 2
1 4
4 8
5 12
1 2
3 3
4 5
3
6
9
18
18
5
23
28
1
5
6
6 13
1 47 61
1 53 74
FALLS
1
Scaffolds Working Platforms Ladder
2
Fall in yard Wagons Breakage i.e. displacement boards Other SUB TOTAL
2
2
3
3
FALLS OF MATERIALS Scaffolds Working Platforms
1 1
1 1
Ladder Fall in yard Wagons Breakage i.e. displacement boards Other SUB TOTAL
2
2
1 1
1 1
OTHER ACCIDENTS Manual Handling Slips, Trips and Falls on the same level Fire/Explosion
1
1
2
2
Work equipment Electricity Other SUB TOTAL TOTAL
2
2
1
3 6
3 7
NASC > 11