March / April 2023
Sensor-Controlled Sprayers for Specialty Crop Production

Research Updates on Integrated Pest Management for Citrus Mealybug in California Citrus
Pulling the Trigger for the Start of Irrigation in the Spring: Too Much Too Soon for Walnuts?
Volume 8: Issue 2
WALNUT BLIGHT IS EVIL


STOP ITS SPREAD BEFORE IT’S TOO LATE

When walnut blight strikes, it can ravage your yields. KASUMIN® bactericide is proven to be effective against walnut blight — including copper-resistant strains. As the only member of FRAC Group 24, its unique mode of action makes it a smart addition to resistance management strategies. And, with its rainfast properties and locally systemic activity, it’s the go-to choice for keeping walnut blight from rearing its ugly head. To learn more about the UPL portfolio of trusted solutions for tree nuts, talk to your local UPL representative or visit UPLTreeNutPortfolio.com.


Always read and follow label directions. KASUMIN is a registered trademark of Hokko Chemical Industry Co., Ltd. The KASUMIN logo, UPL, the UPL logo and OpenAg are trademarks of a UPL Corporation Limited Group Company. ©2023 UPL Corporation Limited Group Company. KASM-2301 KASUMIN® BACTERICIDE UPLTREENUTPORTFOLIO.COM SMART SOLUTIONS FROM PREPLANT TO POSTHARVEST.
PUBLISHER: Jason Scott
Email: jason@jcsmarketinginc.com

EDITOR: Taylor Chalstrom
ASSOCIATE EDITOR: Cecilia Parsons
Email: article@jcsmarketinginc.com
PRODUCTION: design@jcsmarketinginc.com
Phone: 559.352.4456
Fax: 559.472.3113
Web: www.progressivecrop.com
CONTRIBUTING WRITERS & INDUSTRY SUPPORT
8 24
Sensor-Controlled Sprayers for Specialty Crop Production Research Updates on Integrated Pest Management for Citrus Mealybug in California Citrus
14
4 26
20 30
Pulling the Trigger for the Start of Irrigation in the Spring: Too Much Too Soon for Walnuts?
Alternative Nitrogen Management Strategies for California Rice Systems
Phosphate vs Phosphite: (Part Two) Can Phosphites Serve the Function of a Biostimulant?
Understanding and Leveraging the Nitrogen Cycle for Informed
Almond Fertility DecisionMaking
Foliar Fertilization of Grapevines: What We Know and Don’t Know
8 20 30
Kari Arnold
UCCE Orchard and Vineyard Advisor, Stanislaus County
Matt Comrey Technical Nutrition
Agronomist, Wilbur-Ellis Agribusiness
Karla Cornelio Graduate Student Researcher, UC Davis
Allan Fulton UCCE Soil and Water Advisor, Emeritus
Sandipa Gautam,Ph.D., UCCE Farm Advisor, Butte, Glenn and Tehama Counties
Bruce Lampinen UCCE Specialist, UC Davis
JW Lemons
CCA, CPAg, Verdesian Life Sciences
Bruce Linquist UCCE Rice Specialist
Luke Milliron UCCE Orchard Advisor, Butte, Glenn and Tehama Counties
Telha Rehman Graduate Student Researcher, UC Davis
Ken Shackel Plant Sciences Department, UC Davis
Brent Warneke Faculty Research Assistant, Department of Horticulture, Oregon State University
Surendra Dara Director, North Willamette Research and Extension Center
Kevin Day UCCE Pomology Farm Advisor, Tulare and Kings Counties
Elizabeth Fichtner UCCE Farm Advisor, Kings and Tulare Counties
Katherine Jarvis-Shean UCCE Orchard Systems Advisor, Sacramento, Solano and Yolo Counties
Steven Koike Tri-Cal Diagnostics
Jhalendra Rijal UCCE Integrated Pest Management Advisor, Stanislaus County
Mohammad Yaghmour UCCE Area Orchard Systems Advisor, Kern County
The articles, research, industry updates, company profiles, and advertisements in this publication are the professional opinions of writers and advertisers. Progressive Crop Consultant does not assume any responsibility for the opinions given in the publication.

March / April 2023 www.progressivecrop.com 3
IN THIS ISSUE
UC COOPERATIVE EXTENSION ADVISORY BOARD
Sensor-Controlled Sprayers for Specialty Crop Production
By BRENT WARNEKE
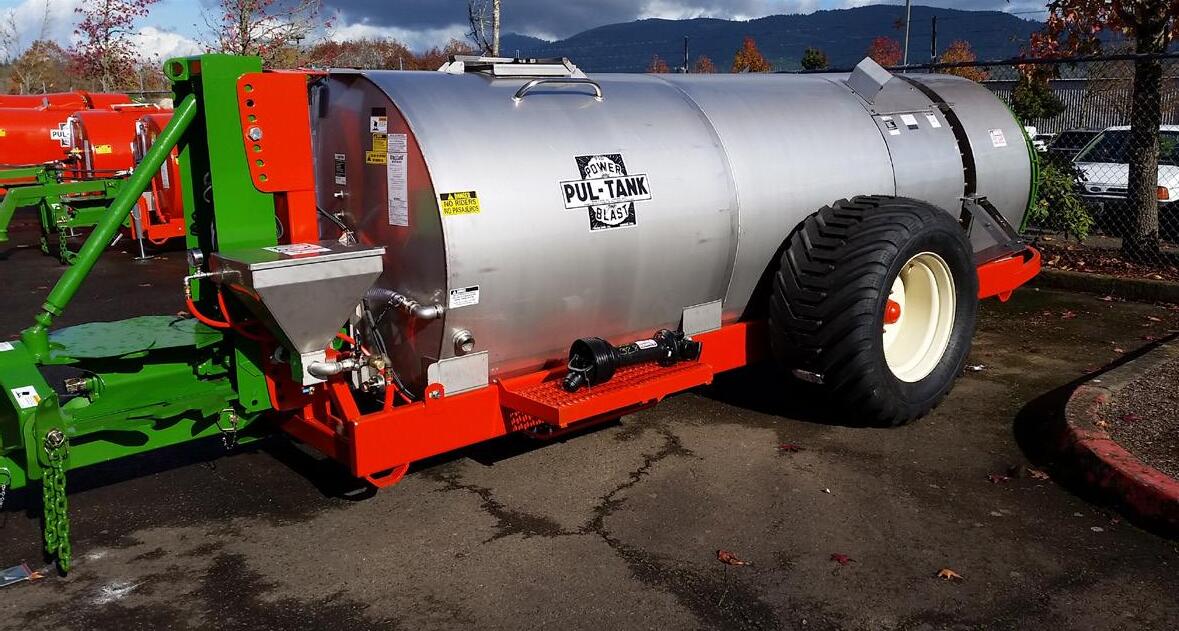
Many of the pesticide application technologies used in specialty crop production today are based on axial fan air-blast sprayers (Figure 1). Air-blast sprayers were first developed in the 1950s when orchard trees were 20 feet tall or more; today orchard trees of many crops are 7 to 13 feet tall. Air-blast sprayers are versatile and reliable and can be modified to fit numerous types of crops. Despite their popularity, standard axial fan air-blast sprayers have long had a reputation for inefficient application characteristics. For example, spray landing on the ground from radial air-blast sprayers can be from 20% to 40% of total applied spray volume. To improve application efficiency, sensor-controlled spray systems were designed in the 1980s as a way to reduce labor costs and pesticide waste. Sensor-controlled spray systems are receiving renewed interest as their reliability has improved and more options have become available.
Sensor Sprayer Types
There are two main types of sensor sprayers:
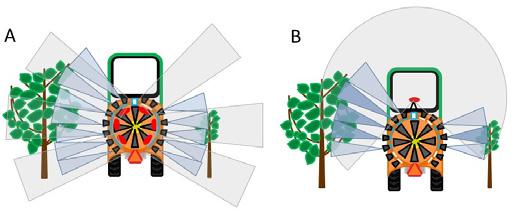
• On/off sensor sprayers operate by automatically turning on individual nozzles or sections of nozzles on the spray boom when plants are sensed. Likewise, when no object is sensed,
the spray will be turned off (Figure 2a).
• Crop-adapting sprayers are similar in that the sensor is used to turn the sprayer on and off as it passes by plants. However, they go a step further by adjusting application volume, air volume or a combination of those two (Figure 2b).
Sensor controlled sprayers typically have an override where the user can bypass the sensor system and spray as they would with a standard sprayer if, for example, the sensor components of the sprayer are not working.
Sensors
Crop sensing systems are the “eyes” of the sprayer and determine crop shape
by emitting and receiving signals. There are four basic sensor types used in sensor sprayers: infrared, ultrasonic, plant fluorescence and LiDAR. Each one of these sensors emit their own specific signal aimed at the plants that then bounce off the plants and return to the sensor. Some sensor types require multiple sensors to resolve plant structure characteristics.
Infrared (IR) sensors detect IR signals reflected from the plants and can be used in on/off sensor sprayers. Humidity and temperature do not interfere with IR sensing accuracy. However, low light conditions such as during dawn and dusk can interfere with an IR sensor. IR sensors are unable to accurately resolve
4 Progressive Crop Consultant March / April 2023
ContinuedonPage6
| Faculty Research Assistant, Department of Horticulture, Oregon State University
Figure 1. A classic axial fan air-blast sprayer (photo by B. Warneke.)
Figure 2. Illustration of on/off sensor sprayers (a) and canopy-adapting sensor sprayers (b). Sensors are illustrated with small red ovals and sensor field of view illustrated with grey shaded areas (illustration by B. Warneke.)
UNTOUCHED


THAT’S HOW CITRUS FEELS
WITH MOVENTO.®


The same Movento® insecticide that manages red scale and nematodes also protects against Asian citrus psyllids, which can cause a devastating and fatal disease, Huanglongbing. With its unique two-way movement upward and downward, Movento provides allover protection for high-quality fruit and long-term tree health.


For more information, contact your retailer or Bayer representative or visit www.Movento.us.


ALWAYS READ AND FOLLOW PESTICIDE LABEL DIRECTIONS. The distribution, sale, or use of an unregistered pesticide is a violation of federal and/or state law and is strictly prohibited. Check with your local dealer or representative for the product registration status in your state. Bayer, Bayer Cross, and Movento ® are registered trademarks of Bayer Group. For additional product information, call toll-free 1-866-99-BAYER (1-866-992-2937) or visit our website at www.BayerCropScience.us. Bayer CropScience LP, 800 North Lindbergh Boulevard, St. Louis, MO 63167. ©2023 Bayer Group. All rights reserved.
plant structure. IR sensors are usually used in canopy spraying to trigger the release of spray from the whole side of a boom when a plant canopy is detected. These systems can also be used for herbicide sprayers. In that case, sensors are aimed at the plant trunks and turn off the sprayer as they pass the trunk, or they can trigger spray directly at the trunk to specifically target suckers.
Ultrasonic sensors emit high-frequency sound waves to measure objects. This process is similar to how bats and dolphins use echolocation to navigate and search for food. When arranged in an array (usually three sensors per side of the sprayer), ultrasonic sensors can detect objects with approximately 4-inch resolution. This allows for calculation of canopy volume with similar accuracy to taking manual measurements. Despite their ability to resolve plant structures, ultrasonic sensors are usually used in on/off sensor sprayers. The initial patents on ultrasonic sensors have expired, so continued off-patent development has improved their quality and capability while reducing costs. Comparatively, ultrasonic sensors are more expensive than IR sensors but less expensive than laser sensors.
Plant fluorescence sensors emit a beam of visible light and detect the light reflected back to the sensor from the plant. These sensors have a spatial resolution of about 4 square inches and can detect a plant area as small as 0.40 square inches. Plant fluorescence sensors can collect plant structure data while in the field that can be stored and used for further planning. These sensors are typically used on “weed-seeing” herbicide sprayers to detect green weed tissue contrasted with the soil surface. They have also been integrated into on/off sensor-controlled canopy sprayers to trigger the spray when a green canopy is sensed.
Laser sensors used to characterize plants are termed LiDAR (light detection and ranging) sensors. These sensors have a laser beam that is directed in an arc around the sensor by a spinning mirror inside the sensor housing. The laser beam is then reflected by any surface
it hits, relaying distance and structure information to the sensor. Compared to other sensors, LiDAR most accurately measures crop structure, with resolution to several hundreths of an inch. This gives LiDAR sensors the capability of being used for other tasks while spraying, such as measuring canopy vigor. LiDAR sensors are typically used on crop-adapting sensor sprayers, where only one sensor is needed for each sprayer. These sensors are the most expensive of those listed.
One other sensor is needed for sensor-controlled canopy sprayers. Currently, retrofitted sensor spraying systems are not directly connected to the speedometer on the tractor, so a separate speed sensor is needed to convey the sprayer ground speed to the sensor system. A few examples of speed sensor types used are wheel bolt sensors and radar sensors that use Doppler technology. Maintaining accurate speed detection is critical to ensure spray is released on target.
Sensor Sprayer Efficacy and Efficiency
Insect and disease control with sensor-controlled sprayers has been shown to be similar to that of standard sprayers. Using a LiDAR-based variable rate sprayer has resulted in equivalent control of insect pests, such as codling moth, oriental fruit moth and spotted wing drosophila, to that of an air-blast

sprayer. Diseases such as powdery mildew, apple scab, brown rot, anthracnose and mummy berry have also been controlled equal to that of an air-blast sprayer. Ultrasonic sensor-controlled systems have resulted in similar control to standard sprayers on difficult-to-control pests such as apple rust mite and pear psylla and diseases such as apple scab and apple powdery mildew. The amount of spray saved when using sensor sprayers varies, but generally, spray volume savings in the range of 20% to 70% can be seen depending on the sensor system used and the crop. Higher savings typically correspond to more precise sensors such as LiDAR in crops with more variable canopies, while lower-volume savings occur with less precise sensors and less variable crops.
There are a host of other benefits of sensor sprayers beyond spray volume savings. Each spray tank goes further so less time is spent spraying, decreasing the need to refill the sprayer and thus saving on labor. A reduction in the number of sprayer fill-ups required leads to less fuel costs and water savings in addition to a lower amount of wear on the tractor. When spray operations can be completed quicker, it can also make it easier to fit sprays into critical application windows.
Environmental Benefits of Using Sensor Sprayers
Spray drift is greatly reduced with
6 Progressive Crop Consultant March / April 2023
ContinuedfromPage4
Figure 3. The Hol Spraying Systems/AgXeed autonomous sprayer and robot. This unit is equipped with plant fluorescence sensors (photo by Amanda Dooney.)
sensor-controlled sprayers. Some studies have shown 23% to 45% of the applied pesticide volume can drift off target using standard air-blast sprayers in orchards. Ultrasonic sensor systems can reduce ground deposition by 70% compared to a standard air-blast sprayer in orchards. Canopy-adapting sprayers can be even more effective at reducing drift in orchards, in one study by 70% to 100% compared to a standard air-blast sprayer depending on the tree growth stage. Lower chemical load on non-target locations also helps decrease the rate of development of pesticide resistance. Other considerations include less pesticide contamination of surface and groundwater and lower chances of exposure on non-target organisms such as beneficial insect populations and livestock.
One Step Further: Autonomous
Sensor-Controlled Air-Blast Sprayers
Sensor-controlled sprayers help increase spray application efficiency, but there still needs to be an educated applicator driving the tractor and operating the sprayer. Agricultural labor has become less reliable and more expensive, so some manufacturers are producing autonomous sprayers that can be monitored remotely during a spray process. Global Unmanned Spray Systems (GUSS), Jacto and Hol Spraying Systems, in partnership with AgXeed (Figure 3, see page 6), are three manufacturers that are making fully autonomous self-propelled sprayers for specialty crop production. All three manufacturers are integrating sensors onto the autonomous sprayers to do variable rate spraying. Autonomous sprayers offer lower labor requirements and more efficiency than manned sprayer applications and represent the future of spraying in spe cialty crops.
This work was provided in part by the US DA-ARS Integration of Intelligent Spray Tech nology into IPM Programs in Specialty Crop Production (Project Number 58-5082-2-010).
Resources
Warneke, B. W., Zhu, H., Nackley, L. L., Pscheidt, J. W.(2020) ‘Canopy spray application technology in specialty
crops: a slowly evolving landscape’, Pest Management Science, 77(5), pp. 2157–2164. doi: 10.1002/ps.6167.
Nackley, L. L., Warneke, B., Fessler, L., Pscheidt, J. W., Lockwood, D., Wright, W. C., Sun, X., Fulcher, A. (2021) ‘Variable-rate Spray Technology Optimizes Pesticide Application by Adjusting for Seasonal Shifts in Deciduous Perennial Crops’, HortTechnology, 31(4), pp. 479–489. doi: 10.21273/horttech04794-21.
Giles, D. K., Klassen, P., Niederholzer, F., Downey, D. (2011) ‘“Smart” sprayer
technology provides environmental and economic benefits in California orchards’, California Agriculture, 65(2), pp. 85–89. doi: 10.3733/ca.v065n02p85.
Chen, L., Wallhead, M., Reding, M., Horst, L., Zhu, H. (2020) ‘Control of Insect Pests and Diseases in an Ohio Fruit Farm with a Laser-guided Intelligent Sprayer’, HortTechnology, 30(2), pp. 168–175. doi: 10.21273/horttech04497-19.
Comments about this article? We want to hear from you. Feel free to email us at article@jcsmarketinginc.com
Provides Calcium and Chitin from Crab, complexed with amino acids from fish.
Pacific Gro helps growers improve soil health and improve nutrient uptake for better crop performance.

Crop resilience against disease and pest pressure can be achieved with a biological program and balanced nutrition.
March / April 2023 www.progressivecrop.com 7
www pacificgro com 503-867-4849
Research Updates on Integrated Pest Management for Citrus Mealybug in California Citrus
By SANDIPA GAUTAM, PH.D., | Area Citrus IPM Advisor, Fresno, Madera, Tulare and Kern Counties
Citrus mealybug infestations continue to increase in the San Joaquin Valley (SJV) making this species an emerging concern for citrus growers. Although known to be present in California for more than 50 years, it was kept in check by natural enemies (Ebeling 1959) and was not a pest of concern until recently. As such, citrus mealybug is an understudied pest in California citrus systems, and little is known about its biology and field ecology, monitoring and threshold, and control options, making management challenging. In 2022, we initiated research studies to improve knowledge about field ecology, monitoring and management of mealybug in SJV citrus.
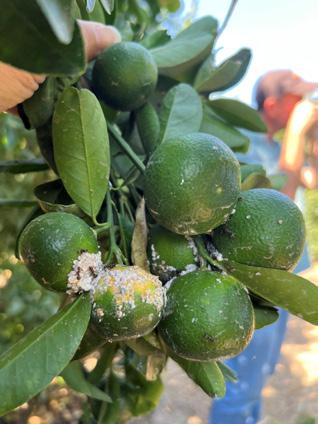
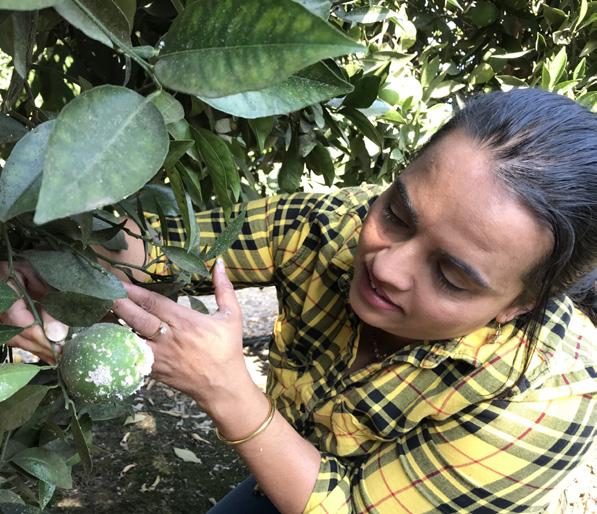
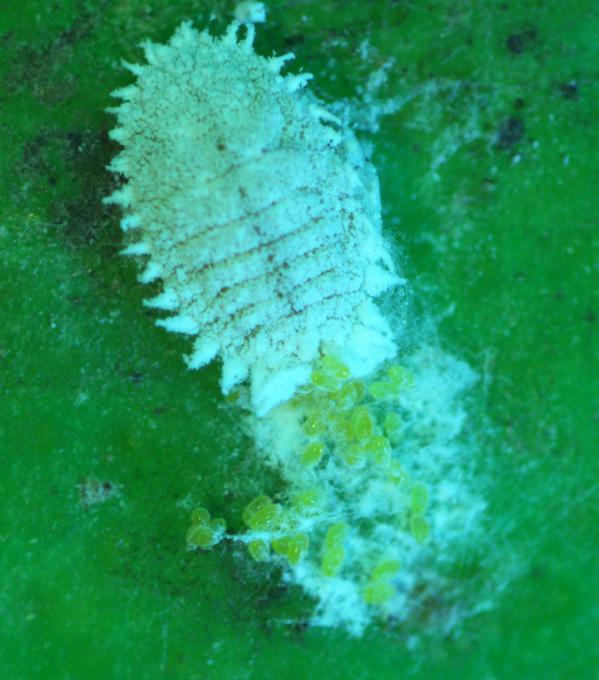
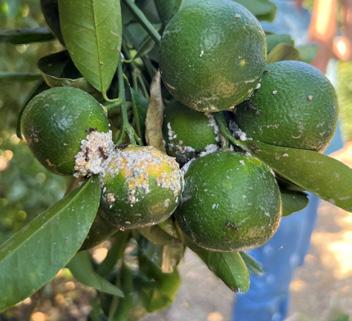
Citrus mealybug, Planococcus citri, is a soft-bodied, oval, flat and distinctly segmented insect covered with white mealy wax (Figure 1). This small polyphagous sap-sucking insect prefers to live in between fruit clusters or under the thick leaf canopy, therefore avoiding detection when population is low. Infestation causes chlorosis, leaf drop and stunted growth, while direct feeding damage results in tissue discoloration around feeding spots, fruit deformity and contamination of foliage and fruit with honeydew and sooty mold (Figure 2), resulting in loss of yield and marketability of fruit.
Adult female citrus mealybugs are ~3 millimeters long and have distinctly segmented bodies covered with white mealy wax. A female can lay up to 600 eggs in a lifetime, in a group of 5 to 20, deposited and protected within cottony ovisacs (Figure 1). These eggs hatch in 3 to 10 days depending on temperature and crawlers disperse to different parts of the plant looking for feeding sites. All life stages are mobile, and they spread by crawling from tree to tree, carried by ants, blown by wind and picked up by birds, machinery or labor crews. Immatures and adult females feed on leaves and fruits. Males have wings, are short-lived and do not feed.
Field Ecology for Monitoring
Citrus mealybug overwinters as eggs or crawlers in protected areas of the tree including fruit. Greenhouse research has shown eight complete generations in one year (Myers 1932). To gen-
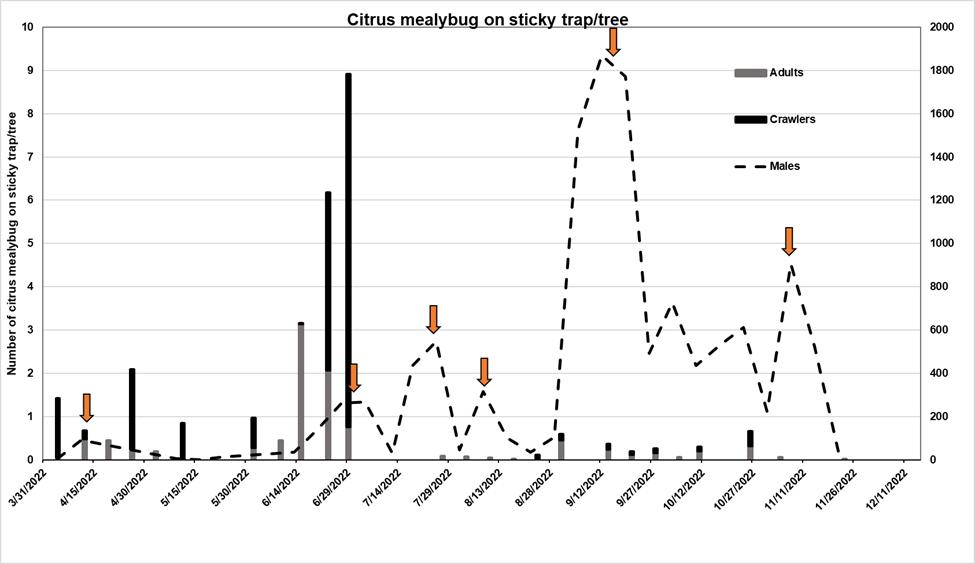
erate information on seasonal activity and the number of generations in the SJV, we monitored citrus mealybug in 13 trees in a block known to have mealybug infestations in 2021. Double-sided sticky tapes were wrapped around the trunk and four main inner branches. Traps were replaced weekly, and the number of mealybugs caught on the traps was counted every week. In addition, males were monitored using a pheromone trap.
We found that mealybugs were present within the tree canopy throughout the season, but the areas where they aggre-
8 Progressive Crop Consultant March / April 2023
ContinuedonPage10
Figure 1. Adult female citrus mealybug showing amber-colored eggs. Note the distinctly segmented body with a vertical line through the mid-section, a characteristic feature of citrus mealybug (photo by S. Gautam.)
Figure 2. Navel orange infested with citrus mealybug. Infestations are usually found protected under the thick canopy of leaves. Also note the sooty mold on leaves (photo by David Haviland, UCCE.)

March / April 2023 www.progressivecrop.com 9 Agriculture in this region is unlik else, and successful growers nee plan that meet s the unique goa and challenges we face. Get pre the advanced product s and agr knowledge you need to suppor t crops, your soil and a sustainab Sure -K® and Kalibrate® are registered trademarks of AgroLiquid © 2023 AgroLiquid. All Rights Reser ved. Find an AgroLiquid dealer near ApplyLessExpectMore.co Apply less, expect more?
ContinuedfromPage8
gated changed as the season progressed. Overwintering eggs/crawlers serve as an inoculum for a new season. The first-generation activity starts in March as eggs hatch and crawlers move from the overwintering sites (cracks and crevices on trunk, leaves protected under thick canopy, fruit or from the ground) to new leaves and then to fruit. When fruit is present, most of the infestation
SEVIN, PROVEN PEST MANAGEMENT

was found on fruit. Males caught on the trap card showed six distinct peaks that preceded the crawler emergence, suggesting six complete generations of mealybug in the valley (Figure 3). This seasonal occurrence pattern can be used to scout for mealybug.
January to March: fruits or leaves. Mealybugs like protected areas. Check inside the tree canopy, fruit (navels and under the calyces) or leaves (underside)
for overwintering adults, egg sacs and crawlers. Presence of sooty mold and white mealy wax is an indicator (Figure 2, see page 8).
April to June: crawlers emerge and start moving into new flush or fruit. Egg masses, crawlers on the trunk and inner branches.
July to December: on fruit, feed and multiply. Overlapping generations can be present.
Monitoring can also be done by using a pheromone lure and traps. Place lure and traps by March 15, before the first-generation activity starts and monitor throughout the season. If you catch males on trap, scout trees for infestation and make pesticide applications when needed.
Management Options
Citrus mealybug is naturally regulated by natural enemies and predaceous insects. But recent outbreaks suggest that this ecological balance is shift-
This proven formulation is a key component in your IPM, Integrated Pest Management Program. Sevin works fast to knock out pests and minimizes damage from continued feeding.
10 Progressive Crop Consultant March / April 2023
Always read and follow label instructions. NovaSource® and Sevin® are registered trademarks of Tessenderlo Kerley, Inc. ©2023 Tessenderlo Kerley, Inc. All rights reserved.
Figure 3. Citrus mealybug population in a citrus block. Adult and crawlers on sticky tape trap count (left Y axis) overlayed on mealybug males/trap (right Y axis). Flight peaks at the arrowheads suggests a new generation.
OF
OF PESTS
BROAD SPECTRUM CONTROL
DOZENS
INSECTICIDE LONGER RESIDUAL
1A Label novasource.com Call: 800-525-2803
CONTROL
ing. Although very little is known about mealybug management in citrus systems, incorporating cultural, biological and chemical tools is encouraged as researchers continue to study the seasonal occurrence, efficacy and timing of pesticide applications for improved management.
Cultural control
Female and nymphal mealybugs are wingless and spread to new areas by humans, equipment, wind or birds. Sanitize equipment before moving to new areas of the grove. Pruning to open tree canopy and hedging trees to prevent canopy overlap will help slow the crawler movement and increase natural enemy activities
Biological control
Several natural enemies are identified as effective biocontrol agents for controlling mealybug (Grafton-Cardwell et al. 2021).
Mealybug destroyer, Cryptolemus montrouzieri, is known to be a highly effective predator and is most effective when population pressure is high. This predator does not survive cold winters. It is readily available from commercial suppliers and can be released in orchards where mealybug was a problem in the previous year.
Anagyrus spp. and Coccidoxenoides have been found in mealybugs collected from the SJV, suggesting natural infestations. Future research will investigate presence of natural enemies and their impact on mealybug.
Chemical control
Although UC IPM guidelines have only one product recommended for mealybug control in citrus systems, several insecticides are recommended for controlling mealybug in grapes, pistachios and greenhouses (Haviland et al. 2019). Different species of mealybug may respond differently to insecticide ap-
plications. Moreover, different seasonal phenology of pests in separate cropping systems warrants crop-specific pesticide efficacy trials. Two field trials conducted in summer 2022 showed that one application significantly reduced mealybug infestation but did not provide longterm solution (Gautam 2022). If your block was infested, plan on an early season control, targeting the first-generation crawlers in late March/early April. Monitor populations and make a second application using a different group of insecticides within two weeks of the first application, targeting the newly hatched crawlers. Continue monitoring and use mealybug-effective materials.
Pheromone lure is not available as a management choice but is available for monitoring.
Other Factors
Natural enemies are relatively more susceptible to broad-spectrum insecticides
March / April 2023 www.progressivecrop.com 11
Contact us to see how we can help! (559)584-7695 or visit us as www.superiorsoil.com Serving California since 1983 ContinuedonPage12
such as organophosphates, carbamates, pyrethroids and neonicotinoids in groves with mealybug infestations, so reduce/ limit the use of these chemicals. Spirote tramat is relatively non-toxic to mealy bug destroyers (Grafton-Cardwell 2021).
Ant control: ants help in mealybug dispersion within the tree canopy and between trees and groves. They also defend mealybug colonies from natural enemies (Figure 4 control methods.
Prevent the spread of mealybug by in forming the pruning/harvesting crew.
Strip and dispose of the fruit infested with mealybug as fruits may harbor mealybug for next season’s infestation.
Talk to neighboring growers about this threat.
The University of California and Fresno State University researchers are working on a citrus research board-funded proj
ect to improve knowledge on biology, seasonal phenology and management of citrus mealybug. Stay informed on research outcomes by participating in
Myers, L.E. Two Economic Greenhouse , Volume 25, Issue 4, 1 August 1932, Pages 891–896, doi.
Comments about this article? We want to hear from you. Feel free to email us at article@jcsmarketinginc.com
Helping Farmers Grow NATURALLY Since 1974


 Hembree K.J., Ingels C.A., WunderlichUC IPM Pest Manage. UC ANR Publica-
O ce: 559-686-3833 Fax: 5 59-686-1453 2904 E. Oakdale Ave. | Tulare, CA 93274 newerafarmservice .com
Figure 4. Citrus mealybug infestation in mandarin. Note the colonies at the cluster, bleached feeding spots and deformed fruit surface. Also note ants attending mealybugs (photo by S. Gautam.)
ContinuedfromPage11
+11-39% YIELD INCREASE ANNUALS*

* DATA ON FILE. Important: Always read and follow label use directions. All TM/R © 2023 Verdesian Life Sciences. All rights reserved. VLS 22.0636 800-868-6446 | VLSCI.COM The Nutrient Use Efficiency People.® Advisors’ When it comes to Nutrient Use Efficiency for California crops, there’s only one alpha. Don’t let your growers leave nutrient use efficiency to chance. PrimacyALPHA® works inside the plant to stimulate the efficient assimilation and utilization of nutrients that result in healthier crops and higher yields. Proven on a wide variety of crops, primacyALPHA also delivers key secondary nutrients that helps optimize flowering, fruit size and fruit set. Make the recommendation you can be confident in –make it primacyALPHA. +9 -22% YIELD INCREASE ORCHARDS*
Pulling the Trigger for the Start of Irrigation in the Spring: Too Much Too Soon for Walnuts?
By KEN SHACKEL
| Plant Sciences Department, UC Davis, ALLAN FULTON | UCCE Soil and Water Advisor, Emeritus, KARI ARNOLD | UCCE Orchard and Vineyard Advisor, Stanislaus County,
BRUCE LAMPINEN| UCCE Specialist, UC Davis, and LUKE MILLIRON | UCCE Orchard Advisor, Butte, Glenn and Tehama Counties
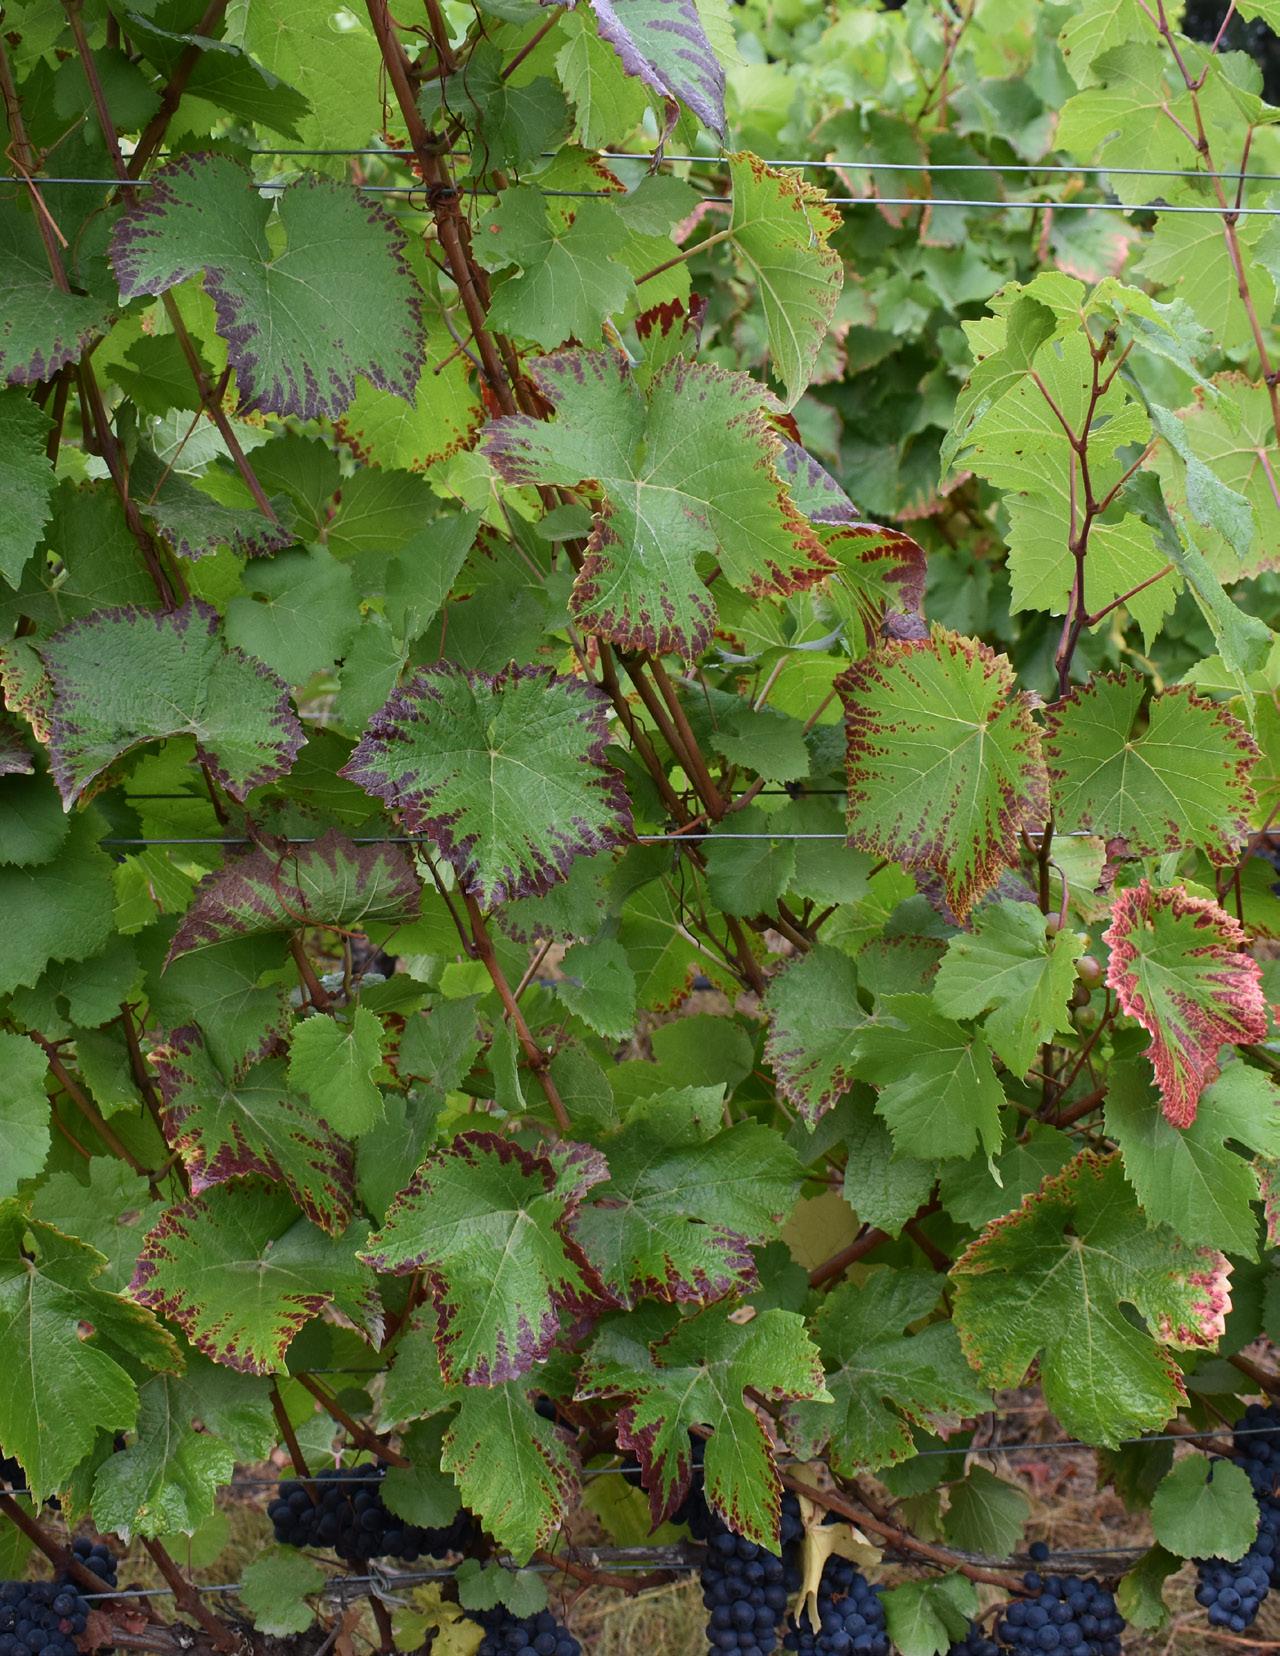
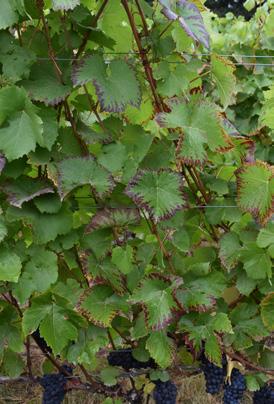
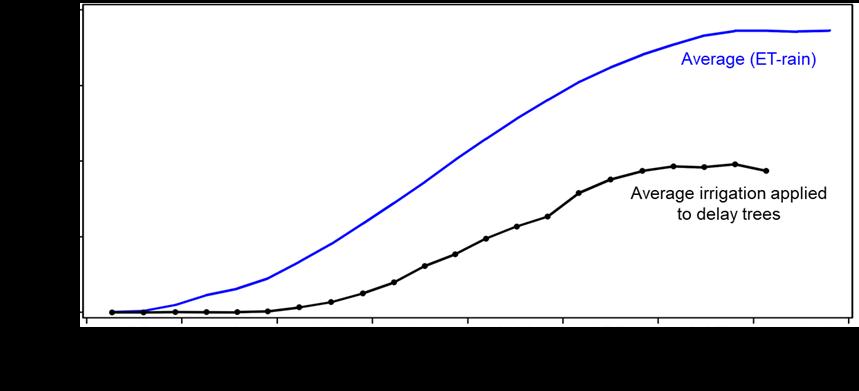
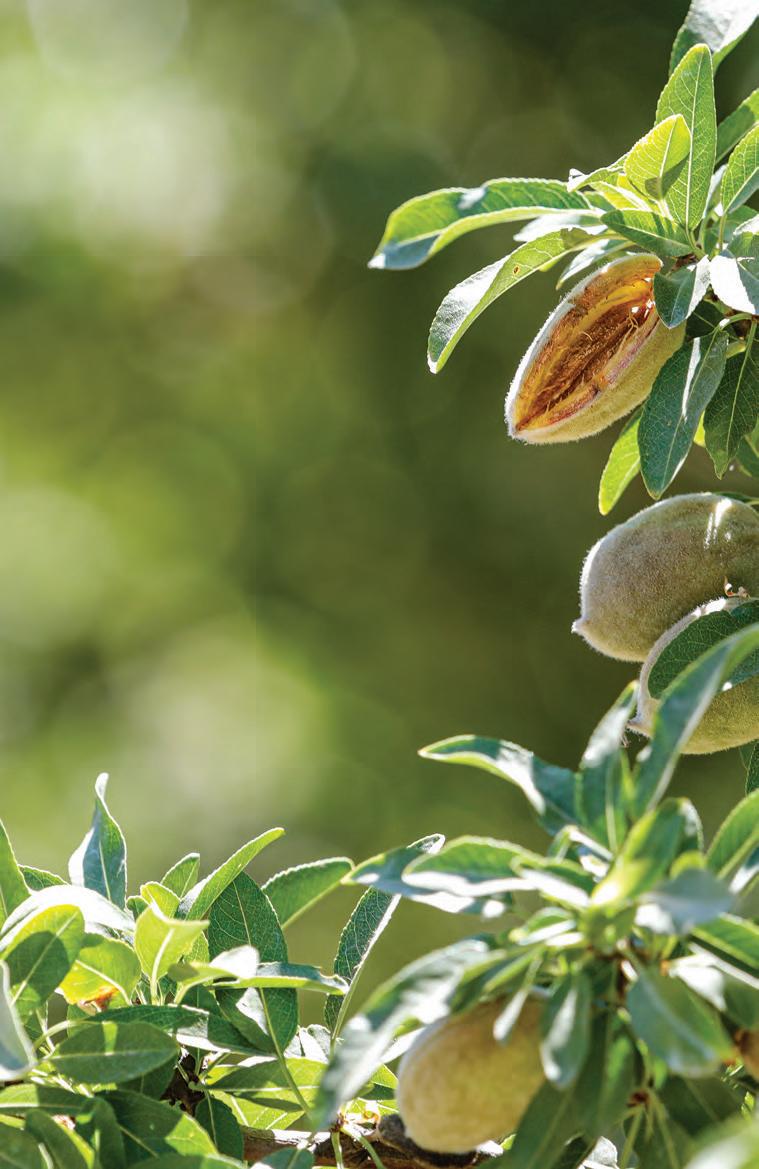
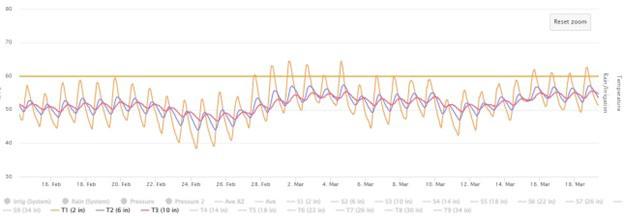
Walnuts are generally regarded as very sensitive to water stress. Severe stress and defoliation can occur when irrigation is reduced in the summer or discontinued entirely for harvest. Since walnuts depend on stored soil moisture during this time, growers were historically advised to start irrigation early in the spring to save deep soil moisture ‘in the bank’ for use later in the season. However, research findings in a Red Bluff, Calif. walnut orchard have seriously challenged this conventional wisdom. In fact, trees that were given an early start of irrigation (late April) showed more water stress at harvest than trees that were given a delayed start of irrigation (late May/early June). Surprisingly, this occurred even though the delayed start trees received substantially less water (about 28 inches throughout the growing season) than the early start trees (about 38 inches). The Red Bluff orchard is on a deep siltloam/fine sandy-loam soil. However, similar results are being found in one Stanislaus County orchard on heavier clay soil and one orchard in western Tehama County on stratified soils with gravelly subsoils and much lower water holding capacity.
Using the Right Tool
In many commercial orchards, in-season tree water stress is monitored by
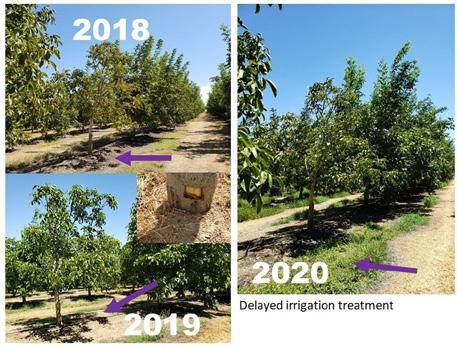
Figure 1. An ailing tree at the Stanislaus site in 2018 showed signs of deterioration. Although the trunk was somewhat sunken at the soil line and necrosis was forming under the bark (center photo), samples were collected multiple times, but no Phytophthora spp. were isolated/found. This tree happened to be included in the delayed irrigation treatment and during the passing of three years appears to be recovering, specifically showing greater shade under the tree canopy at midday since the beginning of the trial in 2018 (photos by K. Arnold.)
irrigation for all delayed irrigation tests to date
Daily
values
orchard water requirements were calculated beginning on April 1 based on current walnut crop coefficients, for each site and year, and averaged. Irrigation applied to all delayed treatments for each site and year were averaged for 10-day periods over the same seasons.
14 Progressive Crop Consultant March / April 2023
ContinuedonPage16
Figure 2. Summary of average orchard water requirement (ET-rain) and applied
(2014-20).
CIMIS
for
As sweet a s can be
Capturing Maximum Genetic Potential


measuring midday stem water potential (SWP) using a pressure chamber (a.k.a. “pressure bomb,” see sacvalleyorchards. com/manuals). This same tool could be used, specifically, to decide when to start irrigation in the spring with the appropriate information on this subject. As a starting point, there is a reference level of SWP that is expected for a fully irrigated (non-stressed) walnut tree, which is called the “baseline” SWP. For more information about baseline SWP and how to obtain this value for a particular location, day and time, we suggest the following websites:
Baseline and advanced interpretation explained: sacvalleyorchards.com/manuals/stem-water-potential/using-baseline-swp-for-precise-interpretation/
Baseline values calculated for you at: informatics.plantsciences.ucdavis.edu/ brooke_jacobs/index.php
Using the Tool to Trigger the Start of Irrigation
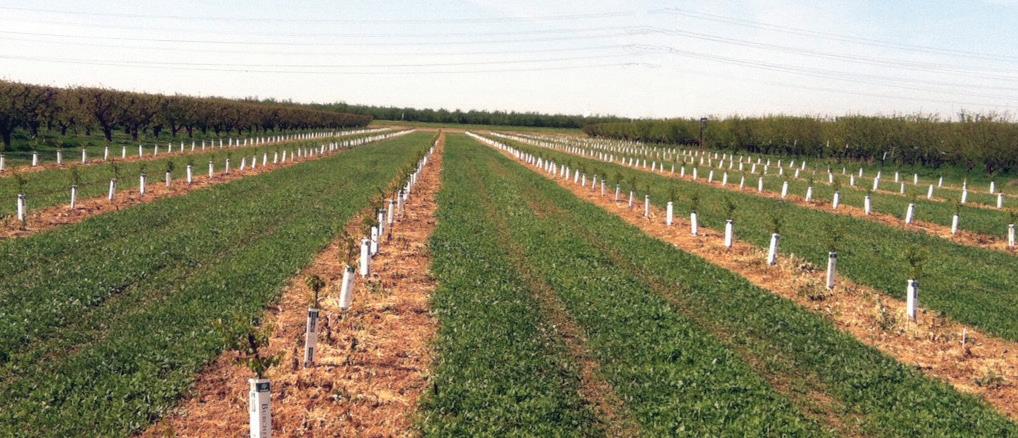
We began testing in 2014 in a nine-yearold commercial Chandler/Paradox orchard planted at 18 x 28 feet (86 trees per acre) on a deep, well-drained silt-loam/ fine sandy-loam soil near Red Bluff. The test continued through 2019. The design of the experiment was simple: we compared control trees given 100% irrigation (see below) starting about 30 days after leaf-out to trees that were not irrigated until a trigger level of SWP was reached. We tested five trigger levels for the start of irrigation: a grower control (typically starting irrigation while the trees were still near baseline SWP), or 1, 2, 3 or 4 bars drier than baseline SWP.
We divided the field into 4 rows x 11 tree plots and had five individual plots for each trigger level. In total, the test consisted of 12.5 acres. Starting after leaf-out (about the third week of April), we measured the SWP of two middle trees in each plot every three or four days. When the average of those trees
16 Progressive Crop Consultant March / April 2023
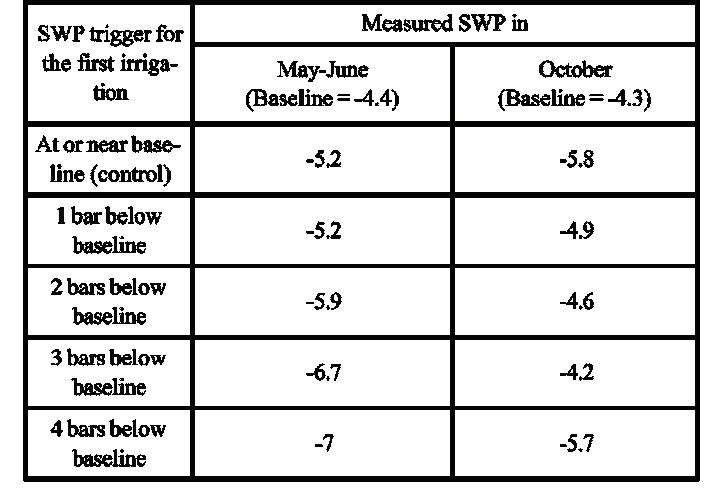
SWP trigger for the first irrigation Measured SWP in May-June (Baseline =-4.4) October (Baseline =-4.3) ContinuedfromPage14 SWP trigger for the first irrigation Irrigation start date Irrigation applied Yield (pounds/ acre dry inshell) % of ETrain 2014 (ET-in season rain = 38”)
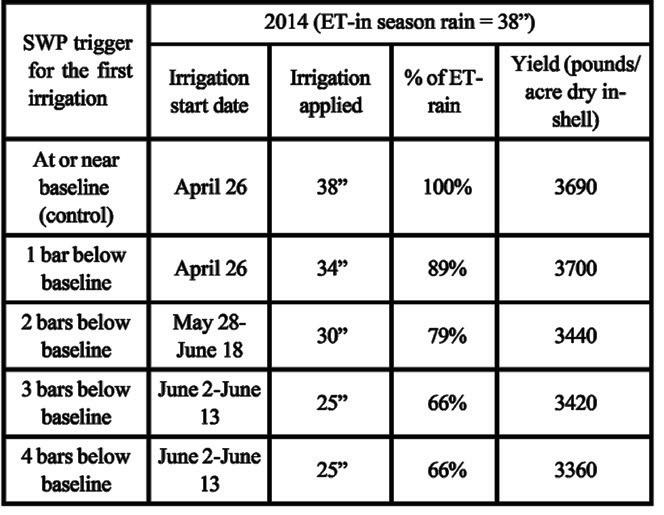
Table 1. Irrigation start dates, seasonal irrigation applied (in inches and as the equivalent percent of irrigation requirement, calculated from ET minus in-season rainfall) and crop yield for each of the irrigation treatments imposed in the first year of the study (2014).
Table 2. Average SWP measured in May and June 2014 when irrigation was being delayed in most of the treatments, and average SWP in October around harvest (October 17, 2014). Also shown are the baseline SWP values for the same time periods.
reached the trigger on two consecutive dates, we opened the sprinkler control valves to the tree rows in that plot. From then on, the plot was irrigated whenever the control plots and the rest of the orchard were irrigated.
Initial Results in 2014
We expected that a 1- or 2-bar trigger might cause mild water stress with minimal effect on the trees, but the 3- or 4-bar triggers would show some detrimental effects. However, we were not sure how long of a delay would result from waiting to start irrigation using any of these trigger levels. We were also unsure if trees with late triggers would always be ‘behind’ in their water needs and experience severe water stress at harvest because we could not apply a ‘catch-up’ irrigation to any of the delayed trees.
In 2014, the 1-bar trigger occurred about the same time as the grower control, but much to our surprise, waiting for the 2-bar trigger gave one to two months of delay (depending on the plot), with the 3- and 4-bar triggers giving slightly longer delays (Table 1, see page 16). Longer delays also resulted in less irrigation. In 2014, the control trees received 100% of calculated evapotranspiration (ET, see anrcatalog.ucanr.edu/ pdf/8533. pdf), whereas the 1- through 4-bar trees ranged from 89% to 66% of this value, respectively (Table 1, see page 16). There were some negative effects on crop yield, with the 4-bar trigger reducing yield by about 10% (Table 1, see page 16), but there were also some positive signs. For instance, at harvest in October, the 2-, 3and 4-bar triggers had a healthier canopy appearance than the controls. This matched our SWP measurements, which indicated that the delayed trees were less stressed than the controls (Table 2, see page 16). This was the most surprising result from the first year of the study; during the delay period (May, June), the longer delays were associated with more stressed (more negative) SWP values as expected, with the controls being closest to the baseline. However, by harvest, the opposite was the case, with the controls
being furthest from the baseline (Table 2, see page 16).
Trial results for 2015-18
Due to the overall improved appearance of trees in the delayed plots at harvest compared to the controls, the grower’s standard (control) irrigation start time in the entire orchard, including our control plots, was gradually delayed
each year after 2014. Water applications in the orchard and the control plots became substantially less than 100% of the seasonal irrigation need (Table 3, see page 16). Yields also generally improved across treatments compared to 2014, even though canopy size as measured by midsummer ground shaded area has
With years of proven efficacy, SUPPRESS® Herbicide EC consistently provides fast and effective broad-spectrum burndown on a wide variety of post-emergent grasses and weeds. Now it is approved for use as a plant desiccant!
ADVANTAGES

■ Excellent tool in IPM programs


■ Helps break chemical resistance
■ No pre-harvest interval or MRLs
■ Low-foaming and easy-to-use
■ Highly effective pre-harvest desiccant
March / April 2023 www.progressivecrop.com 17
WESTBRIDGE IS NOW GROWING AS SAN AGROW Call (760) 599-8855 or visit www.san-agrow.com.
YOUR YEAR-ROUND ORGANIC SOLUTION FOR WEED CONTROL & POTATO DESICCATION
early applications of SUPPRESS® for weed control and apply late season applications for desiccation. ContinuedonPage18
Apply
Table 3. Average irrigation start date (and equivalent days after leaf-out), seasonal irrigation applied in inches (and equivalent percent of the seasonal irrigation requirement, as in Table 1), yield, percent edible yield, relative value and crop relative value (and equivalent percent of the control treatment.) Relative value is an index combining the two main economic drivers of walnut value (percent edible yield and kernel color), and crop relative value is Yield x Relative value.

remained stable at 86%. Even with the changes over time that occurred in the control trees, delays associated with a 1- to 4-bar trigger showed small but consistent improvements in
Beat the Heat & Care for Your Crops with:

Anti-Stress
®
550
Frost & Freeze
Additional Environmental Stress Conditions that the product is useful for:


• High Temperatures & Extreme Heat
• Drought Conditions
• Transplanting
What is Anti-Stress 550®?
When to apply Anti-Stress 550®?
When is Anti-Stress 550® most e ective?
• Drying Winds
A foliar spray that creates a semi-permeable membrane over the plant surface.
Optimal application period is one to two weeks prior to the threat of high heat.
The coating of Anti-Stress becomes e ective when the product has dried on the plant. The drying time of Anti-Stress is the same as water in the same weather conditions.
will remain e ective 30 to 45 days, dependent on the rate of plant growth, application rate of product and weather conditions.
559.495.0234 • 800.678.7377 polymerag.com
• customerservice@polymerag.com

percent edible yield and relative value as well as substantial savings in water (Table 3). There were also indications of small but consistent increases in nut load. However, since nut load is determined by many factors, ongoing research in additional orchards is being conducted to determine if this effect is consistent.
Soil Moisture Storage and Possible Implication for Root Health
The soil in this location is a deep, well-drained silt-loam/fine sandy-loam, and soil moisture measurements have indicated that the trees in this orchard have access to at least 10 feet of stored soil moisture. In most years, rainfall is also sufficient to refill this soil profile. Hence, using the pressure chamber to determine when to start irrigating has enabled the grower to take maximum advantage of this soil moisture resource, potentially improving soil aeration and overall root health. This may be one of the reasons the delayed trees appeared healthier and less stressed around harvest compared to the controls. Answering this question with greater confidence will require more research focused on the root system.
Taking the Practice Beyond Red Bluff
It is also important to test the delayed irrigation approach on different soil types. Because this project was conducted in a relatively high rainfall area in the Sacramento Valley, extending these dramatic results to other areas within the state with differing rainfall and soils should be done with caution. We currently have two different trials underway to further test the merits of delaying the start of irrigation in walnut (a second site in Stanislaus County on heavier clay soil and a third trial in western Tehama County on stratified soils, with gravelly subsoils and much lower water holding capacity.) Both trials are a smaller-scale version of the Red Bluff trial.
18 Progressive Crop Consultant March / April 2023
orchard
ContinuedfromPage17 Order from your PCA or local Ag Retailer / Crop Protection Supplier *One application of Anti-Stress 550®
In the Stanislaus County
consisting of Chandler on
Vlach, results after three years suggest that similar benefits of delaying the first irrigation may be possible in this higher-clay-content soil site. Some ailing trees have shown partial recovery in the delay treatment, indicating the possibility of too much water being applied too early (Figure 1,see page 14). Yield at the Stanislaus site was not affected when irrigation was withheld until readings of 2 bars drier than baseline.
After two years, results from the western Tehama County test on soils with lower water holding capacity and soil layers that may restrict root depth suggest there may still be some benefit of delaying irrigation in terms of less tree stress at harvest, reduced water costs, and improved edible kernel. However, because of the lower water holding capacity of the soils, the delay may only be about one to two weeks with water savings of about 4 inches.
A key feature of using SWP to manage irrigation is that it provides growers with an orchard-specific measurement of tree water stress and hence allows them to safely take advantage of the existing soil moisture resource, regardless of soil depth, type and quantity of the stored soil moisture. Using SWP to delay the start of irrigation resulted in healthier-looking, less-water-stressed trees at harvest, challenging the conventional wisdom that an early start to irrigation is beneficial because it allows the saving of deep soil moisture ‘in the bank’ for use later in the season. Quite possibly, keeping this savings account too full in the spring may cause more problems than it solves.
The benefits of waiting to irrigate in spring until trees read 2 to 3 bars drier than the baseline despite the stark differences between these three sites is a powerful testament to the value of using the pressure chamber. Once growers use the pressure chamber to trigger the start of irrigation, they can continue to trigger irrigations throughout the season by waiting for SWP readings of 2 to 3 bars drier than the fully watered baseline.
Baseline and other information for interpreting SWP readings can be found at sacvalleyorchards.com/manuals/ stem-water-potential/pressure-chamber-advanced-interpretation-in-walnut/.
These trials are also challenging the conventional wisdom that we must irrigate to keep up with ET to have healthy and high-yielding walnut orchards (Figure
2, see page 14). Stay tuned as these two new trials continue to add to our collection of experiences.
Comments about this article? We want to hear from you. Feel free to email us at article@jcsmarketinginc.com
diKaP™ (0-31-50) improves P & K nutrition, increases plant respiration and antioxidant production.
Banx™ (0-20-32) provides zinc and boron nutrition and production of plant carbohydrates.
March / April 2023 www.progressivecrop.com 19
Contact us for more information at (208) 678-2610 @redoxgrows redoxgrows.com LISTEN TO OUR NEW REDOX GROWS PODCAST Scan the QR code to listen to our Podcast IMPROVE NUT FILL & ENHANCE ABIOTIC STRESS DEFENSE
Scan to see the results
Most rice in California is established and grown in what is referred to as a water-seeded system. In this system, after the field is tilled and leveled, most (70% to 100%) of the nitrogen (N) is applied as aqua-ammonia (aqua) injected 3 to 4 inches below the soil surface. After this, the field is flooded and then aerial seeded by airplane. The field stays flooded, resulting in anaerobic (low oxygen) soil conditions. The deep placement of fertilizer and the anaerobic soil conditions protect the fertilizer N from gaseous losses due to ammonia volatilization or nitrification/denitrification. Very little of this preplant N fertilizer is taken up by the crop during the first month, so it needs to be well protected by the flood layer. Using this practice, fertilizer N is used very efficiently. In addition to this preplant aqua-N, some starter N (containing P, K and other nutrients) are applied early in the season, and a top-dress N may be applied mid-season.
What if Aqua is Not Available?
While this strategy has proven to be efficient and effective, there are situations where it may not be possible to apply aqua. For example, in recent years,
Alternative Nitrogen Management Strategies for California Rice Systems
By BRUCE LINQUIST | UCCE Rice Specialist, KARLA CORNELIO |Graduate Student Researcher, UC Davis and TELHA REHMAN | Graduate Student Researcher, UC Davis
supply chain issues have limited the availability of aqua. Also, heavy rain following seedbed preparation (but before fertilizer application) makes it difficult and inefficient to apply aqua. It is not advisable to apply aqua into a moist soil. Not only is it difficult for the equipment on wet clayey soils, but the aqua will start to nitrify (convert from NH4 to NO3) in moist soils, resulting in nitrate accumulation which will denitrify (NO3 lost as N2 gas to atmosphere) when the field is flooded.
So, what is a grower to do if aqua is not available? We evaluated six products applied at different times (19 treatments) at two locations in 2020 and 2021. The products included aqua, urea, ammonium sulfate and three enhanced efficiency N (EENF) fertilizers (Super U, Agrotain or Agrocote). We applied the products at a single dose at various times including preflood, one day, one week and two weeks after flooding. We also had a split application where the N rate was split and applied at four different times during the season.
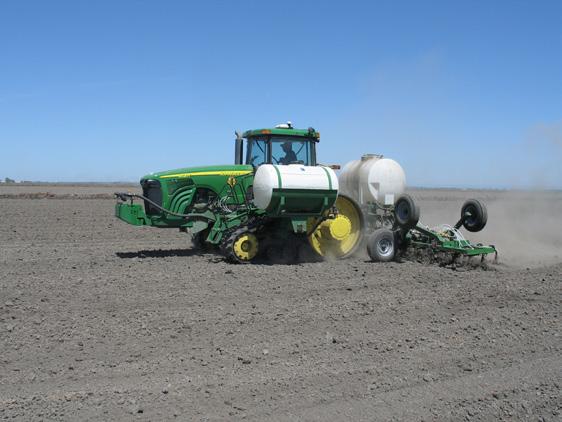
Some general findings were that aqua or urea applied to a dry soil before flooding
resulted in the highest yields at harvest. This confirms other earlier findings we have made. Ideally, if urea is used, it should be worked into the soil with a harrow before flooding, although if urea is applied to a cloddy soil, the urea granules tend to fall deeper into the soil via gaps between clods. It is important that urea is applied to dry soil so that the N fertilizer does not start to nitrify before field is flooded and to avoid ammonium volatilization.
Our second major finding was if a preflood application to a dry soil is not possible, the next best scenario is to split the N rate. The total N rate split at 15%, 35%, 35% and 15% at three, four, five and six weeks, respectively, after planting will likely give the best results. The idea behind split applications is that the fertilizer is being applied when the crop needs it most. This results in rapid fertilizer N uptake and lowers the chances for significant N losses. However, the fertilizer N is being broadcast into the flood water, and this may result in some volatilization and denitrifica-
20 Progressive Crop Consultant March / April 2023
ContinuedonPage22
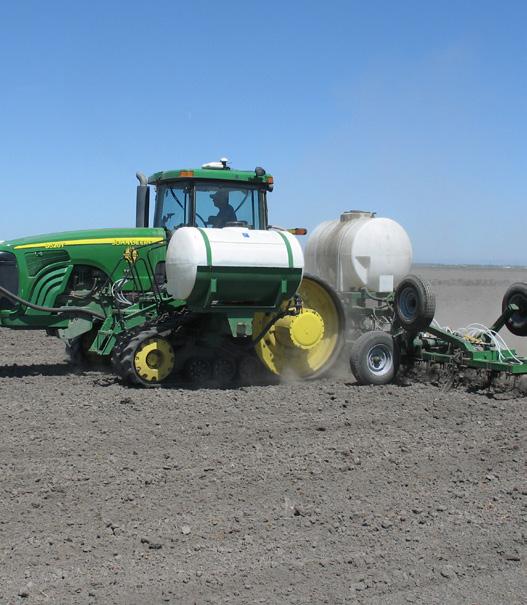
Aqua-ammonia being applied to a rice field. General findings from research show that aqua or urea applied to a dry soil before flooding resulted in the highest yields at harvest (all photos courtesy B. Linquist.)


Bringing Crop Consultants Together September 27th-28th Register Early and Save Register to Exhibit at: Price rises to $275 on July 31st, 2023 Early-bird Pricing $225/person
tion losses. At one of our sites, the data suggested if one were to split the N, the total N rate may need to be increased compared to aqua or urea applied before flooding.
Third, using the EENFs, such as Super U, Agrotain or Agrocote, had no benefit over applying urea alone. They did not improve yields, and in some cases, yields were reduced. These are expensive fertilizers, and we found no additional benefit to their use.
Finally, using ammonium sulfate did not affect yields compared to using urea. In our studies, we applied sulfate fertilizer to make sure S was not limiting. In soils deficient in S, applications of ammonium sulfate may be of benefit.
Decide if Top-Dress N is Necessary
We recommend applying the full rate
Testing the Green Seeker in the field. This instrument measures the Normalized Difference Vegetation Index of the canopy and can help decide whether a top-dress N application is needed if N deficiency is observed or expected.
ProBlad® Verde is a category-defining fungicide that delivers a paradigm shift in disease management and crop marketability. Its multi-site mode of action (MOA) quickly attacks all active life cycle stages of both fungal and bacterial pathogens, particularly powdery mildew and botrytis. And, ProBlad Verde leaves no residue, making it MRL exempt so you can maximize your competitive edge.
www.sym-agro.com
22 Progressive Crop Consultant March / April 2023
ContinuedfromPage20
The Bold Disease Control Choice 3 Preventative 3 Curative 3 Locally systemic 3 MRL Exempt 3 Unique, multi-site MOA Learn more at sym-agro.com, or contact your agronomist.
Apply ProBlad® Verde for Decisive Results
of N at the beginning of the season in the aqua and starter fertilizer application. Regardless of the basal strategy, including those just discussed, top-dress N applications are needed if the plant is N deficient or you suspect it will become so. At PI (45 to 55 days after planting), the crop should be accessed to determine if a top-dress of N fertilizer is necessary. A good assessment is important because not applying N when needed can lead to a reduction in yield; however, applying N fertilizer when it is not needed can lead to lodging, delayed maturity, increased incidence of disease and reduced yields. The GreenSeeker (or similar instrument), which measures the NDVI (Normalized Difference Vegetation Index) of the canopy, is a tool we have tested for this purpose. The best way to do this is to develop a Sufficiency Index (SI). The sufficiency index is calculated using the NDVI reading from the field test area divided by the NDVI from an enriched N strip (representing a crop with unlimited N.) The N-enriched strip is an area where extra N was added to the field (could be done by overlapping an area with an aqua rig or a small area where you intentionally added extra N.) The SI will be a number between 0 and 1. The lower the SI, the more N-deficient. For example, if the N-enriched strip gave an NDVI value of 75 and the field test area gave an NDVI value of 69, the SI would be 0.92 (69/75 = 0.92). Our research has indicated it is cost-effective to apply a top-dress of N fertilizer when the SI is below 0.95, although this depends on the price of rice and cost of applying fertilizer. This could also be done using a drone which would cover a larger area. If using a drone, we recommend using a camera that can measure NDRE (Normalized Difference Red Edge). We have found NDRE to be more precise than NDVI when quantifying the nitrogen status of a crop.
More on this can be found on our website at https://rice.ucanr.edu/.


Comments about this article? We want to hear from you. Feel free to email us at article@jcsmarketinginc.com

March / April 2023 www.progressivecrop.com 23
ATTUNE
Phosphate vs Phosphite: Part Two Can Phosphites Serve the Function of a Biostimulant?
 By JW LEMONS | CCA, CPAg, Verdesian Life Sciences
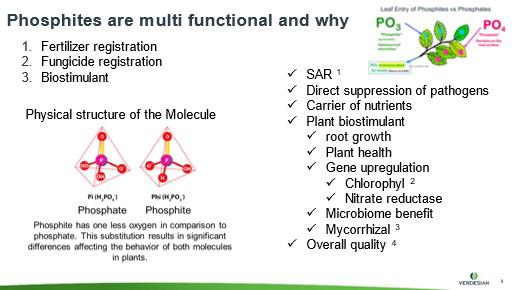
Phosphite has been a controversial topic for years. Its use and benefits are argued in hundreds of research papers across the world’s scientific communities. Is it a fertilizer, a biostimulant or a fungicide? These questions are discussed in multiple university research results. I believe that if we look carefully, we can conclude phosphite serves all three functions. As with everything we do with chemicals and nutrition, we need to be aware of possible negative effects. We also need to determine how we are using the phosphite materials and the results we are seeking.
Phosphite (PO33-; Phi), a reduced form of phosphate (PO43-; Pi), is widely marketed as either a fungicide or fertilizer or sometimes as a biostimulant. Because CCAs, growers and distributors see the product marketed in all three ways, this can cause confusion. Each designated use will most likely be tied to the phenology (growth stage) of each treated crop. Timing is critical to determine which effect we are seeking. In this article, we broach the controversial topic of Phi as a biostimulant.
In Research
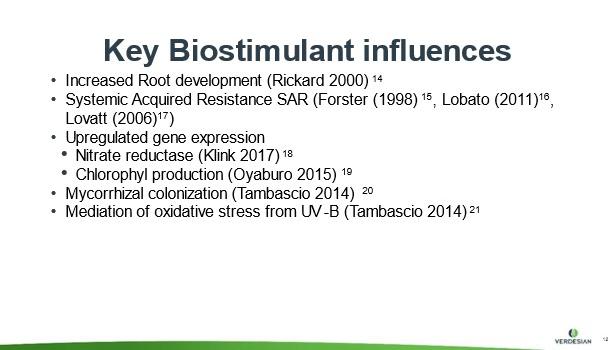
Many researchers believe that Phi does not attribute to the growth and health of the plant. They believe that the positive response to Phi is attributable to the disease suppression by Phi. Lovatt and Mikkelsen (2006) emphasized Phi, if used at appropriate rates, can provide stimulation to plants that may not occur with Pi. They suggested Phi is more than just a fungicide; for example, it increases floral intensity, yield, fruit size and total soluble solids. In addition, combinations of Phi and Pi ions are believed to be more effective than either Pi or Phi alone in plant assimilation (Foster et al. 1998; Young 2004).
Celery
Lettuce Phosphorous acid (50% total P as Phi)
Nutrient solution in hydroponics
Onion Phosphorous acid Foliar spray and soil application
Potato Phosphorous acid Foliar spray
Potato Potassium phosphite Foliar application
Potato Potassium phosphite Sprays applied to seed tubers and foliage
Potato Potassium phosphite Liquid solution applied to tubers
Potato Potassium phosphite Foliar spray
Sweet pepper Phosphorous acid Drip irrigation and foliar spray
Tomato Phosphorous acid (50% total P as Phi)
Nutrient solution in hydroponics
Biomass dry weight, foliar area and P content in the whole plant Bertsch et al. (2009)
Percentage of jumbo size onions Rickard (2000)
Size and yield of U.S. No. 1 grade potatoes Rickard (2000)
Phytoalexin and chitinase content, and yield maintenance
Reinforcement of the cell wall and defense response
Emergence, early growth and mycorrhizal colonization
Chlorophyll content, protection against UV-B light and activation of the antioxidant system
Lobato et al. (2011)
Olivieri et al. (2012)
Tambascio et al. (2014)
Oyarburo et al. (2015)
Size and yield of U.S. No. 1 grade peppers Rickard (2000)
Biomass dry weight, foliar area and P content in the whole plant
Bertsch et al. (2009)
With all my studies and visits with research teams, I believe Pi is becoming accepted by agriculture as a biostimulator. Even without a consensus
on its physiological function across agriculture and horticulture, too many positive effects are evident. As long as there is sufficient Pi present, Phi con-
24 Progressive Crop Consultant March / April 2023
Table 1. Crop Phosphite source (dosage) Method of application Improved trait/s Reference
Yield Rickard
Phosphorous acid Foliar spray
(2000)
Table 1. Beneficial effects of phosphite (Phi) as a biostimulator in vegetable crops.
Crop Phosphite source (dosage) Method of application
Improved trait/s Reference
Avocado Phosphorous acid Foliar spray Yield of commercially valuable sized fruit Lovatt (2013)
Banana Phosphorous acid (50% P as HPO42 and 50% as H2PO3 )
Nutrient solution in hydroponics
Biomass dry weight, foliar area and P content in the whole plant Bertsch et al. (2009)
Citrus Phosphorous acid Foliar spray Yield and acid content in fruits Lovatt, 1998, Lovatt, 1999
Citrus Phosphorous acid Foliar spray Yield Albrigo (1999)
Citrus Phosphorous acid Foliar spray Yield Rickard (2000)
Peach Phosphorous acid Foliar spray Sugar and soluble solids content Rickard (2000)
Raspberr y Phosphorous acid Foliar spray Fruit firmness Rickard (2000)
Strawber ry Potassium phosphite Plants soaked and irrigated Fruit acidity, ascorbic acid and anthocyanin content Moor et al. (2009)
Strawber ry Potassium phosphite (6.7% total P as Phi)
Strawber ry Phosphorous acid (30% total P as Phi)
Strawber ry Phosphorous acid (20% total P as Phi)
Strawber ry Phosphorous acid (20% to 30% total P as Phi)
Root application through a controlled watering system Growth of roots and shoots Glinicki et al. (2010)
Nutrient solution applied to the roots
Concentrations of chlorophylls, amino acids and proteins in leaves Estrada-Ortiz et al. (2011)
Nutrient solution applied to the roots Sugar concentration and firmness of fruits Estrada-Ortiz et al. (2012)
Nutrient solution applied to the roots pH, EC and anthocyanin concentration in fruits Estrada-Ortiz et al. (2013)
derstanding of the fundamental processes behind the effects of Phi on plant metabolism needed.
Moor et al. (2009) found the application of Phi does not affect strawberry growth or yield compared to traditional Pi fertilization, although it does increase fruit quality by activating the synthesis of ascorbic acid and anthocyanins. Similarly, Estrada-Ortiz et al. (2013) found beneficial effects of Phi on strawberry fruit quality and induction of plant defense mechanisms (Estrada-Ortiz et al., 2011, Estrada-Ortiz et al., 2012), which has also been reported by Rickard (2000) in several crop species and cultivars. Likewise, Glinicki et al. (2010) reported beneficial effects of Phi on the growth parameters of three strawberry cultivars.
As a Certified Crop Consultant and Certified Professional Agronomist, based on research studies and trials, I believe that phosphites are biostimulants. Couple that with the ability of phosphite to enter and translocate within a plant and you have a formidable tool. The following statement and sited research results confirms this:
“Phosphite has been found to display systemic effects and high chemical stability in plant tissues, though it also shows great mobility throughout the whole plant. This mobility facilitates the penetration and transport of the foliar-applied Phi to the rest of the plant, including the roots.” –Smillie et al. 1989, Brunings et al. 2015
By definition, “A plant biostimulant is any substance or microorganism applied to plants with the aim to enhance nutrition efficiency, abiotic stress tolerance and/or crop quality traits, regardless of its nutrient content.” By extension, plant biostimulants also designate commercial products containing mixtures of such substances and/or microorganisms. Research projects and results are too numerous to quote them all.
tinues to have a positive effect on plant metabolism. Today, Phi is emerging as a potential inductor of beneficial metabolic responses in plants as it has demonstrated its effectiveness against different
stress factors and has improved crop yield and quality. Important progress has been made in the field of Phi uptake, transport and subcellular localization, and there is still a more in-depth un-
Comments about this article? We want to hear from you. Feel free to email us at article@jcsmarketinginc.com
March / April 2023 www.progressivecrop.com 25
Table 2. Beneficial effects of phosphite (Phi) as a biostimulator in fruit crops.
Understanding and Leveraging the Nitrogen Cycle for Informed Almond Fertility Decision-Making
By MATT COMREY | Technical Nutrition Agronomist, Wilbur-Ellis Agribusiness
There is no doubt that almond producers have had to navigate numerous challenges over the past several years. Drought conditions, declining nut prices and regional frost events have forced growers to implement a renewed focus on input management as it relates to agronomic efficiency. Agronomic efficiency can be improved through the implementation of the 4R’s of Nutrient Stewardship, which include Right Source, Right Rate, Right Time and Right Place. Improved grower understanding of various nutrient cycles and soil nutrient loss mechanisms are allowing growers to incorporate a sophisticated layer of nutrient management that has evolved over recent years. By understanding and leveraging both the nitrogen cycle and the 4R’s, almond producers can make informed fertility decisions that maximize nitrogen use efficiency (NUE), allowing them to successfully navigate both economic and environmental headwinds.
Factors Impacting the Nitrogen Cycle
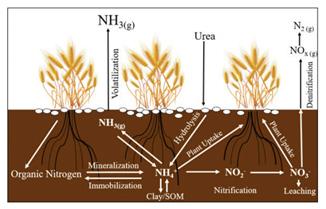
Nitrogen management is important, not only due to product cost but also because of the many loss mechanisms associated with less-than-ideal soil conditions. Almonds require a large amount of annual nitrogen to produce a commercial yield. CDFA suggests that on average, 68 lbs N are removed per 1,000 pounds of kernels with another 30+ lbs needed to maintain adequate growth (depending on tree age.) Almonds rely on large amounts of N to build both amino acids and proteins as well as for the formation of chlorophyll. To adequately supply the appropriate amount of N in an efficient manner, growers will need to understand how environmental factors impact the nitrogen cycle (Figure 1) and ensure that applications are available during periods of peak uptake and demand.
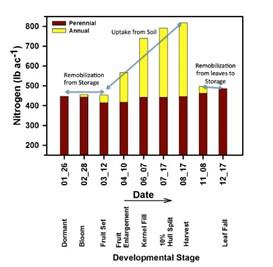
Almond trees are quite good at remobilizing N resources from perennial plant parts to annual tissues during the bloom period through fruit set. Figure 2 depicts this remobilization concept with total N remaining constant through
March 12, accumulating in annual tissues while decreasing in perennial tissues. The graphic suggests that there is little uptake from applied N during this period but does not necessarily mean growers should avoid applications
26 Progressive Crop Consultant March / April 2023
Figure 1. Schematic of nitrogen cycling including ammonia volatilization in the soil/ plant/atmosphere environment.
Figure 2. Nitrogen allocation in various tissues. Almond trees are quite good at remobilizing N resources from perennial plant parts to annual tissues during the bloom period through fruit set.
at this timing. Depending on soil and other environmental conditions, application timing can vary greatly during this period.


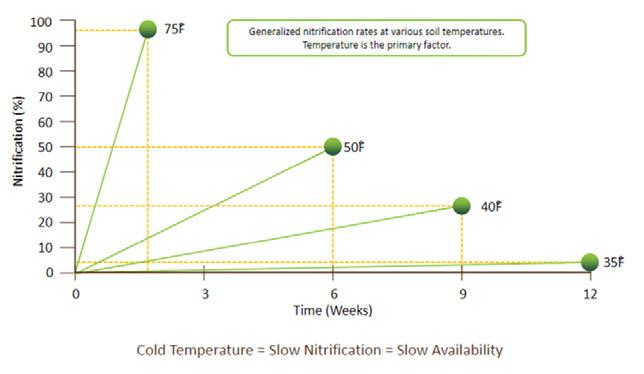
Proper application timing not only requires understanding crop uptake demand, but also how soil conditions impact nutrient form. Because common N fertilizers used by almond producers contain different combinations of urea, ammonium and/or nitrate, different considerations related to application timing are needed. The majority of almond N uptake is in the nitrate form. This requires N applied in either the ammonium or urea form to largely be converted to nitrate, making it more available for uptake. The conversion re actions such as nitrification (conversion of ammonium to nitrate) are governed by soil moisture and soil temperature. Growers should also consider rain forecasts when making early N applications because spring rain events can possibly leach nitrate out of the rootzone, resulting in not only an environmental impact but an economic impact as well.
Figure 3 illustrates the relationship between nitrification rates and soil temperature. The speed at which ammonium is converted to nitrate can be dramatically different depending on soil temperature. Figure 4 is a graph generated from Wilbur Ellis’ Probe Schedule depicting soil temperatures of a mid-textured loam soil at different depths from mid-February through mid-March. Shallow soil temperatures during this period were approaching and at times exceeding 60 degrees F. When we use this information with the nitrification table, we see that it can take up to three weeks for 50% of our applied ammonium to be converted to nitrate. Heavier, cooler soils experience much slower nitrification than coarser textured soils, meaning growers should take their soil conditions, weather forecasts and N source into consideration when timing applications.
Complete,


March / April 2023 www.progressivecrop.com 27
ContinuedonPage28
We Are Here to Help Call: 209.720.8040 Visit: WRTAG.COM Mn Fe Zn Cu
Zinc-Shotgun® is a fertilizer that focuses on micronutrients to satisfy needs of customers seeking high zinc with manganese, iron and copper. The micronutrients are completely chelated with natural organic acids, amino acids, and carbohydrates that are readily bio-degradable and supply energy to the plant and soil microflora. Many soils are low in zinc and also require other micronutrients for the growth of good crops.
organically complexed micronutrient package containing essential elements to improve plant health and growth.
Organically complexed with plant based amino acids, organic acids, and complexed polysaccharides.
The nutrients are readily absorbed by the plant for a faster response.
Designed to be applied both by foliar application and fertigation practices and is also e ective when applied directly to the soil.
ContinuedfromPage27
Reconciling Data into Nitrogen Application Decisions

A general rule of thumb for managing N
throughout the almond growing season involves allocating large portions of the N budget to applications during four major timings. Table 1 outlines seasonal nitrogen allocations, which can be a
valuable guide to timing applications but lack some of the nuance needed to understand the right rate as well as the right source to consider.
Many growers and consultants sample almond leaves throughout various time periods of the season to understand the status of various nutrients including N. It is not uncommon for leaf tissue samples to be evaluated for N status monthly starting in April through mid-July. July leaf tissue samples can be an excellent tool for growers to adjust or implement postharvest fertility applications to address any nutrient shortages prior to the remobilization of these nutrient resources to storage organs. If leaf N levels during the mid-July period are inadequate, then almond trees may not be able store enough N for next year’s bloom period. This means growers and consultants alike should consider 2022’s July tissue levels as an important data point when developing the spring fertility plan for 2023.
Another important consideration when developing the spring fertility plan is the overall yield of the previous year’s crop. When I discuss postharvest fertility with growers, I describe it as the final opportunity of the season to reconcile fertility inputs with crop exports. For most of the season, growers making most fertility decisions are guided via
28 Progressive Crop Consultant March / April 2023
March 20% 20% 30% 30% April May Post-harvest
Figure 3. Relationship between nitrification rates and soil temperature. The speed at which ammonium is converted to nitrate can be dramatically different depending on soil temperature.
Table 1. Seasonal nitrogen allocations can be a valuable guide to timing applications but lack some of the nuance needed to understand the right rate as well as the right source to consider.
certain assumptions about crop load. Growers can make a pretty good assessment of crop load by late spring and into early summer, adjust their fertility accordingly and then monitor via leaf tissue analysis and/or field observations throughout the remainder of the season. Once crop starts to get harvested and loads are delivered to the processor, a


clearer picture of final yield develops. If the postharvest fertility program was shorted/omitted or if yield was dramatically reduced via frost or some other phenomenon, spring fertility may need to be adjusted accordingly. Growers in the Sacramento Valley that experienced extreme crop loss from freezing temperatures in 2022 will likely need
to work with their advisors and adjust spring fertility to feed what is likely to be a large crop in 2023.
Almond growers have the difficult task of reconciling an enormous amount of data to make fertility decisions for their operation. These data points include lag measures such as previous year’s July nutrition levels and/or yield to lead measures like current year’s estimated N usage based on yield goals. Growers are likely to experience economic pressure through elevated input costs and weak nut prices as well as regulatory pressure from state and environmental agencies. N management will continue to be a focus throughout California, and growers who can effectively leverage their understanding of the nitrogen cycle as well as the 4R’s will be better positioned for the coming 2023 season.
Comments about this article? We want to hear from you. Feel free to email us at article@jcsmarketinginc.com
March / April 2023 www.progressivecrop.com 29
Grounded in Soil Health? Nourish a healthy soil microbial community with Zap® Control soil pests with OMRI-listed Promax® www.humagro.com/PCC323
Figure 4. Soil temperatures of a mid-textured loam soil at different depths from mid-February through mid-March. Shallow soil temperatures during this period were approaching and at times exceeding 60 degrees F.
Foliar Fertilization of Grapevines: What We Know and Don’t Know
 By PAUL SCHREINER | Ph.D., Research Plant Physiologist, USDA-ARS


Applying fertilizers or plant nutrients to foliage has a long history, and there is an extensive number of papers published on the subject. However, it may surprise some to learn that we still do not fully understand how nutrients applied to the foliage cross the leaf cuticle and enter the cytoplasm of
Advertorial
Oregon State has developed an Aglime Score which is basically an efficiency rating. Particle size or mesh size is key to this rating and is the primary indicator of reactivity. Studies have shown that pulverized limestone smaller than 40 mesh (size of table salt) are considered 100% effective and are the quickest to dissolve in the soil to release calcium and adjust soil pH.

Mildly acidic water and soil conditions will dissolve finely ground limestone. For example, the pH of rainwater in California is typically around 5.7, which is enough to dissolve our aglime that is broadcast. Our pulverized limestone products average 85% passing 100 mesh (diameter of a human hair). Remember aglime quality increases when particle size decreases.
plant cells where they can be used in metabolism. The cuticle is the main barrier to absorption of foliar applied nutrients.
Many Factors at Play
All aerial plant parts, including leaves and berries, are covered by a complex structure (a little like our own skin) known as the cuticle. The plant cuticle limits or regulates the transport of water and other substances between the plant and the environment, in addition to protecting plant cells from UV light and discouraging or sensing pests or pathogens. The cuticle is a hydrophobic layer formed just outside the cellulose cell wall that is composed mainly of the cutin polymer (a polyester) with waxes both embedded in it and covering its surface. However, numerous other chemical constituents beyond the scope of this discussion are also present in the cuticle and alter its properties with respect to the transport of any compound across this barrier. While there is still much debate about how different compounds (including plant nutrients) cross the cuticle, two major pathways of transport are known: the non-polar pathway or waxy pathway, and the polar pathway or aqueous pathway.
Compounds that are soluble in oil or an organic solvent, such as some herbicides or even smoke-related phenols, cross the cuticle easily through the waxy pathway because they are basically soluble in it. However, most plant nutrients are polar compounds or ions that are water-soluble, and transport of these substances relies on the aqueous pathway. This aqueous pathway exists because of ‘aqueous pores’ that occur within the waxy cuticle. While these pores are known to exist based on indirect evidence, they have yet to be seen. Aqueous pores in the cuticle become more open or connected as the relative humidity in the air increases. Therefore, transport of foliar-applied nutrient ions is much greater at higher humidity, and spraying foliar nutrients early in the day when humidity is still high is more effective than at midday or in the afternoon when humidity drops. Higher humidity also translates to a longer time that the
30 Progressive Crop Consultant March / April 2023
Ask for it by name Blue Mountain Minerals Naturally the Best! For more information 209-533-0127x112
U.S. 20 Mesh U.S. 40 Mesh
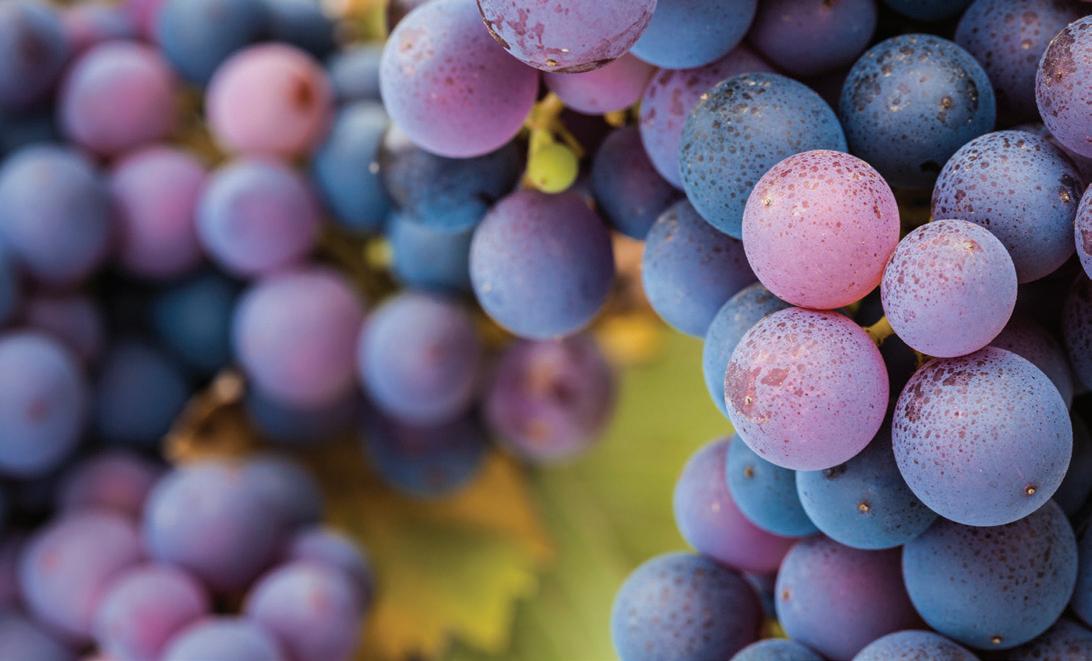
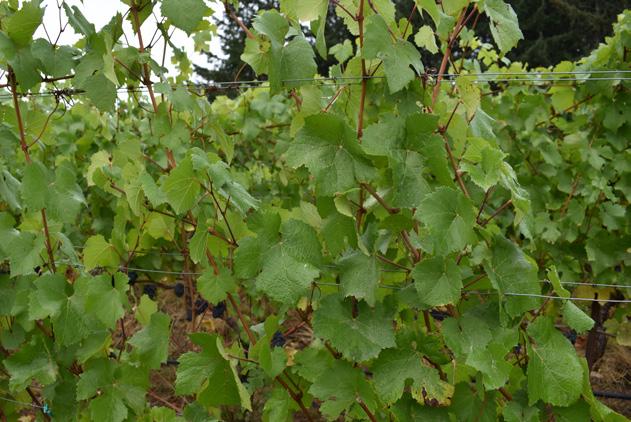
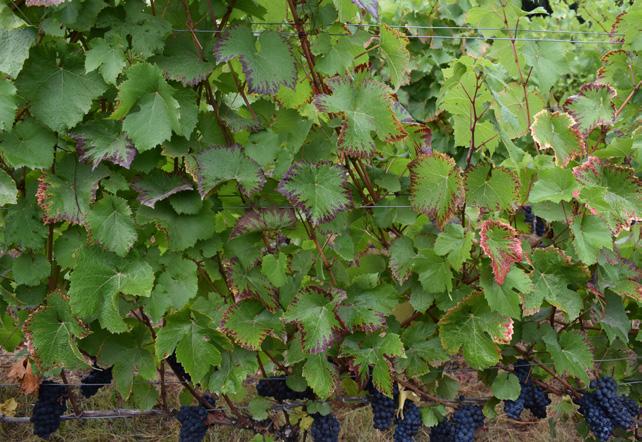
Figure 1. Photographs of Pinot noir from the foliar Mg trial showing the canopies of the untreated control (left) and the high rate of Mg foliar treatment (right) taken in close proximity in one of the replicate plots on 9/30/22 (photos by P. Schreiner.)
spray droplets remain wet, thus keeping ions in solution longer, which also facilitates greater transport across the cuticle. Humidity also affects what is known as the point of deliquescence (POD) for different ions, which is the level of humidity needed for a given ion to attract water vapor and remain in solution on a given surface. POD varies for different nutrients, but higher humidity levels increase the chance that POD will be exceeded.
Another property of nutrients or ions related to aqueous pores and transport through them is known as the hydrated ion radius, which is the molecular size of the given ion and those water molecules tightly adhered to it when dissolved in water (Table 1). Many macronutrient ions have a larger hydrated radius when compared to micronutrient ions. A smaller hydrated radius allows for greater transport through aqueous pores estimated from various studies to have a diameter of about 0.3 to 2.0 nanometers. This is one reason that foliar application of micronutrients is more effective than foliar application of macronutrients.
However, one must also consider that micronutrients are needed in much, much lower quantities to be in a healthy range. Indeed, it would be difficult, if not impossible, to supply enough nutrients for most macronutrients like N through the foliage alone.

Table 1 shows that the hydrated radius for boric acid is actually on par with the macronutrients. Yet, we know that boric acid and other sources of boron
GET READY FOR SUMMER SIZZLE
(e.g., Solubor) are used very effectively to alleviate B deficiency in grapevines. This is because uncharged molecules cross the cuticle far easier than charged ions. While it is still not entirely clear, some foliar nutrition experts think that relatively small molecules that are uncharged, such as boric acid and urea, cross the cuticle via the waxy pathway. Indeed, water molecules appear to be transported to some
Surround® Crop Protectant and Purshade® Solar Protectant prevent damage from sunburn, harmful ultraviolet radiation and infrared light — while allowing photosynthesis. It’s like growing your crops in the shade — in full sunlight.
March / April 2023 www.progressivecrop.com 31
Table 1
Ion Hydrated Radius (nm) NO3- 0.345 NH4+ 0.279 H2PO4- 0.377 K+ 0.280 Mg2+ 0.209 H3BO3 0.360 Mn2+ 0.083 Cu2+ 0.073 Zn2+ 0.075 Vineyard Years Urea rate in spray Foliar N applied (lb/ac) Veraison Leaf N% Yield (ton/ ac) Must YAN (mg N/L) Prn Wts g/vine Pinot A 1yr only 2013 0 0 1.99 a 7.5 93 a 1099 0.8% - 4 apps 12 2.24 b 6.9 172 b 1203 Chard A 2yr mean 2017-20 18 0 0 1.69 4.7 62 a 430 0.8% - 3 apps 21 1.79 4.6 112 b 393 Pinot B 3yr mean 2018-20 0 0 1.97 3.5 138 a 363
ContinuedonPage32
Table 2
Table 1. Hydrated radius of different foliar nutrients that may be applied to plants.
4-6 °F COOLER 50% UP
LESS SUNBURN DAMAGE h20 INCREASES WATER USE EFFICIENCY UNDER INTENSE SUNLIGHT AND HIGH HEAT Always read and follow label instructions. NovaSource® and Surround® and PurShade® are registered trademarks of Tessenderlo Kerley, Inc. ©2023 Tessenderlo Kerley, Inc. All rights reserved. Call: 800-525-2803 novasource.com
TO
extent via the waxy pathway, allowing some plants to take up significant water directly through their leaves.

Cuticles on the upper surface of leaves (known as the adaxial surface) are generally thicker than the corresponding cuticle on the leaf bottom surface (abaxial surface). When nutrients were applied separately to upper versus lower leaf surfaces, more transport occurred across the bottom side of the leaf, up to
four times more. Another practical consideration to increase nutrient absorption is to ensure that sprays are well deposited on the underside of leaves by having good airflow during spraying. This could mean increasing fan speed.

Another consideration important for nutrient transfer is the contact angle of the spray droplets that land on plant surfaces. This property is mostly dictated by cuticle properties, particularly the waxes on the


outer surface, and by the physio-chemical properties of the spray solution. Different plant species, different tissues (leaves vs fruits) and even different ages of the tissues along with the prevailing environmental conditions affect cuticle properties that alter contact angles. Spray adjuvants or surfactants can also reduce the contact angle (i.e., help spread out the droplets) and increase transport across the cuticle. Numerous studies using isolated cuticles have shown the importance of spray adjuvants to increase foliar absorption of nutrients. In addition, adjuvants can delay the drying time of droplets and keep the nutrient in solution longer, allowing for greater uptake. It should be noted that there are also cases where the naked nutrients alone (without spray adjuvants) were absorbed just as effectively as when applied with an adjuvant.
What about chelates? This area gets a lot of marketing attention, but due to the proprietary nature of many chelates sold, it is often difficult to untangle advertising from evidence that specific chelates actually improve foliar uptake. While there are cases where chelates have proven more effective than nutrient ions alone, there are also cases where they have not.


Finally, another factor still unresolved regarding foliar uptake of nutrients is the role of stomates and other structures on the external surface of leaves, such as trichomes (leaf hairs) and specialized cells above veins.
Recent findings show that stomates can play a clear role in facilitating uptake of nutrients. For example, in a series of experiments with bean leaves where stomates were manipulated to be open or closed, uptake of nitrogen from urea, ammonium or nitrate was two times higher when the stomates were open. It should be noted that uptake via stomates does not just flow through the open stomatal pore; it is still a diffusion process along the edges of the stomatal guard cells that is more apparent when the pore is open. Additionally, recent studies using some

32 Progressive Crop Consultant March / April 2023
ContinuedfromPage31 ContinuedonPage34 Other Innovative Products* From Belchim Crop Protection: Visit:www.belchimusa.com Belchim Crop Protection USA, LLC 2751 Centerville Road | Suite 100 Wilmington, DE 19808 Phone: 855-445-7990 Email: info.usa@belchim.com • PROVIDES Uniform Penetration and Lateral Movement of Water • ENCOURAGES Improved Rooting and Nutrient Uptake • IMPROVES Distribution and E ectiveness of Soil Applied Chemicals • SAVES WATER - Reduces Irrigation Requirements by Up To 25% Other Innovative Products From Belchim Crop Protection: Visit:www.belchimusa.com Do
Less Water! Integrate® 80+ ENHANCES WATER MOVEMENT and Gets MORE Applied Water To The Rootzone, and LESS To Run O and Evaporation.
More With


Subscribe at MyAgLife.com or Download the MyAgLife App to Play in Your Vehicle Scan to Download
new-age microscopic imaging methods showed that the base of trichomes was a key area for the uptake of foliar zinc in sunflower leaves, and other specific cell types directly above major veins was the primary uptake site of foliar phosphorus in barley leaves.
It is worth noting that much of what we know regarding cuticular transport of plant nutrients was derived from studies using isolated plant cuticles (enzymatically isolated from leaves.) Such a model system has its drawbacks, and artifacts can occur. For example, some studies comparing isolated cuticles to intact leaves did not yield consistent results for transport. This is why real-world studies with natural plant canopies under production conditions are needed to provide practical data on efficacy of foliar fertilizers. Numerous other factors not discussed here can also influence the success of foliar fertilization, which makes generalized recommendations difficult.
Foliar Nutrient Trials in Oregon Vineyards
My lab has conducted a number of foliar nutrient trials, and I will briefly share some of our findings. We have conducted three different trials using foliar urea-N for the specific purpose of boosting fruit or must YAN levels. Two experiments were conducted in Pinot noir and one in Chardonnay. These trials have shown that foliar urea is an effective tool to boost YAN (Table 2), and it has the advantage over soil-applied N in that canopy growth is not increased (a clear benefit
for improving YAN in high-vigor sites.)
We also conducted a P trial years ago at two Pinot noir vineyards in the Willamette Valley. P was applied in three foliar sprays at a moderate dose, and leaf blade and petiole P status was improved at only one of the two sites. The increase in leaf blade P concentration at one site at veraison was only about 12%, and I concluded there was little benefit to spraying vines with foliar P (data not shown).
Currently, as part of the High-Resolution Vineyard Nutrition Management (highresvineyardnutrition.com/project), we are testing a foliar potassium treatment along with two rates of soil-applied K to correct a low K Pinot noir vineyard, and we are assessing two rates of foliar magnesium to correct a low Mg Pinot noir vineyard.
In the K trial, we are comparing a foliar K product (K-Metalosate, Albion Labs, Layton, Utah) at the highest label rate using three sprays per year (total = 3.3 pounds K/acre) with fairly high doses of soil K (K 2SO4) at either 188 or 369 pounds K/ acre applied in spring. Results from year 1 of this trial showed no increase in leaf or petiole K status at bloom or veraison, nor any impacts of K on growth or yield as well as must sugars, pH or TA. However, K levels in dormant-season canes (pruning wood samples) were slightly improved by all three K treatments compared to the no-K control. In year 2, leaf and petiole K status at bloom was increased in the soil K treatments, more
so by the high rate, but not in the foliar K vines. Veraison leaf and petiole nutrients and pruning wood nutrients have yet to be analyzed for year 2, but similar to last year, no effects on growth or yield as well as must sugars, pH or TA were apparent due to K treatments (data not shown).
In the Mg trial, we are testing foliar sprays using MgSO4 (Epsom salt) because an earlier trial my lab conducted in the Willamette Valley with soil-applied MgSO4 at a high rate was unsuccessful. We are comparing foliar sprays of MgSO4 at 10 or 20 pounds/acre using three sprays (supplying a total of 3 or 6 pounds Mg/acre). The high rate of Mg increased leaf blade Mg levels at veraison in year 1 but did not alter petiole Mg levels as we found before. Both the low and high rates of foliar Mg reduced the number of leaves with Mg deficiency symptoms by more than 75% around harvest time in both years (Figure 1, see page 30). However, Mg applications did not affect growth or yield as well as must sugars, pH or TA thus far.
In conclusion, foliar feeding of plant nutrients has its place in vineyard management, and certain foliar nutrients are effective in improving nutritional health of grapevines. This is especially true for micronutrients, notably B and zinc. Of the macronutrients, both Mg and urea-N have been effective in alleviating Mg deficiency or in boosting must YAN levels. Foliar applications of P and K have proven less effective so far. Caution is warranted when considering the myriad of foliar products that are being marketed to you as grape growers, and this is because we still have much to learn about how and when foliar-applied nutrients will be effective. A key question you should ask yourself when considering foliar nutrition is whether you have a deficiency or other problem that needs to be fixed. This is where money spent on tissue sampling for nutrients and tracking vine nutrient status over years will pay for itself in the long run. Prophylactic use of foliar fertilizers, except perhaps for B, is generally not a good idea.
Comments about this article? We want to hear from you. Feel free to email us at article@jcsmarketinginc.com
34 Progressive Crop Consultant March / April 2023
Table 2 Vineyard Years Urea rate in spray Foliar N applied (lb/ac) Veraison Leaf N% Yield (ton/ ac) Must YAN (mg N/L) Prn Wts g/vine Pinot A 1yr only 2013 0 0 1.99 a 7.5 93 a 1099 0.8% - 4 apps 12 2.24 b 6.9 172 b 1203 Chard A 2yr mean 2017-20 18 0 0 1.69 4.7 62 a 430 0.8% - 3 apps 21 1.79 4.6 112 b 393 Pinot B 3yr mean 2018-20 19 0 0 1.97 3.5 138 a 363 0.8% - 3 apps 21 2.06 3.5 222 b 369
ContinuedfromPage32
Table 2. Summary of foliar urea trials conducted in western Oregon vineyards.
March / April 2023 www.progressivecrop.com 35 Maximize Your Yields in 2023 Contact Ben Letizia for more information 559-284-1392 or benl@kimc1.com © 2023 Kim-C1, LLC. Kimzall is a registered trademark of Kim-C1, LLC Don’t expect Mother Nature to do all of the work, let Kimzall® take your crop to the next level! Whether you’re dealing with grapes, kiwis or blueberries, Kimzall® will maximize both the yield and quality of your crop. with the Proven Power of Kimzall® Plant Growth Regulator

Boost your pest control with NEW Senstar® Insecticide from Valent U.S.A. With two effective modes of action, Senstar provides stellar control against soft-bodied insects, protecting citrus groves from California red scale and vegetables from aphids and whiteflies. Quickly eliminate harmful insects at all life stages — including eggs — with the next-level power of Senstar. Contact your PCA or visit Valent.com/Senstar to learn more. Products That Work, From People Who Care® | valent.com | 800-6-VALENT (682-5368) Always read and follow label instructions. Products That Work, From People Who Care and Senstar are registered trademarks of Valent U.S.A. LLC. ©2022 Valent U.S.A. LLC. All rights reserved. NEW FAST-ACTING INSECTICIDE FOR VEGETABLES AND CITRUS NOW APPROVED FOR USE IN CALIFORNIA BOOST YOUR PEST CONTROL Learn More Scan Code to
