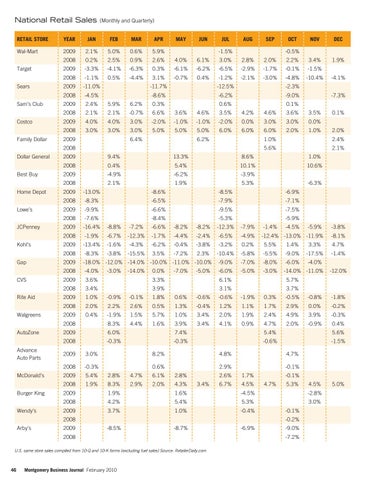
National Retail Sales
(Monthly and Quarterly)
RETAIL STORE
YEAR
JAN
FEB
MAR
APR
Wal-Mart
2009
2.1%
5.0%
0.6%
5.9%
2008
0.2%
2.5%
0.9%
2.6%
4.0%
6.1%
3.0%
2.8%
2.0%
2.2%
2009
-3.3%
-4.1%
-6.3%
0.3%
-6.1%
-6.2%
-6.5%
-2.9%
-1.7%
-0.1%
-1.5%
2008
-1.1%
0.5%
-4.4%
3.1%
-0.7%
0.4%
-1.2%
-2.1%
-3.0%
-4.8%
-10.4%
2009
-11.0%
2008
-4.5%
2009
2.4%
5.9%
6.2%
2008
2.1%
2.1%
-0.7%
6.6%
3.6%
4.6%
3.5%
4.2%
4.6%
3.6%
3.5%
2009
4.0%
4.0%
3.0%
-2.0%
-1.0%
-1.0%
-2.0%
0.0%
3.0%
3.0%
0.0%
2008
3.0%
3.0%
3.0%
5.0%
5.0%
5.0%
6.0%
6.0%
6.0%
2.0%
1.0%
Target Sears Sam’s Club Costco Family Dollar
2009
MAY
JUN
JUL
AUG
-1.5%
-11.7%
-12.5%
-2.3%
-8.6%
-6.2%
-9.0%
0.3%
0.6%
0.1%
6.4%
Best Buy
2009
6.2%
9.4%
Lowe’s JCPenney Kohl’s Gap CVS Rite Aid Walgreens AutoZone Advance Auto Parts McDonald’s Burger King Wendy’s
1.9%
5.4%
10.1%
-6.2%
-3.9%
1.9%
-4.1% -7.3% 0.1% 2.0%
1.0%
2.4%
5.6%
2.1% 10.6%
0.4% -4.9%
5.3%
-6.3%
2009
-13.0%
-8.6%
-8.5%
-6.9%
2008
-8.3%
-6.5%
-7.9%
-7.1%
2009
-9.9%
-6.6%
-9.5%
-7.5%
2008
-7.6%
-8.4%
-5.3%
-5.9%
2009
-16.4%
-8.8%
-7.2%
-6.6%
-8.2%
-8.2%
-12.3%
-7.9%
-1.4%
-5.9%
-3.8%
2008
-1.9%
-6.7%
-12.3%
-1.7%
-4.4%
-2.4%
-6.5%
-4.9%
-12.4% -13.0% -11.9%
-8.1%
2009
-13.4%
-1.6%
-4.3%
-6.2%
-0.4%
-3.8%
-3.2%
0.2%
5.5%
1.4%
3.3%
4.7%
2008
-8.3%
-3.8%
-15.5%
3.5%
-7.2%
2.3%
-10.4%
-5.8%
-5.5%
-9.0%
-17.5%
-1.4%
2009
-18.0% -12.0% -14.0% -10.0% -11.0% -10.0%
-9.0%
-7.0%
-8.0%
-6.0%
-4.0%
2008
-4.0%
-6.0%
-5.0%
-3.0%
-14.0% -11.0%
2009
3.6%
3.3%
6.1%
5.7%
2008
3.4%
3.9%
3.1%
3.7%
2009
1.0%
2008 2009
-3.0%
-14.0%
0.0%
-7.0%
-5.0%
-4.5%
-12.0%
-0.9%
-0.1%
1.8%
0.6%
-0.6%
-0.6%
-1.9%
0.3%
-0.5%
-0.8%
-1.8%
2.0%
2.2%
2.6%
0.5%
1.3%
-0.4%
1.2%
1.1%
1.7%
2.9%
0.0%
-0.2%
0.4%
-1.9%
1.5%
5.7%
1.0%
3.4%
2.0%
1.9%
2.4%
4.9%
3.9%
-0.3%
2008
8.3%
4.4%
1.6%
3.9%
3.4%
4.1%
0.9%
4.7%
2.0%
-0.9%
0.4%
2009
6.0%
7.4%
5.4%
5.6%
2008
-0.3%
-0.3%
-0.6%
-1.5%
2009
3.0%
8.2%
4.8%
2008
-0.3%
2009
5.4%
2.8%
4.7%
6.1%
2.8%
2008
1.9%
8.3%
2.9%
2.0%
4.3%
0.6%
4.7%
2.9% 2.6% 3.4%
6.7%
-0.1% 1.7% 4.5%
-0.1% 4.7%
5.3%
4.5%
2009
1.9%
1.6%
-4.5%
-2.8%
2008
4.2%
5.4%
5.3%
3.0%
2009
3.7%
1.0%
-0.4%
2009
-0.1% -0.2%
-8.5%
-8.7%
2008 U.S. same store sales compiled from 10-Q and 10-K forms (excluding fuel sales) Source: RetailerDaily.com
46
3.4%
1.0%
2008 Arby’s
DEC
8.6%
2009
2.1%
NOV
13.3%
2008 2008 Home Depot
OCT -0.5%
2008 Dollar General
SEP
Montgomery Business Journal February 2010
-6.9%
-9.0% -7.2%
5.0%