Chapter 3—Population, Housing, and Land Use Trends
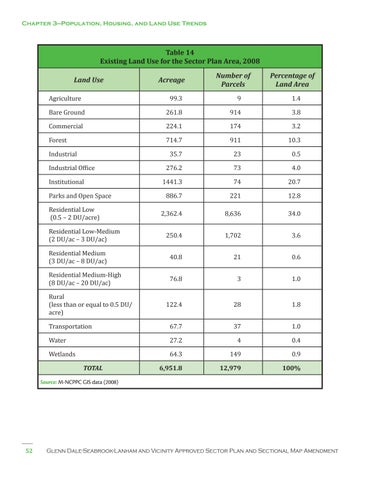
Table 14 Existing Land Use for the Sector Plan Area, 2008 Land Use Agriculture
Acreage 99.3
Number of Parcels
Percentage of Land Area
9
1.4
174
3.2
Bare Ground
261.8
914
Forest
714.7
911
10.3
73
4.0
Commercial Industrial
Industrial Office
224.1 35.7
276.2
23
Institutional
1441.3
Residential Low (0.5 – 2 DU/acre)
2,362.4
8,636
Residential Medium (3 DU/ac – 8 DU/ac)
40.8
21
Parks and Open Space Residential Low-Medium (2 DU/ac – 3 DU/ac)
Residential Medium-High (8 DU/ac – 20 DU/ac)
886.7
250.4
76.8
74
3.8
0.5
20.7
221
12.8
1,702
3.6
3
34.0
0.6
1.0
Rural (less than or equal to 0.5 DU/ acre)
122.4
28
1.8
Water
27.2
4
0.4
Transportation Wetlands
TOTAL
67.7
64.3
6,951.8
37
149
12,979
1.0
0.9
100%
Source: M-NCPPC GIS data (2008)
52
Glenn Dale-Seabrook-Lanham and Vicinity Approved Sector Plan and Sectional Map Amendment