Results of Operations
Condensed Statement of Revenues, Expenses, and Changes in Net Position (Million $)
2023 2022 2021
2023 Dollar Change 2022 Dollar Change
in (for)
Totals may not foot due to rounding.
Totals may not foot due to rounding.
may not foot due to rounding.
Operating Revenue s
Operating Revenue s
Operating Revenue s
Long-term power sales revenue for 2023 was $178 million compared to $182 million and $184 million in 2022 and 2021, respectively. The 2023 long-term power sales revenue was less than 2 percent lower than in 2022, due to decrease in energy sales In 2023, MRES did implement time of use rates. The 2022 long-term power sales revenue was less than a percent lower than in 2021, due to a 5 percent decrease in rates offset by an increase in demand and energy sales. The average rate for longterm power sales to members was approximately 5.6 cents per kilowatt-hour (kWh) in 2023 and 2022 compared to 5.9 cents per kWh in 2021
Long-term power sales revenue for 2023 was $178 million compared to $182 million and $184 million in 2022 and 2021, respectively. The 2023 long-term power sales revenue was less than 2 percent lower than in 2022, due to decrease in energy sales In 2023, MRES did implement time of use rates. The 2022 long-term power sales revenue was less than a percent lower than in 2021, due to a 5 percent decrease in rates offset by an increase in demand and energy sales. The average rate for longterm power sales to members was approximately 5.6 cents per kilowatt-hour (kWh) in 2023 and 2022 compared to 5.9 cents per kWh in 2021
Long-term power sales revenue for 2023 was $178 million compared to $182 million and $184 million in 2022 and 2021, respectively. The 2023 long-term power sales revenue was less than 2 percent lower than in 2022, due to decrease in energy sales In 2023, MRES did implement time of use rates. The 2022 long-term power sales revenue was less than a percent lower than in 2021, due to a 5 percent decrease in rates offset by an increase in demand and energy sales. The average rate for longterm power sales to members was approximately 5.6 cents per kilowatt-hour (kWh) in 2023 and 2022 compared to 5.9 cents per kWh in 2021.
The 2023 short-term power sales revenue was $21 million compared to $43 million in both 2022 and 2021 The decrease in revenue in 2023 was due to $6 million of deferred revenue being recognized in 2022 along with a decrease in megawatt hours (MWh) sold and lower market prices.
The 2023 short-term power sales revenue was $21 million compared to $43 million in both 2022 and 2021 The decrease in revenue in 2023 was due to $6 million of deferred revenue being recognized in 2022 along with a decrease in megawatt hours (MWh) sold and lower market prices.
The 2023 short-term power sales revenue was $21 million compared to $43 million in both 2022 and 2021 The decrease in revenue in 2023 was due to $6 million of deferred revenue being recognized in 2022 along with a decrease in megawatt hours (MWh) sold and lower market prices.
The revenue received for transmission services was $61 million in both 2023 and 2022 compared to $59 million in 2021.
The revenue received for transmission services was $61 million in both 2023 and 2022 compared to $59 million in 2021
The revenue received for transmission services was $61 million in both 2023 and 2022 compared to $59 million in 2021.
Other operating income in 2023 was $1.3 million compared to $0.1 million in 2022 and $1.2 million in 2021 The increase in other operating revenue in 2023 was due to an increase in capacity sales The decrease in other operating revenue in 2022 was due to tax credits for refined coal received from Missouri Basin Power Project (MBPP) being discontinued during 2021
Other operating income in 2023 was $1.3 million compared to $0.1 million in 2022 and $1.2 million in 2021 The increase in other operating revenue in 2023 was due to an increase in capacity sales. The decrease in other operating revenue in 2022 was due to tax credits for refined coal received from Missouri Basin Power Project (MBPP) being discontinued during 2021
Other operating income in 2023 was $1.3 million compared to $0.1 million in 2022 and $1.2 million in 2021. The increase in other operating revenue in 2023 was due to an increase in capacity sales. The decrease in other operating revenue in 2022 was due to tax credits for refined coal received from Missouri Basin Power Project (MBPP) being discontinued during 2021
Operating Expenses and Net
Operating Expenses and Net
Operating Income
Operating Income
Operating Expenses and Net Operating Income
Fuel expense for 2023 was $23 million compared to the $31 million and $24 million in 2022 and 2021, respectively. The lower fuel expense in 2023 compared to 2022 and 2021 was largely due to decreased generation at Laramie River Station (LRS), offset by the increased generation at Exira Station (Exira). The decrease in generation at LRS was due to an outage at the end of the year. The higher fuel expense in 2022 compared to 2021 was largely due to increased generation at Laramie River Station (LRS) and Exira Station (Exira). The increased generation was due to market prices being higher than the cost of generation for more hours in 2022 than in 2021 The average fuel cost for LRS was 4 percent higher in 2023 compared to 2022 and remained the same in 2022 and 2021 The 2023 generation at LRS was approximately 1.0 million Megawatt hours (MWh) compared to 1.2 million and 1.1 million MWh in 2022 and 2021, respectively The average cost of fuel for Exira decreased by 62 percent in 2023 compared to 2022, the decrease is due to the decrease in natural gas costs. The generation at Exira was approximately 231,000 MWh, 157,000 MWh, and 125,000 MWh in 2023, 2022, and 2021, respectively.
Fuel expense for 2023 was $23 million compared to the $31 million and $24 million in 2022 and 2021, respectively The lower fuel expense in 2023 compared to 2022 and 2021 was largely due to decreased generation at Laramie River Station (LRS), offset by the increased generation at Exira Station (Exira). The decrease in generation at LRS was due to an outage at the end of the year. The higher fuel expense in 2022 compared to 2021 was largely due to increased generation at Laramie River Station (LRS) and Exira Station (Exira). The increased generation was due to market prices being higher than the cost of generation for more hours in 2022 than in 2021 The average fuel cost for LRS was 4 percent higher in 2023 compared to 2022 and remained the same in 2022 and 2021. The 2023 generation at LRS was approximately 1.0 million Megawatt hours (MWh) compared to 1.2 million and 1.1 million MWh in 2022 and 2021, respectively. The average cost of fuel for Exira decreased by 62 percent in 2023 compared to 2022, the decrease is due to the decrease in natural gas costs. The generation at Exira was approximately 231,000 MWh, 157,000 MWh, and 125,000 MWh in 2023, 2022, and 2021, respectively.
Fuel expense for 2023 was $23 million compared to the $31 million and $24 million in 2022 and 2021, respectively The lower fuel expense in 2023 compared to 2022 and 2021 was largely due to decreased generation at Laramie River Station (LRS), offset by the increased generation at Exira Station (Exira). The decrease in generation at LRS was due to an outage at the end of the year. The higher fuel expense in 2022 compared to 2021 was largely due to increased generation at Laramie River Station (LRS) and Exira Station (Exira). The increased generation was due to market prices being higher than the cost of generation for more hours in 2022 than in 2021. The average fuel cost for LRS was 4 percent higher in 2023 compared to 2022 and remained the same in 2022 and 2021 The 2023 generation at LRS was approximately 1.0 million Megawatt hours (MWh) compared to 1.2 million and 1.1 million MWh in 2022 and 2021, respectively The average cost of fuel for Exira decreased by 62 percent in 2023 compared to 2022, the decrease is due to the decrease in natural gas costs. The generation at Exira was approximately 231,000 MWh, 157,000 MWh, and 125,000 MWh in 2023, 2022, and 2021, respectively.
Purchased power expense was $93 million for both 2023 and 2022, which was 6 percent lower than in 2021 ($99 million). The decrease in 2023 and 2022 purchased power expense compared to 2021 was due to lower market prices.
Purchased power expense was $93 million for both 2023 and 2022, which was 6 percent lower than in 2021 ($99 million). The decrease in 2023 and 2022 purchased power expense compared to 2021 was due to lower market prices.
Purchased power expense was $93 million for both 2023 and 2022, which was 6 percent lower than in 2021 ($99 million). The decrease in 2023 and 2022 purchased power expense compared to 2021 was due to lower market prices.
The other power supply operation and maintenance (O&M) expense was $21 million, compared to the 2022 expense of $26 million and the 2021 expense of $34 million The decrease in 2023 other power supply O&M expense was due to lower fixed O&M expenses for Marshall Wind Farm (MWF) and a decrease in natural gas cost, offset by a decrease in
The other power supply operation and maintenance (O&M) expense was $21 million, compared to the 2022 expense of $26 million and the 2021 expense of $34 million. The decrease in 2023 other power supply O&M expense was due to lower fixed O&M expenses for Marshall Wind Farm (MWF) and a decrease in natural gas cost, offset by a decrease in socialization
The other power supply operation and maintenance (O&M) expense was $21 million, compared to the 2022 expense of $26 million and the 2021 expense of $34 million. The decrease in 2023 other power supply O&M expense was due to lower fixed O&M expenses for Marshall Wind Farm (MWF) and a decrease in natural gas cost, offset by a decrease in socialization
See accompanying independent auditors’ report.
See accompanying independent auditors’ report
socialization Operating Revenues $ 261 $ 287 $ 287 $ (26) $Operating Expenses 222 236 232 (14) 4 Operating Income 39 51 55 (12) (4) Investment and Other Income 17 10 9 7 1 Interest Expense (25) (25) (26) - 1 Other Non-operating (Expenses) Income 3 (22) (9) 25 (13) Net costs recoverable in (for) future years (4) 18 6 (22) 12 Increase in Net Position, before Capital Contributions 30 32 35 (2) (3) Capital contributions 1 - - 1Change in Net Position 31 32 35 (1) (3) Ending Net Position $ 460 $ 429 $ 397 $ 31 $ 35 2023 2022 2021
2023 Dollar Change 2022 Dollar Change See accompanying independent auditors’ report
Expenses, and Changes in Net Position (Million $)
Results of Operations Condensed Statement of Revenues,
Operating Revenues $ 261 $ 287 $ 287 $ (26) $Operating Expenses 222 236 232 (14) 4 Operating Income 39 51 55 (12) (4) Investment and Other Income 17 10 9 7 1 Interest Expense (25) (25) (26) - 1 Other Non-operating (Expenses) Income 3 (22) (9) 25 (13) Net costs recoverable in (for) future years (4) 18 6 (22) 12 Increase in Net Position, before Capital Contributions 30 32 35 (2) (3) Capital contributions 1 - - 1Change in Net Position 31 32 35 (1) (3) Ending Net Position $ 460 $ 429 $ 397 $ 31 $ 35 2023 2022 2021 Totals
2023 Dollar Change 2022 Dollar Change
Statement of Revenues, Expenses, and Changes in Net Position (Million $)
Results of Operations Condensed
Operating Revenues $ 261 $ 287 $ 287 $ (26) $Operating Expenses 222 236 232 (14) 4 Operating Income 39 51 55 (12) (4) Investment and Other Income 17 10 9 7 1 Interest Expense (25) (25) (26) - 1 Other Non-operating (Expenses) Income 3 (22) (9) 25 (13) Net costs recoverable
future years (4) 18 6 (22) 12 Increase in Net Position, before Capital Contributions 30 32 35 (2) (3) Capital contributions 1 - - 1Change in Net Position 31 32 35 (1) (3) Ending Net Position $ 460 $ 429 $ 397 $ 31 $ 35
2023 Financials 40
received from MBPP and increase in fixed O&M expenses for LRS. The decrease in 2022 other power supply O&M expense was due to lower fixed O&M expenses for MWF and an increase in socialization received from MBPP, offset by an increase in natural gas costs.
All other operating expenses totaled $85 million in 2023 and $86 million and $75 million in 2022 and 2021, respectively. The increase in 2022 was due to an increase in depreciation and amortization expenses and an increase in administrative and general expenses. The increase in depreciation and amortization expenses is largely due to the Red Rock Hydroelectric Project being fully operational in June 2021 The increase in administrative and general expenses is largely due to the administration fees for MBPP.
Net operating income was $39 million in 2023 compared to $52 million and $55 million in 2022 and 2021, respectively.
Non- operating Revenues and Expenses
For the year ended December 31, 2023, non-operating expenses exceeded non-operating revenues by $10 million, compared to $19 million in both 2022 and 2021. The lower net non-operating expense for 2023 compared to 2022 and 2021 was due to an increase in investment income and a decrease in other expense.
Other income totaled $6 million in 2023, 2022 and 2021.
Investment income totaled $10 million in 2023 compared to $4 million in 2022 and $3 million in 2021 The increase in investment income for 2023 compared to 2022 was an increase in investment yields and a slight increase in cash and investments
Other expense totaled $7 million in 2023 compared to $9 million in 2022 and $5 million in 2021. The decrease in other expense for 2023 compared to 2022 was due to a refund to the Northern Cities Group (NCG) members of $4.2 million in 2022, offset by the recognition of project development costs for the abandoned Gregory County Pumped Storage Project. The increase in other expense for 2022 compared to 2021 was due to a refund to the NCG members of $4.2 million.
Interest expenses were $25 million in 2023 and $26 million both 2022 and 2021 The decrease in 2023 compared to 2022 was due to scheduled principal payments and no additional debt being issued. During 2023, depreciation and amortization expense exceeded debt principal requirements plus amortization of debt-related costs and premium for related assets by approximately $3 million. During 2022, depreciation and amortization expense exceeded debt principal requirements plus amortization of debt-related costs and premium for related assets by $4 million. During 2021, debt principal requirements plus amortization of debt-related costs and premium exceeded depreciation and amortization expense by $0.8 million The difference between debt principal requirements plus amortization of debt-related costs and premium, and depreciation and amortization, and the deferral of unrealized gain or loss on investments reflects MRES and WMMPA utilizing the accrual basis of accounting and following the provisions of Government Accounting Standards Board (GASB) No. 62 Regulated Operations, which conforms to Accounting Standards Codification No. 980, Accounting for the Effects of Certain Types of Regulation. In general, GASB 62 relates to the deferral of revenues and expenses to or from future periods to the period that revenues are expected to be earned or expenses are expected to be recovered through the rates charged to its members The unrealized gain on investments totaled $8 million in 2023, compared to the unrealized loss on investments of $14 million in 2022 and $5 million in 2021. The reason for the unrealized gain is 2023 is due to the favorable market compared to the volatile market in 2022.
Capital Contribution
The capital contributions totaled $1 million in 2023, there was not capital contributions in 2022 and 2021. The total is due to the FEMA grant money received for storm damage done to Elbow Lake Substation.
Change in Net Position
The change in net position was $31 million, $32 million, and $36 million in 2023, 2022, and 2021, respectively. The 2023 change in net position was $9 million higher than budget The favorable variance compared to budget is due to higher surplus sales, lower purchase power expenses, lower transmission expenses, higher investment income, offset by higher fuel and maintenance expenses and lower transmission revenues.
This financial report is designed to provide members, investors, and creditors with a general overview of the finances of MRES and WMMPA. Questions concerning any of the information provided in this report or requests for additional financial information, should be addressed to: Missouri River Energy Services, 3724 West Avera Drive, Sioux Falls, SD 57108-5750.
See accompanying independent auditors’ report
2023 Financials 41
Missouri Basin Municipal Power Agency dba Missouri River Energy Services and Western Minnesota Municipal Power Agency Combined Statements of Net Position
AND DEFERRED OUTFLOWS OF RESOURCES:
ASSETS
2023 2022 (thousands of dollars) Current Assets: Cash and cash equivalents
Restricted $ 50,369 $ 52,061 Unrestricted 15,269 12,450 Total cash and cash equivalents 65,638 64,511 Short-term investments
Restricted 7,093 17,468 Unrestricted 148,867 51,127 Total short-term investments 155,960 68,595 Accounts receivable 23,501 24,579 Advances to Missouri Basin Power Project (MBPP) (Note 7) 6,925 4,805 Fuel stock 9,777 6,170 Materials and supplies 6,150 5,972 Prepayments and other current assets (Note 2) 16,694 15,667 Total Current Assets 284,645 190,299 Non-Current Assets: Long-term investments
Restricted 36,090 25,484 Unrestricted 130,320 222,792 Total long-term investments 166,410 248,276 Capital assets (Note 8): Utility plant in service 1,003,252 985,153 Less-accumulated depreciation (321,445) (303,145) Net utility plant in service 681,807 682,008 Construction work in progress 33,989 17,362 Net capital assets 715,796 699,370 Advances for mine development (Note 7) 515 677 Unamortized debt expense - regulatory asset 2,965 3,386 Other non-current assets (Note 9) 6,310 9,008 Total Assets 1,176,641 1,151,016 Deferred Outflows of Resources: Asset Retirement Obligations 3,272 3,769 Unamortized loss on reacquired debt 8,916 8,062 Total Deferred Outflows of Resources 12,188 11,831 TOTAL ASSETS AND DEFERRED OUTFLOWS OF RESOURCES $ 1,188,829 $ 1,162,847
combined financial statements
statements. 2023 Financials 42
DECEMBER 31
(Note 5):
(Note 5):
(Note 5):
The accompanying notes to the
are an integral part of these
Missouri Basin Municipal Power Agency dba Missouri River Energy Services and Western Minnesota Municipal Power Agency
Combined Statements of Net Position DECEMBER 31
DEFERRED INFLOWS OF RESOURCES AND NET
The accompanying notes to the combined financial statements are an integral part of these statements.
LIABILITIES,
POSITION: 2023 2022 (thousands of dollars) Current
Accounts payable - unrestricted $ 14,832 $ 8,994 Accrued taxes 2,859 2,975 Current liabilities payable from restricted assets: Accounts payable - restricted 13,582 14,594 Current maturities of revenue bonds (Note 10) 13,730 14,255 Accrued interest 12,361 12,029 Total Current Liabilities 57,364 52,847 Non-Current Liabilities: Revenue bonds: Principal outstanding 569,535 583,265 Unamortized debt premium 12,658 14,656 Revenue Bonds, excluding current maturities (Note 10) 582,193 597,921 Asset retirement obligation (Note 2) 12,626 9,597 Other non-current liabilities 172 732 Total Non-Current Liabilities 594,991 608,250 Total Liabilities 652,355 661,097 Deferred Inflows of Resources: Revenues collected for future costs - regulatory credit 72,793 68,130 Accumulated change in fair value of hedging derivatives 3,515 4,301 Total Deferred Inflows of Resources 76,308 72,431 TOTAL LIABILITIES AND DEFERRED INFLOWS OF RESOURCES 728,663 733,528 Net Position: Net investment in capital assets 131,754 98,642 Restricted: Debt service 53,317 54,365 Capital additions 128 205 Other 14,164 13,820 Total Restricted 67,609 68,390 Unrestricted 260,803 262,287 Total Net Position 460,166 429,319 TOTAL LIABILITIES, DEFERRED INFLOWS OF RESOURCES AND NET POSITION $ 1,188,829 $ 1,162,847
Liabilities:
2023 Financials 43
Missouri Basin Municipal Power Agency dba Missouri River Energy Services and Western Minnesota Municipal Power Agency
Combined Statements of Revenues, Expenses and Changes in Net Position The accompanying notes to the
(Notes 3 and 12):
2023 2022 (thousands of dollars) Operating Revenues
Long-term power sales $ 178,056 $ 182,202 Short-term power sales 21,374 43,366 Transmission services 61,063 61,393 Other operating income 1,320 104 Total Operating Revenues 261,813 287,065 Operating Expenses: Fuel 23,080 31,176 Purchased power 93,094 92,677 Other power supply operation and maintenance 20,852 25,825 Depreciation and amortization 19,841 19,530 Transmission operation and maintenance 41,558 43,616 Customer information and collections 231 202 Administrative and general 20,392 19,028 Property taxes 3,427 3,469 Total Operating Expenses 222,475 235,523 Operating Income 39,338 51,542 Non-Operating Revenues (Expenses): Investment income 9,679 3,953 Other income 6,424 6,382 Other expense (6,827) (8,885) Interest expense (24,722) (25,548) Amortization of financing related costs and premium 2,435 1,102 Unrealized gain (loss) on investments 7,800 (13,787) Net costs recoverable in (for) future years: Depreciation and amortization in excess of (lower than) principal and amortization of debt related costs and premium 3,137 3,682 Unrealized gain (loss) on investments (7,800) 13,788 Total Non-Operating Expenses (9,874) (19,313) Increase in net position, before capital contributions 29,464 32,229 Capital contributions 1,383Change in Net Position 30,847 32,229 Net Position: Beginning of year 429,319 397,090 End of year $ 460,166 $ 429,319
2023 Financials 44
combined financial statements are an integral part of these statements. YEARS ENDED DECEMBER 31
SOURCES
2023 OF REVENUE USES 2023 OF REVENUE
2023 Financials 45
Missouri Basin Municipal Power Agency dba Missouri River Energy Services and Western Minnesota Municipal Power Agency
Combined Statements of Cash Flow
The accompanying notes to the combined financial statements are an integral part of these statements.
2023 2022 Cash Flows From (Used For) Operating Activities: (thousands of dollars) Received from members and others $ 269,315 $ 285,407 Paid to suppliers for goods and services (194,125) (219,306) Paid to employees for operating payroll (14,038) (13,108) Net Cash Flows From Operating Activities 61,152 52,993 Cash Flows From (Used For) Capital and Related Financing Activities: Net additions to utility plant (33,842) (13,075) Federal Emergency Management Agency grant 1,383Bond issuance costs - (630) Deposits to escrow account lower than bonds defeased - 586 Advances for mine development - (114) Mine development repayments 222 321 Net advances for solar project 60 61 Revenue bond payments (14,255) (13,645) Interest paid on revenue bonds (24,390) (26,576) Other (667) (2,075) Net Cash Flows Used For Capital and Related Financing Activities (71,489) (55,147) Cash Flows From (Used For) Investing Activities: Proceeds from maturity and sale of investment securities 109,116 156,239 Purchase of investment securities (106,814) (162,103) Investment income received 9,162 3,476 Net Cash Flows From (Used For) Investing Activities 11,464 (2,388) Net Change in Cash and Cash Equivalents 1,127 (4,542) Cash and Cash Equivalents, Beginning of Year 64,511 69,053 Cash and Cash Equivalents, End of Year $ 65,638 $ 64,511 YEARS ENDED DECEMBER 31 2023 Financials 46
Missouri Basin Municipal Power Agency dba Missouri River Energy Services and Western Minnesota Municipal Power Agency
Combined Statements of Cash Flow The accompanying notes
Reconciliation of Operating Income to Net Cash Flows From Operating Activities:
to reconcile operating income to net cash flows from operating activities:
Reconciliation of Cash and Cash Equivalents to Statement of Net Position:
YEARS ENDED DECEMBER 31
2023 2022
of dollars) Operating income $ 39,338 $ 51,542 Adjustments
Depreciation and amortization 19,841 19,530 Advance funds to Southwest Power Pool - (2,705) Write-off of deferred charges and other investments 1,994Sale (purchase) of renewable energy credits 72 (663) Member assessments and miscellaneous income 6,424 6,382 Other expenses (6,827) (8,885) Changes in assets and liabilities: Accounts receivable 1,078 (2,040) Advances to MBPP (2,180) 292 Fuel stock (3,607) 2,266 Materials and supplies (178) (1,061) Prepayments and other current assets (510) (960) Accounts payable and other non-current liabilities 5,823 (4,447) Recognition of revenue collected for future periods - (6,000) Accrued taxes (116) (258) Net Cash Flow From Operating Activities $ 61,152 $ 52,993
Cash and Cash Equivalents Restricted - Cash and cash equivalents $ 50,369 $ 52,061 Unrestricted - Cash and cash equivalents 15,269 12,450 Short-term Investments Restricted - Short-term investments 7,093 17,468 Unrestricted - Short-term investments 148,867 51,127 Long-term Investments: Restricted - Long-term investments 36,090 25,484 Unrestricted - Long-term investments 130,320 222,792 Total Cash and Investments 388,008 381,382 Less: Noncash Equivalents (322,370) (316,871) TOTAL CASH AND CASH EQUIVALENTS $ 65,638 $ 64,511 Supplemental disclosure of non-cash capital and related financing activities Change in capital asset acquisition included in accounts payable $ (1,557) $ 2,714 Change in fair market value of derivatives $ (787) $ 1,787 Gain on termination of interest rate swap $ - $ 4,168 Bond proceeds
Revenue Bonds $ - $ 6,280
(thousands
deposited into an escrow account for purposes of refunding:
combined financial statements
part
to the
are an integral
of these statements.
2023 Financials 47
1. ORGANIZATION
Missouri Basin Municipal Power Agency dba Missouri River Energy Services (MRES) is a body corporate and politic, organized under the laws of the State of Iowa. Membership consists of 61 municipalities in the states of Iowa, Minnesota, North Dakota, and South Dakota that own and operate utilities for the local distribution of electricity. Western Minnesota Municipal Power Agency (WMMPA) is a municipal corporation and political subdivision of the State of Minnesota. The WMMPA membership consists of 24 municipalities in the state of Minnesota. All WMMPA members are also members of MRES. WMMPA owns various coal-fired, natural gas-fired, oil-fired, hydroelectric, and wind generating facilities. WMMPA also owns varying interests in transmission facilities and a headquarters building Pursuant to a power supply contract, MRES purchases and WMMPA sells the WMMPA entitlement in its generation and transmission facilities. MRES in turn utilizes the output and capacity of these facilities and other resources to provide power supply and transmission services to members under terms of separate Long-term Power Sale Agreements (Notes 3 and 4). MRES and WMMPA are not rate-regulated by any federal or state authority or subject to federal or state income taxes. MRES performs all requested administrative services on behalf of WMMPA, which has no employees of its own, under an administrative services agreement The administrative services agreement expires January 1, 2057, to coincide with 59 of the 61 Power Sale Agreements. The agreement may be terminated thereafter by either party upon two years written notice. MRES and WMMPA are two separate entities reported as a combined enterprise. The entities coexist on an equal basis with both entities together providing holistic services to their members. WMMPA owns the assets and provides financing, while MRES operates the assets and provides services. Neither entity is subordinate to the other. Therefore, the financial statements of MRES and WMMPA are combined to provide fair and accurate representation of the entities
2. SIGNIFICANT ACCOUNTING POLICIES
A.
Accounting Method
The combined financial statements of MRES and WMMPA follow authoritative sources of United States ( U.S.) generally accepted accounting principles under the provisions of Governmental Accounting Standards Board (GASB) 76, The Hierarchy of Generally Accepted Accounting Principles for State and Local Governments MRES and WMMPA comply with all applicable GASB pronouncements, including the application of GASB 62, Codification of Accounting and Financial Reporting Guidance Contained in Pre-November 30, 1989 FASB and AICPA Pronouncements (GASB 62). MRES and WMMPA utilize the Federal Energy Regulatory Commission’s Uniform System of Accounts. Under GASB 62, MRES and WMMPA defer revenues and expenses for future recognition as they are recovered or returned through the rate-making process.
Net Position is classified into three components:
• Net investment in capital assets – This component consists of net capital assets reduced by the outstanding balances of revenue bonds attributable to the acquisition, construction, or improvement of capital assets If there are significant unspent related debt proceeds at year-end, the portion of the debt attributable to the unspent proceeds are not included in the calculation of net investment in capital assets. Rather, that portion of the debt is included in the same net position component as the unspent proceeds.
• Restricted – This component of net position consists of constraints imposed by the WMMPA Power Supply Revenue Bond Resolution (Bond Resolution) or other contract requirements, which include investments restricted by Board policies
• Unrestricted – This component consists of the portion of the net position of MRES and WMMPA that does not meet the definition of “restricted” or “net investments in capital assets.”
When both restricted and unrestricted resources are available for use, it is the policy of MRES and WMMPA to use restricted resources first, then unrestricted resources as they are needed.
B. Revenue Recognition
Revenue is accrued through the end of each month.
C. Operating Revenues and Expenses
MRES and WMMPA distinguish operating revenues and expenses from non-operating revenues and expenses. Operating revenues and expenses generally result from generating, purchasing, and transmitting electric power and energy The principal operating revenues of MRES are revenues from members and others for the generation, purchase, and transmission of electric power and energy
Operating expenses for MRES and WMMPA include the cost of generating, purchasing, and transmitting electric power and energy, administrative expenses, and depreciation on capital assets. All revenues and expenses not meeting this definition are reported as non-operating revenues and expenses. The other non-operating revenues include income from providing full-time distribution maintenance services for six MRES, member communities and one associate, and income received from the U.S. Treasury for the Build America Bonds The other non-operating expenses include expenses from providing full-time distribution maintenance services for six MRES member communities and one associate and a $4.2 million refund to Northern Cities Group members for transmission costs in April 2022. The $4.2 million is a one-time refund based on the percent of revenue received from each NCG member.
Missouri Basin Municipal Power Agency dba Missouri River Energy Services and Western Minnesota Municipal Power Agency Notes to Combined Financial Statements
2023 Financials 48
D. Capital Contributions
Capital contributions are federal grant money received from Federal Emergency Management Agency.
E. Utility Plant
Utility plant is stated at cost. MRES and WMMPA capitalize assets with a cost in excess of $1,000 and life of more than one year, with the exception of Missouri Basin Power Project (MBPP) assets, which are capitalized in excess of $10,000 The cost of utility plant retired plus the cost of removal less salvage is charged to accumulated depreciation. Repairs and maintenance of units of property are charged to operations. Construction work in progress (CWIP) mainly consists of transmission plant being constructed along with construction of a solar generation project.
F. Asset Retirement and Environmental Obligation
WMMPA adopted GASB 83, Certain Asset Retirement Obligations (GASB 83) effective January 1, 2019, for the retirement of all generating facilities except for MBPP. As a minority owner of MBPP, WMMPA had previously adopted Accounting Standards Codification (ASC) Section 410 Asset Retirement and Environmental Obligations (ASC 410) for MBPP. WMMPA recorded an Asset Retirement Obligations liability (ARO) for MBPP prior to January 1, 2019
The ARO under GASB 83 is for the closure of the Worthington Wind Project (WWP), Watertown Power Plant (WPP), and Marshall Wind Farm (MWF), to comply with contractual obligations, and are based on internal estimates. The estimated remaining useful lives for WWP, WPP, and MWF at December 31, 2023, were 4, 12, and 15 years, respectively. There is no required funding for the AROs for any of these assets
The ARO under ASC 410 for MBPP includes the estimated cost for the reclamation of wells, landfills, and coal ash ponds at Laramie River Station (LRS) The estimated cost was provided by the Operating Agent for MBPP, Basin Electric Power Cooperative (BEPC). The ARO for all owners of LRS was $47 million and $29 million at December 31, 2023 and 2022, respectively. WMMPA’s portion of the total was approximately $8 million and $5 million at December 31, 2023 and 2022, respectively
WMMPA’s asset retirement obligations activities as of and for the respective years ended December 31 are summarized below:
2023 2022
$
$ (thousands of dollars)
G. Depreciation
MRES and WMMPA utilize straight-line depreciation for all depreciable assets. The estimated service lives for capital assets are 25 to 52 years for generation plants, 40 to 60 years for transmission plants, 52 years for intangible plants, and 5 to 50 years for general plants Depreciation expense, expressed as a percent of depreciable utility plant in service, was 2.0 percent for both 2023 and 2022
H. Inventories
Fuel stock inventory, materials, and supplies are stated at weighted average cost.
I. Prepayments and Other Current Assets
Prepayments and other current assets include unamortized costs of expenses paid in advance for which the future benefits have yet to be realized. MRES and WMMPA recognize an expense or asset when such benefit is realized. Prepayments and other current assets consist of:
2023 2022
J. Investments
Collateral for energy market participation
expenses, i.e., insurance, inventory, and other expenses
Current portion of solar project prepayment 60
Current portion of MBPP mine development note receivable
Total prepayment and other current assets
$
$ (thousands of dollars)
Investment securities are stated at fair value based on quoted market prices or other observable inputs. Gains or losses on the sale of investment securities are recognized using the specific identification method. Unrealized gains or losses are deferred pursuant to GASB 62.
K. Derivative Instrument
Under GASB 53, Accounting and Financial Reporting for Derivative Instruments, the fair value of derivative instruments is to be reported in the financial statements. The derivative instruments recorded on WMMPA financial statements in other non-current assets are for interest rate swaps executed by WMMPA in 2020 and amended in 2021,
Balance, beginning
9,597
9,393 $ Additional obligations 3,134 1,544 Accretion 249 205 Liabilities settled (354) (1,545) Balance,
12,626
of year
$
end of year
9,597
7,355
7,355 $ Prepaid capacity purchases 1,413 1,821 MBPP prepayment and other assets 5,157 4,354 Interest receivable 1,529 1,012 Prepaid
1,019 844
$
60
49
161 221
16,694
15,667
2023 Financials
to hedge the interest rate risk for future refunding of outstanding bonds WMMPA terminated the interest rate swap related to the 2012 A Bonds when the 2022 A Bonds were issued See note 11 for further information.
L. Restricted Assets
Restricted assets consist of cash and investments required to be maintained or restricted by the Bond Resolution; the Assignment and Pledge Agreement among MRES, WMMPA, and the Agent Bank (Assignment and Pledge Agreement); and advances from others for specific projects Current liabilities payable from these restricted assets are also classified as restricted WMMPA is in compliance with all Bond Resolution funding requirements
M.
Deferred Outflow of Resources
A deferred outflow of resources represents a consumption of net position that applies to a future period and will not be recognized as an outflow of resources (expense) until that future time. The deferred outflows of resources include (1) AROs, and (2) the unamortized gain or loss on reacquired debt, which includes the unamortized gain on the interest rate swap.
N. Amortization
WMMPA unamortized debt-issuance costs and premiums are amortized over the term of the bonds. A regulatory asset is established under GASB 62 to recognize unamortized bond issuance costs for rate-making purposes Additionally, gains and losses resulting from the defeasance or early redemption of bonds are recorded as deferred outflow and amortized over the term of the new debt. WMMPA amortizes these amounts based on the straight-line method on each maturity, which approximates the effective interest rate method.
O. Compensated Absences
Employees are granted and accrue paid time-off in varying amounts in accordance with the MRES Human Resources Policies. Only compensated absences considered to be vested are accrued in these statements. Compensated absences of $2.1 million and $2.2 million were recorded in accounts payable at the end of December 31, 2023 and 2022, respectively
P. Deferred Inflow of Resources
A deferred inflow of resources represents an acquisition of net position that applies to a future period and therefore will not be recognized as an inflow of resources (revenue) until that future time. The deferred inflow of resources includes (1) the difference between debt principal collected in rates and depreciation expense; (2) unrealized gain or loss on investments; (3) amortization of financing-related costs and premium; (4) deferred revenue (which are all considered a regulatory credit under GASB 62) and (5) the estimated fair value of hedge derivative financial instruments
Q. Statements of Cash Flows
All highly liquid investments with an original maturity of three months or less are considered cash equivalents.
R. Use of Estimates
Management has made a number of estimates and assumptions relating to the reporting of assets, liabilities, revenues, and expenses to prepare these combined financial statements in conformity with accounting principles generally accepted in the U.S. Actual results could differ from the estimates. MRES participates in the Midcontinent Independent System Operator, Inc. (MISO) and the Southwest Power Pool (SPP) energy markets. MISO and SPP may true-up revenues and expenses from prior years. MRES accrues revenue and expenses that are known or estimated at the time of closing, but since there is such a long window for true-ups, actual results may differ from estimates.
S. Subsequent Events
MRES and WMMPA considered events for recognition or disclosure in the financial statements that occurred subsequent to December 31, 2023, through April 4, 2024, the date the financial statements were available for issuance.
T. Recently Issued Accounting Pronouncements
GASB has approved GASB Statement No. 100, Accounting Changes and Error Corrections, Statement No. 101, Compensated Absences, and Statement No. 102, Certain Risk Disclosures. Management is in the process of evaluating the GASB statements and their impact. When they become effective, application of these standards may require restatement of portions of these financial statements
U. Reclassifications
Certain prior year amounts have been reclassified to conform to current year presentation.
3. SALE AGREEMENTS Power Sale Agreements
MRES and WMMPA have Long-term Power Sale Agreements with 61 members (Power Supply Members). Fifty-eight of the members (S-1 Members) have executed S-1 Power Sale Agreements (S-1 Agreements), and three members have executed Non S-1 Power Sales Agreements. The members must take and pay for all electric power and energy made available under these agreements Fifty-seven of the 58 S-1 Agreements provide for MRES to supply, to the extent it has power and energy available, to such MRES S-1 Members their respective Supplemental Power requirements above that supplied by Western Area Power Administration (WAPA). The electric power and energy sold to the other MRES S-1 Member is supplemental to WAPA and certain existing power supply agreements. These power supply agreements expire at various times between December 2026 and March 2033. As the power supply agreements expire, MRES will provide the electric power and energy previously provided by these agreements. Effective March 2033, the power and energy sold to this S-1 Member will be all power and energy supplemental to WAPA. The term of the S-1 Agreements currently extends to January 1, 2057. MRES S-1 Members have an option every five years to cap their purchases from MRES at the level of service provided by MRES on the first day of the summer season following the second year following exercise of the option. No S-1 Member has ever elected to cap its purchases from MRES. The next option date for capping purchases from MRES is 2027.
2023 Financials 50
MRES provides 100 percent of the demand and energy requirements to one MRES member under a Non S-1 Power Sale Agreement. This agreement expires January 1, 2057. The sale of power and energy under one of the other Non S-1 Agreements expires January 1, 2046, and is based on a 100 percent load factor, i.e., the same level of power and energy every hour. The remaining agreement extends to January 1, 2040, and requires the member to purchase all of its electric power requirements over and above purchases from WAPA and generation owned by the member from MRES Sales revenue associated with all Long-term Power Sale Agreements is classified in the accompanying statements as “Long-term power sales.” Under terms of the Long-term Power Sale Agreements, MRES is required to establish and maintain rates that will provide sufficient revenues to cover the payments under the Power Supply Contract and all other revenue requirements MRES has contracted to collect payments for WAPA power and energy purchased by the members with WAPA allocations and to remit these payments to WAPA. Since MRES is only acting as agent for these members, these amounts are not reflected as revenue or expense in the Combined Statements of Revenues, Expenses, and Changes in Net Position The power and energy purchased by these members that MRES was responsible for collecting and remitting to WAPA totaled approximately $53 million and $45 million for the 12 months ended December 31, 2023 and December 31, 2022, respectively
The revenue requirements of the Long-term Power Sale Agreements expiring January 1, 2057 and January 1, 2040, include all expenses for the transmission of electric power and energy to these members. These expenses totaled $39 million and $41 million during 2023 and 2022, respectively.
In addition to sales under the Long-term Power Sale Agreements, MRES has arrangements to sell generating capacity to other wholesale customers on a long-term basis and wholesale power and energy in MISO and SPP on short-term firm and non-firm bases. Revenues associated with the sale of generating capacity on a long-term basis is classified in the accompanying statements as “Long-term power sales.” Revenues associated with the sale of wholesale power and energy in MISO and SPP on short-term firm and non-firm bases are classified in the accompanying statements as “Short-term power sales.”
4. SUPPLY CONTRACTS
A. Power Supply Contract
Under the Power Supply Contract, WMMPA is obligated to sell to MRES, and MRES is obligated to buy from WMMPA, on a take-and-pay basis, entitlement in the generation, approximately 532 megawatts (MW), transmission, and general plant facilities owned by WMMPA and all replacement power and energy required by the Power Supply Members. The Power Supply Contract expires January 1, 2057, to coincide with the term of 59 of the 61 Long-term Power Sale Agreements
B. Power Purchase Agreements
MRES has long-term power purchase agreements (PPA) with various third parties to receive the output of approximately 79 MW of wind generation, 33 MW of nuclear generation, and 1 MW of solar generation The wind generation PPAs expire at various times between 2024 and 2029; the nuclear generation PPA expires in 2033, and the solar generation PPA expires in 2041. WMMPA acquired the Marshall Wind Farm, LLC (MWF, LLC) assets in March 2020. MWF represents 19 of the 79 MW of wind generation PPAs See note 6 for additional details.
5. INVESTMENTS
The investments for MRES and WMMPA are in accordance with the Bond Resolution, the Assignment and Pledge Agreement, the MRES Investment Policy, the WMMPA Investment Policy (which conforms to the Bond Resolution), and applicable state law. These documents allow investment in securities issued by the U S Government, its agencies and instrumentalities, certain state and local government securities, specified corporate obligations, and certain bank instruments.
C USTODIAL C REDIT R ISK
Deposits
Deposit custodial credit risk is the risk that in the event of a financial institution failure, the entity’s deposits may not be returned to MRES or WMMPA. Deposits in each bank were insured by the Federal Deposit Insurance Corporation (FDIC) in the aggregate amount of $250,000 for interest-bearing and noninterest-bearing accounts in 2023 and 2022. State law and MRES and WMMPA Investment Policies require collateralization of all deposits above the FDIC limit. On December 31, 2023 and 2022, all MRES and WMMPA deposits were entirely insured or collateralized. MRES holds a collateral account with MISO, which totaled $6.3 million at both December 31, 2023 and December 31, 2022. MRES also holds a collateral account with SPP, which totaled $1.2 million at December 31, 2023 and $1.1 million at December 31, 2022
Investments
Investment custodial credit risk is the risk that in the event of the failure of the counterparty, MRES and WMMPA will not be able to recover the value of their investment or collateral securities that are in the possession of an outside party. WMMPA investments are held by Computershare Trust Company, N.A., National Association, as Trustee for WMMPA. MRES investments are held in the book entry system of the Fifth Third Bank in the name of the MRES custodian, First Premier Bank. MRES is identified as the owner of these investments in the records of First Premier Bank.
2023 Financials 51
MRES and WMMPA funds at December 31, 2023 and 2022, are summarized as follows:
2023
2022
Investments are stated at fair value, which is the amount at which an investment could be exchanged in a current transaction between willing parties. Fair values are based on quoted market prices. The estimated fair value of cash and cash equivalents and investment securities, by contractual maturity, is shown under Fair Value Measurement. Expected maturities may differ from the contractual maturity, because borrowers may have the right to call or prepay obligations with or without call or prepayment penalties. Investment values may have changed significantly after year end.
FAIR VALUE MEASUREMENT
Fair value is the price that would be received to sell an asset or paid to transfer a liability in an orderly transaction bet ween market participants at the measurement date. Fair value measurements must maximize the use of observable inputs and minimize the use of unobservable inputs. There is a hierarchy of three levels of inputs that may be used to measure fair value:
Level 1 – Quoted prices in active markets for identical assets or liabilities.
Level 2 – Observable inputs other than Level 1 prices, such as quoted prices for similar assets or liabilities, quoted prices in markets that are not active, or other inputs that are observable or can be corroborated by observable market data for substantially the full term of the assets or liabilities.
Level 3 – Unobservable inputs supported by little or no market activity that are significant to the fair value of the assets or liabilities.
The tables displayed below present the fair value measurements of MRES and WMMPA assets recognized in the accompanying financial statements measured at fair value on a recurring basis and the level within the fair value hierarchy in which the fair value measurements fall at year-end. Securities issued by the U.S. Government are classified in Level 1 of the fair value hierarchy and valued using prices quoted in active markets for those securities. Securities issued by U.S. Government Agencies and Instrumentalities as well as securities issued by state and local governments were valued on institutional bond quotes and/or evaluations based on various market and industry inputs and are classified in Level 2. Certain cash and cash equivalents are valued at their outstanding balance, and thus, are not included within the fair value hierarchy.
At December 31, 2023, the MRES and WMMPA investments were as follows:
Maturity (Years)
Amortized Cost Fair Value Amortized Cost Fair Value Cash and Cash Equivalents: 65,638 $ 65,638 $ 64,511 $ 64,511 $ Investment Securities: Securities issued by U.S. Government 185,280 180,731 188,231 178,205 Securities issued by U.S. Government Agencies and Instrumentalities 138,915 135,930 139,037 133,866 Securities issued by State and Local Governments 5,692 5,709 4,919 4,800 Total Funds 395,524 $ 388,008 $ 396,698 $ 381,382 $
(thousands of dollars) Level of Fair Investment Type Fair Value Less than One Over One Value Hierarchy Cash and Cash Equivalents – Other 2,297 $ 2,297 $ - $ Cash and Cash Equivalents – Money Market Mutual Funds 63,341 63,341 - Level 1 Securities issued by U.S. Government 180,731 113,713 67,018 Level 1 Securities issued by U.S. Government Agencies and Instrumentalities 135,930 42,247 93,683 Level 2
issued by State and Local Governments 5,709 - 5,709 Level 2 Total 388,008 $ 221,598 $ 166,410
Securities
(thousands of dollars)
2023 Financials 52
At December 31, 2022, the MRES and WMMPA investments were as follows:
C REDIT R ISK
Credit risk is the risk that an issuer or other counterparty to an investment will not fulfill its obligations. The securities issued by the U.S. Government and its Agencies and Instrumentalities had AA+ ratings from Standard & Poor’s (S&P) and Fitch Ratings (Fitch) and Aaa ratings from Moody’s Investors Service (Moody’s). The securities issued by State Governments had ratings of AA- to AAA from S&P, AA to AAA from Fitch, and Aa2 or Aa1 from Moody’s. The money market mutual funds included in cash and cash investments had ratings of AAAm from S&P and Aaa-mf ratings from Moody’s. The MRES and WMMPA Investment Policies limit investments to certain issuers, types of institutions, and ratings, of which all outstanding investments are in compliance
C ONCENTRATIONS OF C REDIT R ISK
Concentration of credit risk is the risk of loss attributed to the magnitude of the investment in a single issuer by MRES or WMMPA. Investments held with issuers totaling 5 percent or more of the total portfolio were concentrated as follows:
The MRES and WMMPA Investment Policies do not limit the amount of the portfolio that can be invested in securities issued by the U.S. Government or agencies of the U.S. Government. The MRES Investment Policy and state law restrict investments of commercial paper by percentage of portfolio as well as by the amount of a single issuer. Both the MRES and WMMPA Investment Policies address diversification of investments to eliminate the risk of loss resulting from over concentration of assets in a specific maturity, issuer, or class of security
I NTEREST R ATE R ISK
Interest rate risk is the risk that changes in interest rates will adversely affect the estimated fair value of an investment.
The maximum maturity under the MRES Investment Policy for operating funds is 397 days. All other MRES funds may have longer maturities consistent with liquidity needs. The maximum maturity under the WMMPA Investment Policy for operating funds is 12 months. All other WMMPA funds have varying maturity limits depending on the anticipated need to make payments from the various funds.
Level of Fair Investment Type Fair Value Less than One Over One Value Hierarchy Cash and Cash Equivalents – Other 5,247 $ 5,247 $ - $ Cash and Cash Equivalents – Money Market Mutual Funds 59,264 59,264 - Level 1 Securities issued by U.S. Government 178,205 25,198 153,007 Level 1 Securities issued by U.S. Government Agencies and Instrumentalities 133,866 42,147 91,719 Level 2 Securities issued by State and Local Governments 4,800 1,250 3,550 Level 2 Total 381,382 $ 133,106 $ 248,276 Maturity (Years) (thousands of dollars) Issuer 2023 2022 U.S Government 47% 47% Federal Farm Credit Bank 15 12 Federal Home Loan Bank 14 8 Federal National Mortgage Association 6 7 Federal Home Loan Mortgage Corporation 1 9 %
2023 Financials 53
of Portfolio at December 31
INVESTMENT IN MARSHALL WIND FARM, LLC
WMMPA purchased MWF, LLC in March 2020. MWF, LLC owns nine wind turbines located near Marshall, Minnesota, and is capable of generating 19 MW of power. WMMPA provides financing for the operations of MWF, and it is accounted for as a blended component unit of WMMPA. The revenues and expenses of MWF, LLC were eliminated upon consolidation with WMMPA. MWF, LLC’s summary financial information as of December 31, 2023 and 2022, and for the years then ended is as follows:
Statement of Net Position
2023 2022
Statement of Revenues, Expenses, and Changes in Net Position
Revenues and Expenses
Statement of Cash Flow
Flows
7. MISSOURI BASIN POWER PROJECT
A. Utility Plant
WMMPA has a 16.47 percent undivided ownership in MBPP that includes LRS, which consists of three 570 MW coalfired, steam, electric-generating units, associated transmission facilities, intangible plant, and the Grayrocks Dam and Reservoir
B. Coal Supply Contracts
MBPP has an agreement with Western Fuels Association, Inc. (Western Fuels) to purchase sub-bituminous coal for LRS through the year 2034. The price of this coal is fixed at an amount that will produce revenues sufficient, together with all other Western Fuels’ revenues, to cover the costs of producing or acquiring and delivering the coal. MBPP is obligated to pay for a minimum amount of coal each year. The average prices of MBPP coal purchases were approximately $20.39 and $20.54 per ton in 2023 and 2022, respectively. MBPP purchased approximately 7 million and 5 million tons of coal during 2023 and 2022, respectively. Minimum coal purchase requirements over the next five years of the
for
6
contracts
Assets Current assets $ 18 $ 14 Net Plant 11,617 12,020 Total Assets 11,635 12,034 Deferred Outflows of Resources 2,006 2,185 Total Assets and Deferred Outflows of $ 13,641 $ 14,219 Liabilities Current liabilities $ 771 $ 204 Other non-current liabilities 2,565 2,607 Total Liabilities 3,336 2,811 Net Position 10,305 11,408 Total Liabilities and Net Position $ 13,641 $ 14,219
2023
Operating revenues $ 1,179 $ 1,406 Operating expenses Depreciation and amortization 1,103 1,065 Operation and maintenance 258 1,491 Administration and general 48 1 Total operating expenses 1,409 2,557 Operating Loss (230) (1,151) Transfer from (to) WMMPA (873) 86 Change in Net Position (1,103) (1,065) Net Position Net Position, Beginning of year 11,408 12,473 Net Position, End of year $ 10,305 $ 11,408
Net cash flow for noncapital financing activities $ 942 $ (211) Net cash flow from operating activities (942) 211 Net Change in Cash - $ - $ Cash, Beginning of year -Cash, End of year - $ - $ (in thousands)
2022
2023 2022 Cash
thousands)
2023 Financials 54
(in
(in thousands)
all MBPP participants are as follows:
2026 2,300,000
2027 1,800,000
2028 1,800,000
Western Fuels entered into various agreements that provide for development and ownership of the Dry Fork Mine. In connection with the development and acquisition of the Dry Fork Mine, the MBPP participants provided financing to Western Fuels. On December 31, 2023 and 2022, the balance of advances owed to WMMPA approximated $0.7 million and $0.9 million, respectively. These advances are expected to be fully repaid by 2029
C. Operating Expenses
Costs of MBPP are allocated to WMMPA based on its 16.47 percent undivided ownership interest, except for energyrelated costs, which are allocated based on scheduled generation and adjusted for the relative effects of the LRS heat rate and plant efficiency at the time generation is scheduled. Such costs are included in operating expenses in the Combined Statements of Revenues, Expenses, and Changes in Net Position
D. Advances to MBPP
WMMPA advances to the MBPP operating agent for working capital purposes totaled approximately $7 million and $5 million at December 31, 2023 and 2022, respectively
8. UTILITY PLANT
Utility plant at December 31, 2023 and 2022, consisted of:
Utility plant activity for the years
of dollars)
Year Tons
2024 5,450,000 2025 4,000,000
ended December 31, 2023 and 2022, was: Gross Plant Accumulated Depreciation Net Plant Gross Plant Accumulated Depreciation Net Plant Generation $ 782,816 $ 232,871 $ 549,945 $ 774,753 $ 218,673 $ 556,080 Transmission 185,497 65,751 119,746 178,488 62,681 115,807 General 25,665 14,304 11,361 22,638 13,364 9,274 Intangible 9,274 8,519 755 9,274 8,427 847 Utility Plant in 1,003,252 321,445 681,807 985,153 303,145 682,008 CWIP 33,989 - 33,989 17,362 - 17,362 Total Utility Plant $ 1,037,241 $ 321,445 $ 715,796 $ 1,002,515 $ 303,145 $ 699,370 2023 2022 (thousands
January 1, 2023 Additions Retirements Transfers December 31, 2023 Non-depreciable Utility Plant Land $ 3,568 $ 1,499 $ - $ - $ 5,067 CWIP 17,362 33,424 - (16,797) 33,989 Total Non-depreciable Utility Plant 20,930 34,923 - (16,797) 39,056 Depreciable Utility Plant Depreciable Utility Plant in Service 981,585 436 (633) 16,797 998,185 Accumulated (303,145) (19,299) 999 - (321,445) Net Depreciable Utility in Service 678,440 (18,863) 366 16,797 676,740 Net Utility Plant $ 699,370 $ 16,060 $ 366 $ - $ 715,796
2023 Financials 55
of dollars)
(thousands
FINANCING Power Supply Revenue Bonds
The Power Supply Revenue Bonds (Revenue Bonds) were issued to finance the ownership interest of WMMPA in generation, transmission, and general plant facilities.
Revenue Bond activity for the years ended December 31, 2023 and 2022, was as follows:
9. OTHER NON-CURRENT ASSETS
10.
January 1, 2022 Additions Retirements Transfers December 31, 2022 Non-depreciable Utility Plant Land $ 3,568 $ - $ - $ - $ 3,568 CWIP 10,457 13,089 - (6,184) 17,362 Total Non-depreciable Utility Plant 14,025 13,089 - (6,184) 20,930 Depreciable Utility Plant Depreciable Utility Plant in Service 974,664 2,431 (1,694) 6,184 981,585 Accumulated (285,783) (19,160) 1,798 - (303,145) Net Depreciable Utility in Service 688,881 (16,729) 104 6,184 678,440 Net Utility Plant $ 702,906 $ (3,640) $ 104 $ - $ 699,370 (thousands of dollars) 2023 2022 Other non-current assets consisted of: Accumulated change in fair value of hedging derivatives 3,515 $ 4,301 $ Pierre Solar Project Prepayment 973 1,033 Renewable Energy Credits 1,209 1,282 Other Non-Current Assets 613 2,392 Total other non-current assets 6,310 $ 9,008 $ (thousands of dollars) January 1, 2023 Debt Issued Debt Refunded Payments or Amortization December 31, 2023 Amount Due within One Year Revenue Bonds $ 597,520 $ - $ - $ (14,255) $ 583,265 $ 13,730 Unamortized Debt Premium 14,656 - - (1,998) 12,658Revenue Bonds, Net Unamortized $ 612,176 $ - $ - $ (16,253) $ 595,923 $ 13,730 January 1, 2022 Debt Issued Debt Refunded Payments or Amortization December 31, 2022 Amount Due within One Year Revenue Bonds $ 617,445 $ 43,160 $ (49,440) $ (13,645) $ 597,520 $ 14,255 Unamortized Debt Premium 16,416 2,763 (2,302) (2,221) 14,656Revenue Bonds, Net Unamortized $ 633,861 $ 45,923 $ (51,742) $ (15,866) $ 612,176 $ 14,255 2023 Financials 56
The original issue amount and the outstanding amount of the Revenue Bonds, net of unamortized debt premium, at December 31, 2023 and 2022, are as follows:
2010 Series C Bonds: Term Bonds (Build America Bonds): 6.77% with
annual sinking fund requirements beginning in 2031, due 2046
2014 Series A Bonds: Serial Bonds: 5.00% due 2021 through 2046
2015 Series A Bonds: Serial Bonds: 5.00% due 2031 through 2036
2018 Series A Bonds: Serial Bonds: 5.00% due 2025 through 2029
2018 Series A Bonds: Term Bonds: 5.00% due 2047 through 2049
2019 Series A Bonds: Serial Bonds: 1.988%-2.795% due 2021 through 2034
2019 Series A Bonds: Term Bonds: 3.156%-3.226% due 2039 through 2046
2022 Series A Bonds: Serial Bonds: 5.00% due 2024 through
$
Future Debt service payments for the outstanding Revenue Bonds are as follows:
2015 Series A Bonds and 2018 Series A Bonds are subject to redemption at par beginning in 2026 and 2029, respectively, at the option of WMMPA. The 2010 Series C Bonds and 2019 Series A Bonds are subject to redemption prior to their stated maturity at the option of WMMPA, in whole or in part, on any date. The redemption price for the 2010 Series C Bonds and 2019 Series A Bonds is the greater of 100 percent of the principal or the sum of present value of the remaining scheduled payments of principal and interest to the maturity date of the 2010 Series C Bonds and 2019 Series A Bonds The 2022 Series A Bonds are not subject to redemption prior to maturity.
The outstanding bonds are secured by a pledge and assignment of and security interest in (1) the proceeds of the Revenue Bonds; (2) all funds established under the Bond Resolution; (3) all revenues received by MRES under the Power Sale Agreements; and (4) all revenues received from regional transmission organizations, except for revenues received by MRES for member-owned transmission assets Principal and interest for the current year and total revenue pledged were approximately $38 million and $274 million, respectively.
The outstanding bonds contain a provision that in an event of default which has not been remedied, WMMPA will, upon demand of the Trustee, pay over or cause to be paid over to the Trustee all funds held by WMMPA in any fund other than funds in the Debt Service Reserve Account and all revenues when received. The Trustee will apply all funds received during the continuance of the event of default in the following order: (1) for payment of the reasonable and proper charges, expenses, and liabilities of the Trustee, (2) for payment of operating expenses, and (3) for payment of interest and principal or the redemption Bonds and the interest and principal components of Parity Hedging Contract Obligations Parity Reimbursement Obligations shall not include any payments related to Subordinated Reimbursement Obligations. During 2022, WMMPA issued $43 million of Power Supply Revenue Refunding Bonds, 2022 Series A Bonds, to advance refund the 2012 Series A Bonds. The cash flow requirements on the 2012 Series A Bonds refunded was $60 million from January 2023 through January 2030. The cash flow requirements on the 2022 Series A Bonds total $53 million for the same period. In conjunction with the refunding, WMMPA terminated the interest rate swap associated with the 2012 Series A Bonds. The net present value savings resulting from the advance refunding and termination of the interest rate swap was approximately $6 million.
Escrowed Bonds outstanding and considered defeased total $286 million and $335 million at December 31, 2023 and 2022, respectively
Original Issue Amount 2023 2022
99,915
99,915 $ 99,915 $
351,255 6,330 18,185
34,835 34,835 34,835
30,035 30,035 30,035
52,390 52,390 52,390
97,310 91,890 94,290
224,710 224,710 224,710
2030 43,160 43,160 43,160 Principal Outstanding 583,265 597,520 Unamortized debt premium 12,658 14,656 Revenue Bonds, including
premium 595,923 612,176 Less current maturities 13,730 14,255 Revenue Bonds, including unamortized debt premium and excluding current maturities 582,193 $ 597,921 $ Amount Outstanding Year Ending December 31 Principal Interest Total Payments expected to be received from U.S. Treasury 2024 13,730 $ 24,416 $ 38,146 $ 2,233 $ 2025 14,765 23,773 38,538 2,233 2026 15,435 23,086 38,521 2,233 2027 16,145 22,363 38,508 2,233 2028 16,890 21,603 38,493 2,233 2029-2033 96,930 97,785 194,715 11,112 2034-2038 117,270 78,460 195,730 10,501 2039-2043 141,625 50,906 192,531 6,458 2044-2048 132,155 18,050 150,205 1,143 2049 18,320 458 18,778583,265 $ 360,900 $ 944,165 $ 40,379 $ 2023 Financials 57
unamortized debt
11. DERIVATIVE FINANCIAL INSTRUMENTS
On March 11, 2021, WMMPA executed two interest rate swap amendments related to the executed interest rates swaps The two swaps were 1) a $51 million swap for the 2012 Series A Bonds in which payments were expected to commence January 25, 2023, and 2) a $35 million swap for the 2015 Series A Bonds in which payments will commence on January 21, 2026. The amendments replaced the taxable interest rate approved in the two rate swaps executed in March 2020 with a tax-exempt rate, which should more closely mirror the rate that WMMPA would expect to pay on refunding bonds when issued. WMMPA executed the interest rate swap agreements with Citibank, N.A. (Citi) to manage various risks associated with WMMPA’s debt programs.
On October 19, 2022, WMMPA terminated the interest rate swap associated with the 2012 Series A Bonds. A gain of $4 million was realized upon the termination of the interest rate swap. The gain is included in the unamortized loss on refunding and is being amortized over the remaining maturity of the 2022 Series bonds
The interest rate swaps are a contractual agreement entered into between WMMPA and Citi under which each party agrees to exchange periodic fixed or variable payments, based upon a stated notional amount, over the stated life of the agreement. The net differential paid or received is recognized over the life of the agreement as an adjustment to interest expense. Interest rate swaps determined to be hedging derivatives are designated as cash flow hedges. The specific objectives for each category of effective hedges are summarized as:
• Pay-Fixed, Receive-Variable Interest Rate Swaps – WMMPA will pay a fixed rate and receive a variable rate on these swaps. On or about the effective date of the swap, WMMPA plans to issue fixed rate debt and either make or receive a termination payment, which would hedge the change in interest rates between the trade date of the swaps and the effective date of the swaps.
SIGNIFICANT TERMS , CHANGE IN FAIR VALUE , AND CREDIT RATINGS
The significant terms and credit ratings of WMMPA’s hedging derivatives as of December 31, 2023 and 2022, are shown in the following tables. The variable rates are quoted in terms of the Securities Industry and Financial Markets Association (SIMFA) Swap Index. S&P, Moody’s, and Fitch ratings are disclosed for each swap and forward contract.
Pay-Fixed,
Pay-Fixed, Receive-Variable Interest Rate Swaps
Associated Bond Issue Level
Pay-Fixed, Receive-Variable Interest Rate Swaps
Level 1 – Quoted Prices in Active Markets for Identical Assets
Level 2 – Significant Observable Inputs
Level 3 – Significant Unobservable Inputs Counterparty Credit Ratings
WMMPA classified its derivative instruments in Level 2 of the fair value hierarchy as they are valued using a market approach that considers benchmark interest rates and forward curves
Associated Bond Issue Initial Notional Amount Effective Date Maturity Date Terms Change in Fair Value (12/31/2023) Fair Value (12/31/2023) 2015 Series A Bonds 35,000 $ 1/21/2026 1/1/2036 Pay 0.955%; receive SIFMA Swap Index (786) $ 3,515 $ (in thousands)
Associated Bond Issue Initial Notional Amount Effective Date Maturity Date Terms Change in Fair Value (12/31/2022) Fair Value (12/31/2022) 2015 Series A Bonds 35,000 $ 1/21/2026 1/1/2036 Pay 0.955%; receive SIFMA Swap Index 2,770 $ 4,301 $
Receive-Variable Interest Rate Swaps
(in thousands)
Moody's
2015 Series A Bonds Level 2 Aa3 A+ A+
S&P Fitch
Fair Value Measurements:
2023 Financials 58
DEBT S E RVICE PAYMENTS ON UNDERLYING BOND ISSUES
Current debt service requirements on the 2015 Series A Bonds are as follows (in thousands):
The above debt service table does not include the impact of the swap payments, because the effective date of the swap is in 2026. The amounts that any swap payments would increase or decrease these totals would be based on the interest rates during the term of the swaps.
RISKS
Credit Risk – WMMPA is exposed to credit risk if the counterparty to an interest rate swap fails to meet the terms and obligations of its contracts.
WMMPA mitigates the credit risk associated with its swaps by entering into transactions with highly rated counterparties. The interest rate swap agreements also contain varying collateral requirements in the event of a credit rating downgrade. Swap contracts with a negative fair value do not expose WMMPA to credit risk. As of December 31, 2023 and 2022, WMMPA was not exposed to credit risk due to the swaps being recorded in the positive position. The aggregate fair value of hedging derivative instruments in asset (positive) positions was $3.5 million and $4.3 million as of December 31, 2023 and 2022, respectively
Interest Rate Risk – WMMPA is not exposed to interest rate risk on its interest rate swaps. The pay-fixed, receivevariable interest rate swaps, WMMPA’s net payment on the swap, increases as SIFMA swap index decreases.
Basis Risk – WMMPA is not exposed to basis risk due to participating in the pay-fixed, receive-variable interest rate swaps.
Termination Risk – Termination risk is the risk that the swap may be terminated prior to its scheduled maturity date as a result of certain specified events. The swaps associated with the 2015 Series A Bonds provide Citi and WMMPA with the option to terminate either swap under certain conditions at any time.
WMMPA or Citi may terminate any of the swaps if the other party fails to perform under the terms of the respective swap agreements. If any of the swaps are terminated, the associated variable-rate bonds would no longer have a synthetic fixed rate, and WMMPA would be subject to interest rate risk to the extent that the variable-rate bonds were not hedged with another swap or with variable-rate assets. Unless there is a termination option exercised by Citi, WMMPA would owe Citi a termination payment equal to the swap’s negative fair value.
The swap agreements include optional early termination provisions granting WMMPA the right, but not an obligation, to terminate the interest rate swaps at par without a termination payment after an effective date or after the breach of certain counterparty credit ratings.
Rollover Risk – Rollover risk is the risk caused by a mismatch between the amortization of a derivative contract and the underlying hedged bonds.
None of WMMPA’s effective interest rate swaps are subject to rollover risk, because the maturity dates of the swaps extend to the maturity dates of the related bonds.
Market-access Risk – Each swap associated with underlying variable rate debt subject to tender at the option of the bondholder is subject to market access risk.
If an early termination event occurs, WMMPA could be required to pay or to receive a substantial termination payment.
12. RATE MATTERS
As part of a plan to stabilize the cost of electrical energy to its members, the MRES Board of Directors (Board) has a policy to approve rates under the Long-term Power Sale Agreements that may include the use of the prior year’s Net Position to fund a portion of subsequent years' operating expenses. Funds accumulated from prior years were not utilized in establishing the rates for 2022 and 2023 In 2021, the MRES Board approved deferring $42 million of short-term power sales revenue that will be available to be utilized in subsequent years to stabilize rates. In 2022, the MRES Board approved recognizing $6 million of the deferred revenue to stabilize rates.
13. RETIREMENT PLANS
MRES has a 401(k) defined contribution retirement plan covering substantially all of its employees that have more than one year of service. MRES contributes 10 percent of eligible payroll after one year of service, to the plan. Three percent of the MRES contribution is immediately vested, and the remaining 7 percent vests at the rate of 20 percent per year with full vesting after six years of service. Employer contributions totaled approximately $1.4 million and $1 1 million for 2023 and
Year Ending December 31, Debt Service 2024 1,742 $ 2025 1,742 2026 1,742 2027 1,742 2028 1,742 2029-2033 23,669 2034-2036 20,121 Totals 52,500 $ 2023 Financials 59
2022, respectively, or approximately 9 percent of covered payroll. Covered payroll was 94 and 86 percent of total payroll for 2023 and 2022, respectively. Upon an employee’s date of hire, the employee may contribute, on a voluntary basis, up to the maximum allowed by law. Employee contributions to the plan totaled approximately $1.3 million in both 2023 and 2022, or approximately 9 and 10 percent of covered payroll for 2023 and 2022, respectively.
MRES has established a 457(b) defined contribution retirement plan covering substantially all of its employees. All contributions to the plan are voluntary employee contributions. MRES does not make any contributions to the plan. Employee contribution to the plan totaled approximately $0.5 million and $0.4 million in 2023 and 2022, respectively, or approximately 3 percent of covered payroll for both 2023 and 2022.
MRES acts as plan administrator for both plans, and all plan changes are approved by the MRES Board. Employees are responsible for directing in which funds offered in the plans their balance is invested.
14. CONTINGENCIES, COMMITMENTS, AND LITIGATION GENERAL
MRES and WMMPA are exposed to various risks of loss related to torts; theft of, damage to, or destruction of assets; natural disasters; errors and omissions; injuries to employees and others; and healthcare of MRES employees. MRES and WMMPA carry commercial insurance, subject to certain limits and deductibles, to reduce the financial impact if claims for these risks are asserted or judgments awarded. In May 2022, a tornado caused damage to the Elbow Lake Substation and transmission lines. The transmission lines that were damaged qualified to receive funds from the Federal Emergency Management Agency (FEMA). WMMPA received approximately $1.4 million from FEMA on February 23, 2024 In May 2023, there was damage that incurred to Unit 3 at Exira. There was a property insurance claim filed for the damage at Exira, the repair work has been completed, the estimated amount of the claim to be received is $2.2 million. The coverages and deductibles in effect were substantially the same for both 2023 and 2022.
Effective January 1, 2021, MRES switched from a fully insured health insurance plan to a self-funded health insurance plan. MRES mitigated some of the risk of higher than normal claims with stop loss coverage. During 2022 and 2023, the health costs incurred under the self-insured plan were less than the premiums that would have been paid under a fully funded plan MRES and WMMPA are subject to continually changing federal, state, and regional environmental, health, and safety standards, laws, and regulations. These changes may arise from legislative, regulatory, and judicial action taken in response to public safety and environmental concerns. Compliance with such laws and regulations could result in increased operating costs and reduced operation levels. An inability to comply with certain laws and regulations could result in the complete shutdown of generating units and transmission facilities. At December 31, 2023, MRES and WMMPA believe they are in material compliance with all environmental, health, and safety regulations.
CONTRACT COMMITMENTS
WMMPA has entered into various contracts for the construction of various transmission projects As of December 31, 2023, the remaining obligation on these contract commitments totaled approximately $16.3 million
CLEAN AIR ACT
CAA 111(d) Carbon Pollution Emission Guidelines for Existing Stationary Sources:
In the past, the Environmental Protection Agency (EPA) has published various emission guidelines for states to use in establishing performance standards for regulating carbon dioxide (CO2) emissions from existing power plants under Section 111(d) of the Clean Air Act (CAA). These guidelines have been struck down by various courts, and there are currently no final guidelines in effect.
EPA issued a proposed rule in 2023 setting forth new emission guidelines to regulate CO2 emissions from existing power plants. EPA is expected to issue a final rule in 2024. The final rule will almost certainly be litigated. The ultimate nature of CO2 regulation for the power industry is unknown, and this issue is likely to remain unsettled for many years. Thus, it is not possible to predict the estimated financial or operational impact of any future regulations. It is clear that utilities will continue to face significant regulatory uncertainty in this area and could be subject to CO2 regulations imposed by states seeking to enact their own CO2 reduction plans.
CCR Rule: The 2015 Coal Combustion Residuals (CCR) Rule (CCR Rule) mandated closure of unlined surface impoundments upon a specified triggering event. In December 2019, EPA published proposed amendments to the CCR Rule that included new deadlines to cease waste receipt and initiate closure for unlined surface impoundments. The proposed amendments indicated all five unlined surface impoundments at LRS would be required to cease accepting CCR waste streams. On July 29, 2020, EPA released a final rule, which established April 11, 2021, as the cease waste receipt deadline for unlined surface impoundments.
BEPC, as Operating Agent for MBPP, is in the process of implementing a long-term compliance plan for the surface impoundments to meet the CCR Rule. Four surface impoundments have been retrofitted and are in compliance with the CCR Rule. The remaining surface impoundments stopped receiving waste by the April 2021 deadline and are in the process of retrofit or closure activities. The cost to close and retrofit the five surface impoundments at LRS is estimated at $65.6 million (with $33.5 million spent to date), which would result in costs of $10.8 million to WMMPA.
Ozone Transport Rule: On March 15, 2023, EPA issued a final rule known as the Ozone Transport Rule to address the interstate transport of air pollution from several states pursuant to the “Good Neighbor” provision of the 2015 Ozone National Ambient Air Quality Standard (NAAQS) The Ozone Transport Rule imposes new requirements for reducing Nitrogen Oxide (NOx) emissions from power plants located in 23 upwind states. The reductions in NOx emissions are intended to prevent power plants in the covered states from significantly contributing to nonattainment or interfering with
2023 Financials 60
maintenance of the 2015 ozone NAAQS in other states. The Ozone Transport Rule increases the stringency of EPA’s current ozone-season NOx trading program. On February 16, 2024, EPA issued a proposed supplemental rule that would pull power plants in five other states, including Iowa, into the Ozone Transport Rule. EPA is expected to issue a final supplemental rule in 2024. If the supplemental rule is finalized as proposed, Exira Station Units 1, 2, and 3 would be required to maintain adequate allowances to cover their NOx emissions. It is difficult to estimate the cost to acquire additional allowances in future years due to uncertainty surrounding the continued liquidity of the NOx allowance market
2023 Financials 61
Western Minnesota Municipal Power Agency Statements of Net Position
AND DEFERRED OUTFLOWS OF RESOURCES:
See accompanying independent auditors’ report.
DECEMBER 31 ASSETS
2023 2022 Current Assets: (thousands of dollars) Cash and cash equivalents: Restricted $ 33,496 $ 32,011 Unrestricted 8,989 4,868 Total cash and cash equivalents 42,485 36,879 Short-term investments: Restricted 7,093 16,704 Unrestricted 44,246 20,044 Total short-term investments 51,339 36,748 Accounts receivable 5,472 1,189 Advances to MBPP 6,925 4,805 Fuel stock 9,777 6,170 Materials and supplies 6,150 5,972 Interest receivable 525 420 Prepayments and other current assets 6,118 5,223 Total Current Assets 128,791 97,406 Non-Current Assets: Long-term investments: Restricted 36,090 25,484 Unrestricted 33,006 49,452 Total long-term investments 69,096 74,936 Capital Assets: Utility plant in service 995,401 977,718 Less-accumulated depreciation (314,880) (297,091) Net utility plant in service 680,521 680,627 Construction work in progress 33,989 17,362 Net Capital Assets 714,510 697,989 Advances for mine development 515 677 Unamortized debt expense - regulatory asset 2,965 3,386 Other non-current assets 4,091 6,323 Total Assets 919,968 880,717 Deferred Outflows of Resources: Asset Retirement Obligation 3,272 3,769 Unamortized loss on reacquired debt 8,916 8,062 Total Deferred Outflows of Resources 12,188 11,831 TOTAL ASSETS AND DEFERRED OUTFLOWS OF RESOURCES $ 932,156 $ 892,548
2023 Financials 62
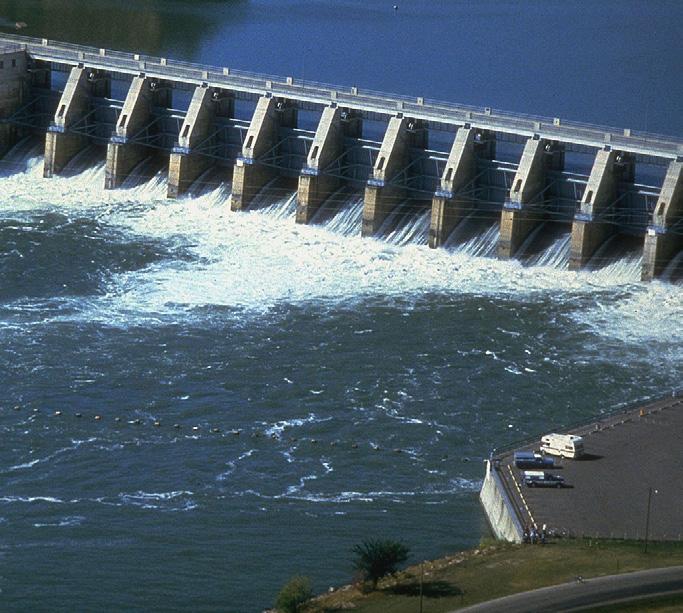
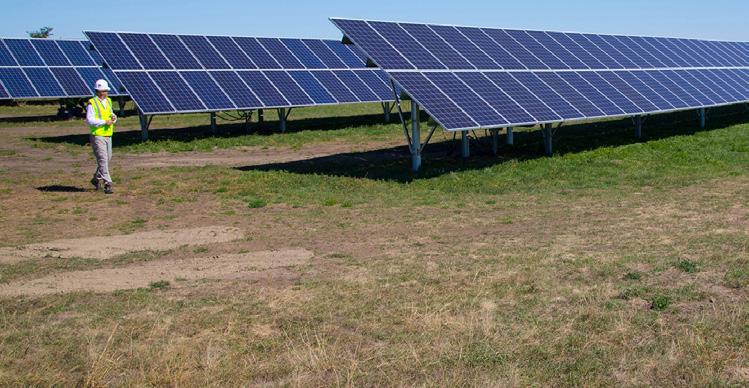


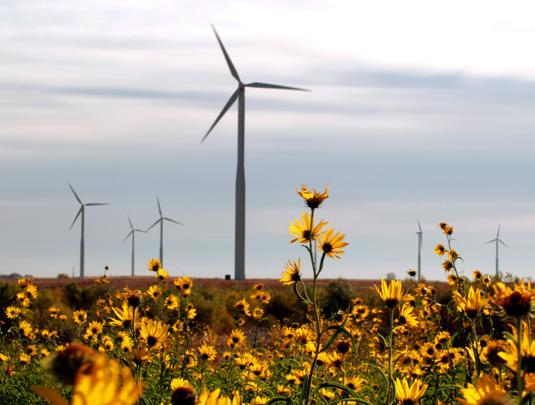






 Vernell Roberts Chair of Board
 Matt Schull President & CEO






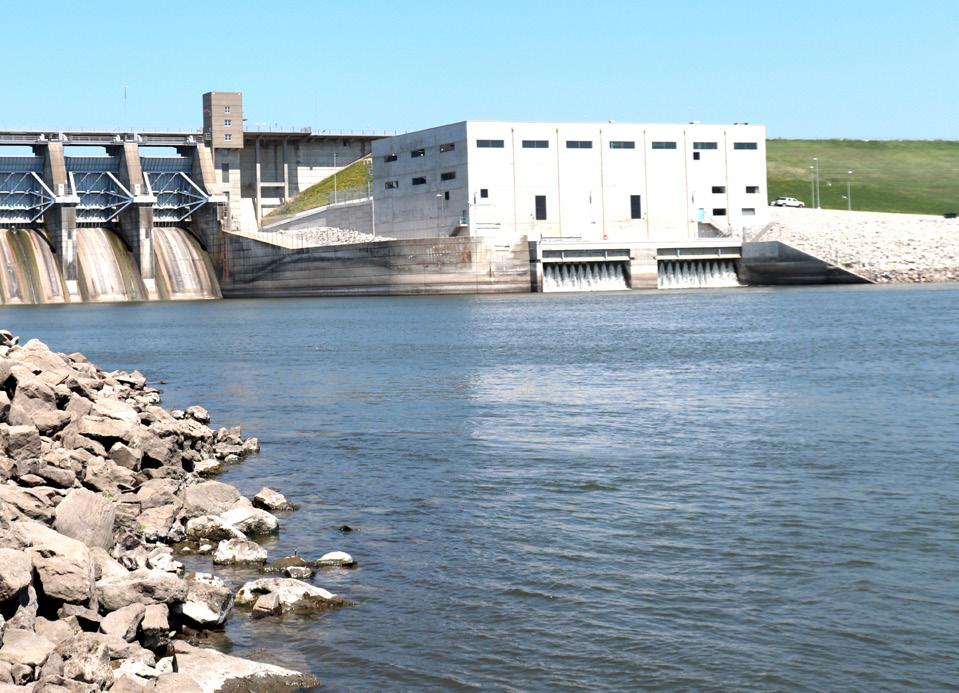

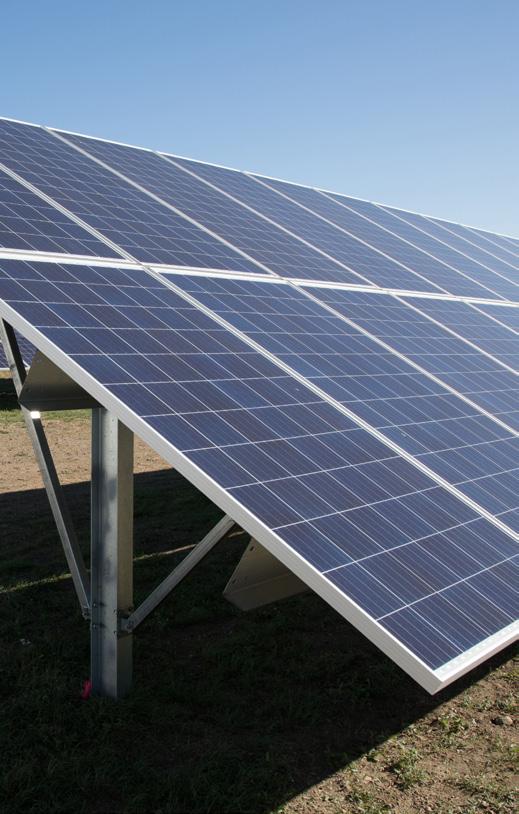


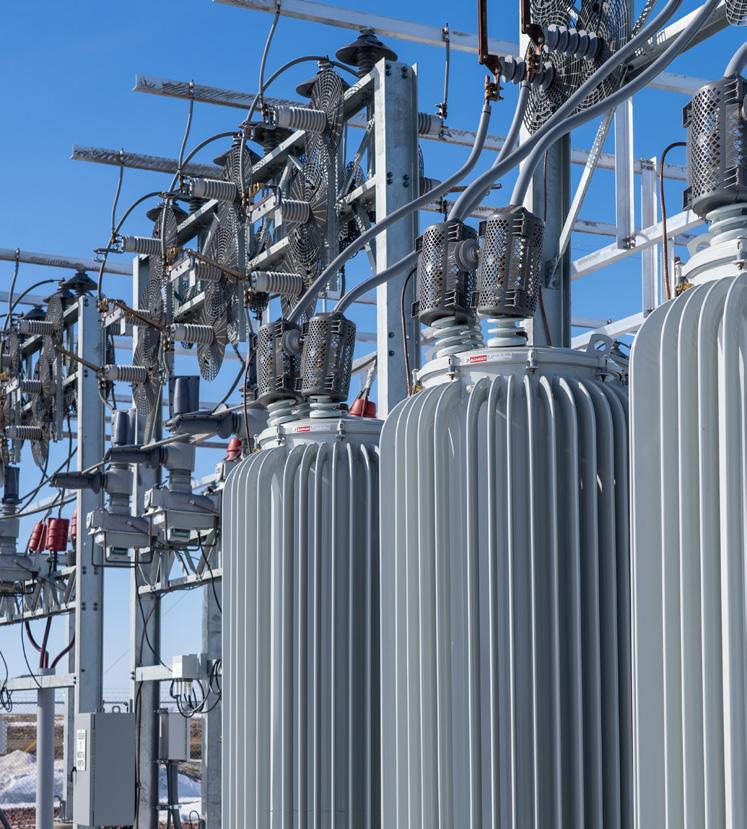


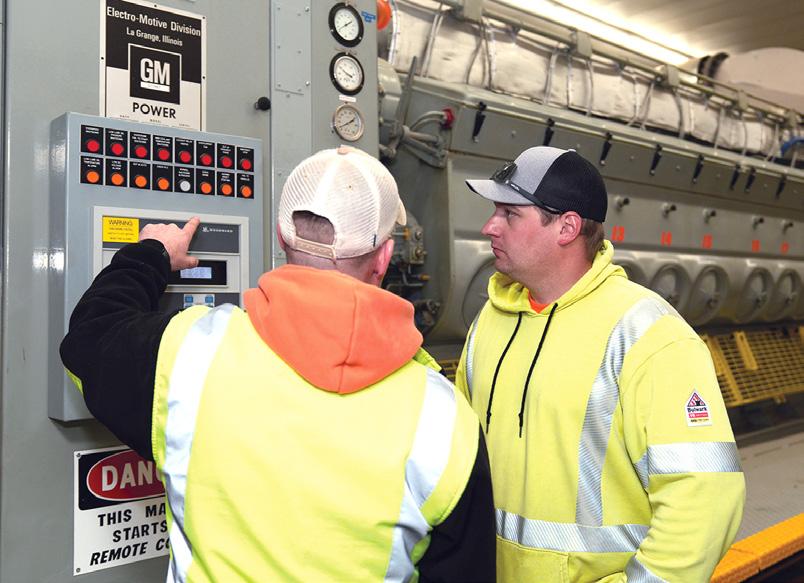


 City of Hillsboro





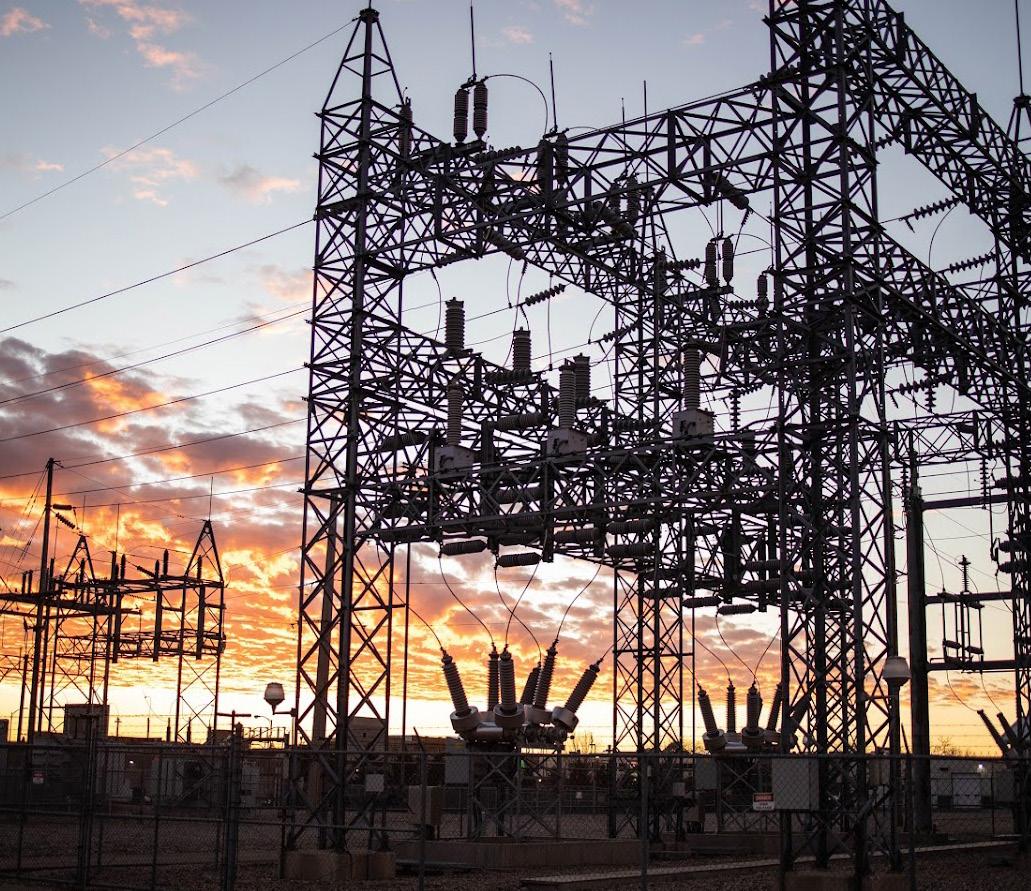
 Terry Wolf MRES Vice President of Power Supply and Operations







 City of Pickstown


