35 minute read
Social and Economic Benefits of


dbvirago©/ Adobe Stock
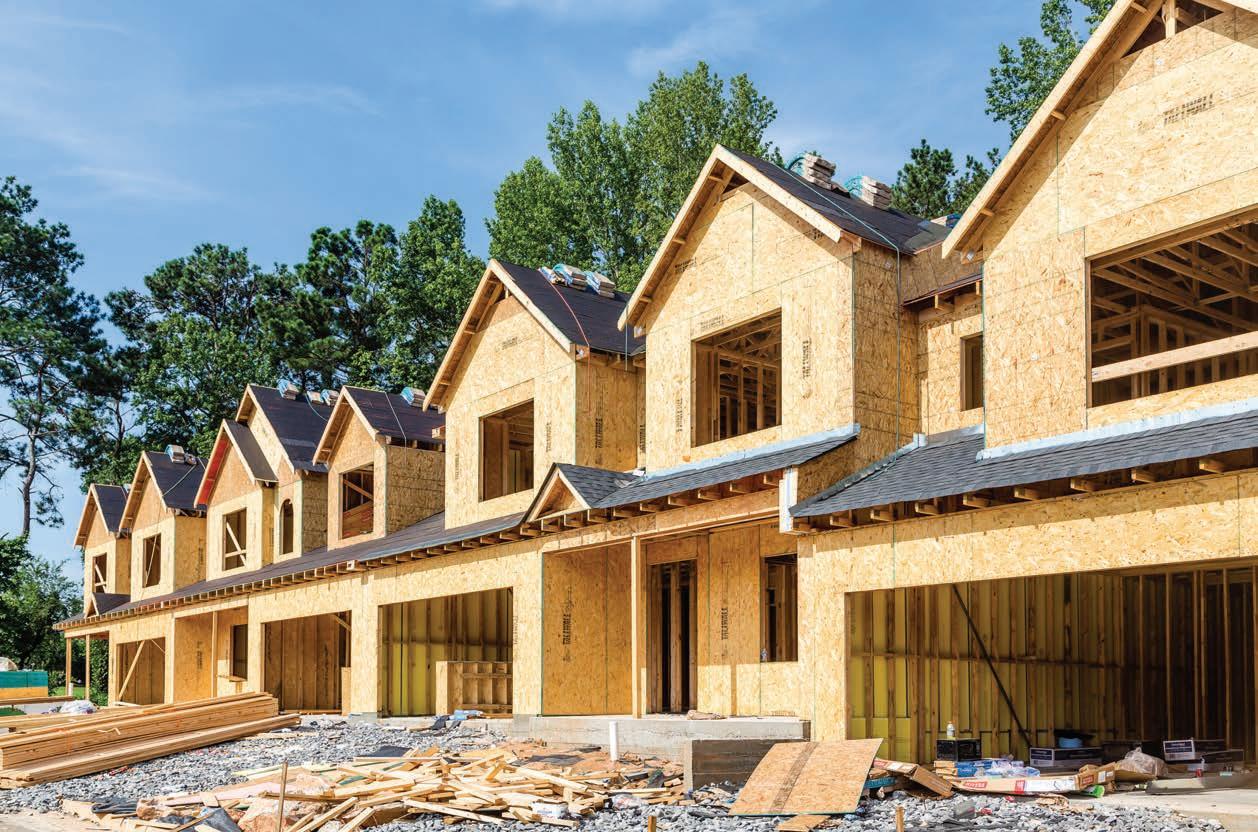
Social and Economic Benefits of Building More Housing
The underbuilding gap in the U.S. totaled more than 5.5 million housing units in the last 20 years.
By The National Association of Realtors® and Rosen Consulting Group
Housing Is Critical Infrastructure
The infrastructure that forms the backbone of the American economy has fallen into disrepair, exacerbating a wide range of short- and longerterm social and economic challenges. Following decades of underbuilding and underinvestment, the state of our national housing stock, which is among the most critical pieces of that infrastructure, is dire, with a chronic shortage of affordable and available homes to house the nation’s population. The Department of Homeland Security defines critical infrastructure as: “the physical and cyber systems and assets that are so vital to the United States that their incapacity or destruction would have a debilitating impact on our physical or economic security or public health or safety. The nation’s critical infrastructure provides the essential services that underpin American society.” Our nation’s housing, both affordable and market-rate, public and private, clearly fits this definition, providing for one of the most fundamental of essential services for our people. Moreover, beyond the essential need for shelter, few things are as central to American society and the American Dream as housing and the opportunity to pursue the path of homeownership, especially for those middleclass workers who form the core of the creative and productive American labor force.
(continued on page 22)


Building More Housing (continued from page 18) Yet, similar to so many other areas of U.S. infrastructure, the housing stock around the nation has been widely neglected, with a severe lack of new construction and prolonged underinvestment leading to an acute shortage of available housing, an ever-worsening affordability crisis and an existing housing stock that is aging and increasingly in need of repair—all to the detriment of the health of the public and the economy. At the same time, the inventory shortage is driving home prices out of reach for a growing number of households, especially among communities that have been historically shut out of homeownership. This dynamic will make it that much more difficult to close the existing racial homeownership gap in the years to come. Given the critical need to build more housing all around the country, leading research institutes, policy think tanks, academics and local and federal leaders are increasingly recognizing that housing is infrastructure and that building more housing should be an integral part of the national strategy to build infrastructure for the 21st Century: • “Affordable housing should be viewed as infrastructure with an adequate supply assured through planning and implementation just as communities assure the availability of adequate retail, office, industry, schools or streets.” – The Urban Lawyer • “In rural America…infrastructure spending targeted toward housing—preservation or new—can boost the outlook for Main Street while providing an anchor for our most vulnerable families to achieve stability, and a shot at the middle class.” – Housing Assistance Council • “Affordable housing is a component of the nation’s infrastructure and a long-term asset that helps communities and families by connecting them to resources and opportunities.” – Representative Maxine Waters, Chair of the U.S. House of Representatives Financial Services Committee • “Communities across the United States face a severe shortage of affordable homes...One of the enduring lessons of the COVID-19 pandemic is the fundamental necessity of a home. In addition to providing safety and sanctuary, homes have become the center of much of our economy and education.” – Bipartisan Policy Center • “Safe, decent, and affordable housing is a vital part of our nation’s infrastructure.” – National Council of State Housing Agencies • “Investments in affordable homes increase economic mobility, strengthens communities, creates jobs and lifts local economies.” – National Low Income Housing Coalition • “Public housing plays a critical role in our nation’s public infrastructure, providing families with a stable home and helping them gain access to other services, including education and health.” – Council of Large Public Housing Authorities The vast scale of underbuilding and the enormous demand-supply gap will require a major national commitment to build more housing of all types by expanding resources, addressing barriers to new development and making new housing construction an integral part of a national infrastructure strategy. In order to demonstrate the nature and urgency of the problem, this report seeks to highlight: 1) the size of the existing underbuilding gap; 2) the negative consequences of underinvesting in housing; 3) the economic, fiscal and social benefits of building more housing; 4) the role of housing infrastructure in building inclusive communities and; 5) the need for a once-in-a-generation, holistic and coordinated policy response to address the nation’s chronic housing shortage and deteriorating housing affordability crisis.
Underbuilding Housing
The United States is in the midst of a severe housing shortage as a result of a persistent underproduction of housing during the last decade. From 1968 through 2000, the annual number of new housing units completed in the United States averaged 1.5 million. However, housing construction in the U.S. averaged only 950,000 new units from 2008 to 2020 and remained less than 1.3 million units in 2020, despite a recent, considerable increase in construction activity.
Chronic Underproduction of Housing Units
While the total stock of U.S. housing grew at an average annual rate of 1.7% from 1968 through 2000, the U.S. housing stock grew by an average annual rate of 1% in the last two decades and only 0.7% in the last decade, or less than half of the longer-term historical growth. When compared with the long-term average (1968-2020), which includes the period of dramatic underbuilding immediately following the Great Recession, the shortfall in housing completions totaled 5.8 million housing units since 2008. In order to better account for the period of elevated housing construction during the mid-2000s that preceded the onset of the Great Recession, RCG also examined the pace of housing production during the past 20 years. Even inclusive of the mid-2000s construction boom period, compared with the prior historical period (1968-2000), when

housing completions averaged approximately 1.5 million housing units per year, the underbuilding gap in the U.S. totaled more than 5.5 million housing units in the last 20 years.Alternatively, focusing on the period prior to the construction boom and bust of the 2000s as a baseline for a more typical period of historical construction in the U.S., the underbuilding gap in the past 12 years (2008-2020), increased dramatically to 7.2 million housing units compared with the historical period from 1968 to 2000. The large gap in housing production has contributed to an escalation in the cost of renting and rapid house-price increases— often the largest expense for households— exacerbating a growing affordability crisis in many parts of the country. It is also critical to note that the underproduction of the last decade took place in all building types, especially smaller, two-to-four-unit multifamily buildings. From 2001 to 2020, the average gap in single family housing production was slightly more than 100,000 homes per year, when compared with the long-term average from 1968 to 2000, for a cumulative gap of approximately 2 million single family homes. This gap placed severe strain on the single-family housing market and created a variety of issues, including an acute lack of inventory of homes available for sale, which in turn contributed to a rapid decline in single family housing affordability and limited access to homeownership. While this underproduction of single-family housing contributed to numerous major challenges in the for-sale housing market, these issues were compounded by the fact that new multifamily construction also did not keep pace with historical trends, creating a growing housing supply shortage and exacerbating the affordability crisis across the United States. From 2001 to 2020, the average annual gap in multifamily housing production for units in 5+ unit structures was 120,000 units, when compared with the long term average from 1968 to 2000, or a cumulative gap of nearly 2.4 million multifamily units. The significant underproduction of multifamily housing, and elevated demand from households priced out of the single-family market, placed a large burden on renter households and limited the ability for these households to save for major life events or spend money on goods or services other than housing needs. The starkest underbuilding shift was for units in two to-four-unit structures, a segment known as the ‘missing middle’ of housing production, which includes duplexes, triplexes and as well as smaller apartment and condominium buildings. Production of two-tofour-unit structures fell by nearly 75% during the last two decades, when compared with the long-term average from 1968 to 2000. The underproduction of these small multifamily buildings led to a large undersupply of what were historically more affordable homes and apartments, further exacerbating the affordability crisis across the country.
Demand-Supply Gap
While the underproduction of units measured through comparing historical trends with more recent trends provides a straightforward assessment of the issue, this metric of historical building does not directly account for demandside factors. As an alternative method of calculating the underbuilding gap, RCG also compared housing production to household formation. Using these measures, household formation alone exceeded housing production by nearly 3.2 million housing units from 2010 to 2020. However, this method does not take into account the destruction (e.g. storms, fires, floods, etc.), demolition or functional obsolescence of aging existing homes. Moreover, it does not consider the number of households occupying vacation and second homes. In practice, both factors detract significantly from the available stock of housing. To account for this, RCG used data from the U.S. Department of Housing and Urban Development (HUD), which reported that between 2009 and 2017, the U.S. housing stock permanently lost 2.6 million housing units, for an annual average of approximately 325,000 units lost. Applying this average pace of losses to the more recent period would translate to more than 3.6 million housing units lost from 2010 through 2020. When this loss of existing units is combined
with the underproduction of new housing units relative to household formation, the implied cumulative housing demand-supply gap totals 6.8 million units (where the Demand-Supply Gap = Household Formation + Lost Housing Stock – New Completions). While there is certainly a range of potential estimates for the size of the current problem, depending on the specific analysis, when considering both the historical underproduction and the metrics to capture the demand-supply gap, RCG believes that placing the current housing undersupply gap at approximately 5.5 million units provides a reasonable, albeit somewhat conservative, gauge of the magnitude of the problem, and a useful framework to guide solutions for the current housing shortfall. For reference, other sources placed the housing gap between a low of 3.8 million, generated by Freddie Mac in early-2021, and higher estimates of more than 7.0 million, generated by the Up for Growth National Coalition as of 2018, based on an assessment that was limited to the gap in the 23 most underbuilt states. Additionally, sources more narrowly focused on specific segments of the market, such as the National Low Income Housing Coalition, placed the gap for affordable rental units alone at 6.8 million, as of 2021. Therefore, an estimated housing production gap of 5.5 million units is well within the bounds set by major research organizations within the housing space.
Housing Shortfall by Geography
The shortfall in residential housing production extended across all regions of the country. Comparing the last two decades of annual housing production with the prior historical period (1968-2000), housing construction slowed significantly in every major U.S. region. Notably, relative to historical trends, out-migration and slower population growth account for some of the slowdown in housing production in the Northeast and Midwest regions. At a sub-regional level, using the number of units permitted, compared with the pace of jobs added by metropolitan area from 2012 to 2019, it is clear that the underbuilding gap extends across almost every major city in the country. Based on a simplifying assumption of two-earner households, it would be reasonable to expect demand for one housing unit for every two jobs created in a given housing market. However, by this measure, even

NMLS #654272

FEDERALLY INSURED BY NCUA. LOANS SUBJECT TO CREDIT APPROVAL. SEE CURRENT RATES AND TERMS.
FREE APPRAISAL
Looking for a home loan? Get Pre-Approved with a low rate at ucreditu.com
UFCU o ers up to $500 towards appraisal costs on new purchases or re nance loans when the purchase or re nance is completed with University Federal Credit Union. Appraisal costs up to $500 will be deducted from loan closing costs after the loan has funded; any amount exceeding that $500 credit is the responsibility of the lendee. This promotion cannot be combined with other o ers. Limit one appraisal credit per household. Promotion valid 04/21/2021 through 10/31/2021. Loans subject to credit approval. See current rates and terms.
metropolitan areas typically thought of as having relatively low barriers to building significantly underbuilt housing compared with the pace of job growth in recent years. For example, relative to job gains, the Riverside-San BernardinoOntario metropolitan area in Southern California underbuilt by an estimated 107,000 units from 2012 to 2019, while Las Vegas-HendersonParadise, NV only produced three-quarters of a housing unit for every two jobs added. From coast to coast, border to border, in cities large and small, in urban communities and in suburbs, it is clear that the United States has fundamentally underbuilt housing, a fact that has led to everincreasing affordability challenges and financial instability for millions of households.
New Supply Needed to Close the Gap
Looking ahead, in order to fill an underbuilding gap of approximately 5.5 million housing units during the next 10 years, while accounting for historical growth, new construction would need to accelerate to a pace that is well above the current trend, to more than 2 million housing units per year (approximately 550,000 more than the 1.5 million historical average). This would represent an increase of more than 700,000 units per year, or approximately 60%, relative to the pace of housing production in 2020 of less than 1.3 million units. To provide further context, nationally, new housing starts reached a seasonally adjusted annual rate of slightly more than 1.7 million units in March 2021. This increase was a significant acceleration from previous years, and marked the highest pace of housing starts since 2006. However, emphasizing the need for large-scale investment to expand housing production, even if building were to continue at the current pace—the most rapid pace in more than a decade—it would still take more than 20 years to close the 5.5-million-unit housing gap.
The underbuilding gap of the last two decades produced a wide range of negative externalities and contributed to a series of major consequences that have severely affected communities across the U.S.
Residential Underinvestment
The vast scale of the underbuilding and the associated lack of residential investment cost the U.S. economy trillions of dollars in lost economic activity in recent years. Historically, from 1960 to 2020, the sector of economic activity that includes housing construction and renovation— residential fixed investment (RFI)—accounted for approximately 5.0% of total GDP. However, during the past 12 years (since 2008), RFI accounted for only 3.0% of GDP, representing a significant decline in investment in housing infrastructure relative to the size of the national economy. Even including the period of elevated building in the mid-2000s, RFI averaged 3.8% of GDP during the past 20 years. In terms of lost economic activity, this prolonged shortfall in residential fixed investment translated to a $4.4 trillion gap in housing investment during the past two decades (2001-2020), compared with a business-as-normal scenario in which residential investment remained at the long-term average of 5% of GDP (1960- 2020). Alternatively, if the RFI during the past two decades is compared with the prior historical period (1960-2000), when the share of GDP averaged 5.6%, this gap would be significantly larger, with an estimated underinvestment in housing of approximately $6.4 trillion.
Limited Household Formation
Underbuilding and the growing affordability crisis dramatically limited the pace of household formation, particularly among millennials in the past decade. In fact, the number of adults aged 25 to 34 years living at home with parents surged by 2.5 million since 2010 and more than doubled from 2000 to 2020, increasing by 4 million people. Even based on a conservative assumption of two adults per millennial households, the increase since 2010 would represent an enormous pool of 1.25 million potential households, reflecting the large scale of pent-up housing demand that could be unlocked if there was sufficient affordable and available housing. Moreover, it is worth noting that this does not consider what would likely be significant demand from single-person millennial households. The addition of this demand from unformed households to the aforementioned figures would significantly increase the underbuilding gap, further highlighting the need for dramatic policy intervention.
Aging Existing Housing Stock
In addition to the negative impact on the ability of new households to form, the underbuilding gap dramatically shifted the age of the existing U.S. housing stock during the past two decades. As of 2000, prior to the early 2000s housing boom and subsequent extended period of underbuilding, one third of the U.S. housing stock was more than 40 years old, while slightly more than 16% was 10 years old or newer. In contrast, by 2019, the majority of housing units were 40 years old or older, while the share of homes built in the last 10 years declined rapidly to less than 7.5%. The aging stock of housing not only increases ongoing maintenance costs, but also makes it
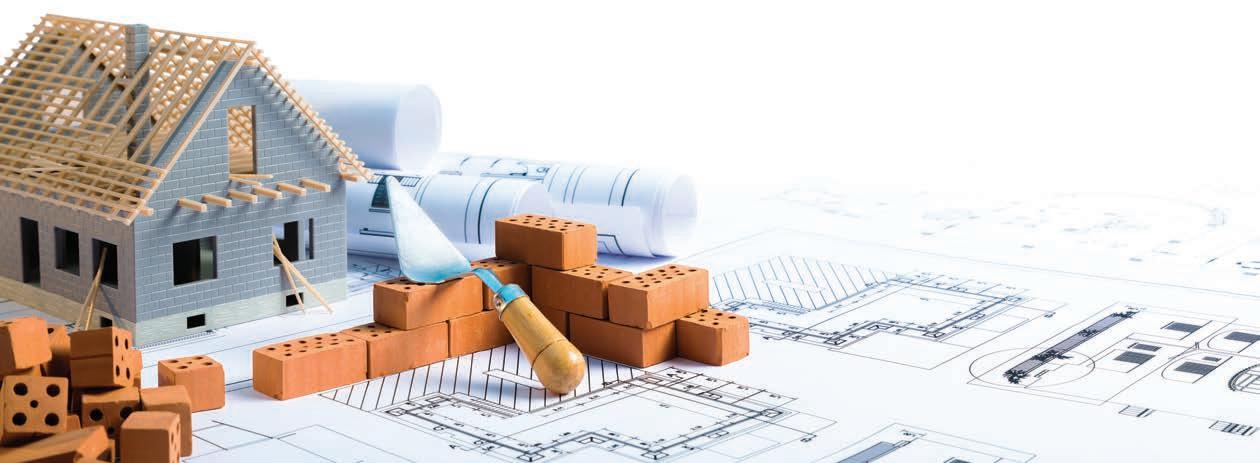
Romolo Tavani©/ Adobe Stock
likely that more units will begin to reach the point of functional obsolescence in the coming years, a factor that would further contribute to the loss of existing stock, as described earlier, and further reduce available housing, expanding the demand–supply gap. This problem is even more apparent in some of the major northeastern cities in the U.S., such as New York, Boston and Philadelphia, where more than 60% of the housing stock was built more than 50 years ago, as of 2019. However, the issue is most acute in many industrial hubs such as Buffalo, Pittsburgh and Cleveland, where this share is 70% or more. The aging housing stock across the country poses a significant challenge going forward as these homes continue to deteriorate and are increasingly removed from the housing stock, further contributing to the underbuilding gap and hampering the ability for households to form and access the types of housing that best meet their needs.
Unsustainable Strain on the Housing Market
In addition to these issues, underbuilding placed a significant strain on the for-sale housing market in recent years, as the inventory of homes available for sale steadily declined prior to the pandemic, before reaching historic lows amid the pandemic. Specifically, during the period from 1996 through 2016, the months’ supply of existing for-sale housing averaged 6.1 months, which translated to a monthly inventory of 2.5 million homes available for sale. However, from 2017 to 2019 the average months’ supply of inventory declined to 3.9 months, or a monthly inventory of 1.8 million homes available for sale. In and of itself, this posed a major challenge to the U.S. housing market as the supply of for-sale housing and access to the American Dream of homeownership was severely constrained by a lack of inventory. While there were numerous factors contributing to this trend, the prolonged period of underbuilding was undoubtedly a major factor that contributed significantly to the problem. More recently, the COVID-19 pandemic greatly exacerbated this issue. In January 2021, the supply of inventory plunged to 1.9 months, or 1.0 million homes available—the lowest level since tracking began in 1999—and one third of the historical average. The situation did not improve significantly through March, and the number of homes available for sale was 28.2% less than in March 2020. This extremely constrained level of supply limits the ability for households to a) shift to homeownership and buy a home, b) move up or c) downsize, and in-turn, vacate the stock they currently occupy. This inhibits the normal functioning of the housing market and limits ‘filtering’ of homes and apartments—or the natural tendency for housing units to transition to a greater level of affordability over time. As buildings age, higher-income occupants transition to newer units, and existing tenants transition to more affordable units. Perhaps most critically, the extreme shortage of for-sale inventory contributed to an untenable scenario in which robust demand is competing for a limited supply, driving housing prices higher, reducing affordability and making homeownership less accessible for low-andmoderate income (LMI) households.
Housing Affordability Crisis
The demand-supply gap in housing during the last two decades, and a constrained supply of housing units generally, fueled rapid price increases that outstripped income growth across the country. Even prior to the rapid homeprice growth during 2020, from 1999 to 2019, the median home price in the U.S. increased by nearly 30%, cumulatively, while the median household income increased by less than 11% during that same period. This significantly more
rapid pace of home-price growth meant that many households were no longer able to afford the monthly payments needed to purchase the median-priced home. Using the RCG measure of affordability, which utilizes traditional mortgage and down payment assumptions to determine the share of households able to afford the median-priced home, housing affordability decreased in 45 of the 50 states from 2012 to 2019. In fact, among these states, the share of households able to afford the median-priced home declined by an average 7.2 percentage points. The largest declines were in the Mountain West, including Nevada, Utah and Idaho, as well as states with sizable population growth like Georgia. In all of these states, the share of households able to afford the median home price declined by more than 15 percentage points (as seen in the nearby maps). Broadly, single family housing affordability declined across the country, from the Sunbelt to the Snowbelt. In this strained environment, addressing the underbuilding gap that the nation faces would help alleviate some of these affordability challenges and promote economic opportunity. In the for-sale housing market, improving single family affordability would expand pathways for wealth building and homeownership, especially for segments of the population which have been unable to do so in recent decades. This includes those with large student loan burdens, low-tomoderate income households and households of color. In fact, with a gap between Black and White (Non-Hispanic) homeownership of nearly 30 percentage points, the national racial homeownership gap is as wide as it was in the 1960s, before the passage of the Fair Housing Act of 1968, when housing discrimination was still legal.9 Considering the current challenges, expanding the supply of available and affordable housing will be critically important to support increased racial equity in housing going forward, as communities of color and those with low-to-moderate incomes not only faced the largest housing-cost burdens before the COVID-19 pandemic, but were disproportionately affected by job losses and financial hardships resulting from the pandemic and the related shutdown of in-person business activity. More broadly, increasing access to affordable and sustainable homeownership would provide a wide range of social, educational and financial benefits to households, and positive externalities for neighborhoods and communities across the nation.10 In addition to the for-sale housing market, renter households faced severe negative consequences from the past two decades of underbuilding. The State of the Nation’s Housing, 2020 report, from the Harvard Joint Center for Housing Studies, found that the number of cost-burdened renter households—those spending 30% of their income or more on housing—increased by 37.8% from 2001 to 2019.11 This translated to a 5.6 million increase in the number of cost-burdened renter households, and a 6% increase in the share of renter households around the country who were burdened. As of 2019, even before the large financial burdens placed on renters by the COVID-19 pandemic, more than 40% of renter households were cost burdened, while nearly one quarter were ‘severely burdened,’ or spending more than 50% of their income on housing. The severely burdened group alone grew by nearly 3.1 million households from 2001 to 2019. It should also be noted that this increase was not proportional across racial categories. The increase from 2001 to 2019 in the number of cost-burdened households was significantly greater among minority households than among white households, with the largest increase occurring among Hispanic households at 81.4%, followed by Asian/Other at 59.6% and Black at 50.4%. By comparison, the number of cost-

Join today to get your first 6 MONTHS FREE!
• 100% COMMISSION from Day One
• Lowest Monthly & Transaction Fees • FREE Cutting Edge Technology Platform • Dynamic Lead Generation System • Exceptional Support Staff • E&O Insurance Included
222 S. Main St. Suite 500 CALL TODAY 1-844-535-5974 www.kellyright.com
join@kellyright.com
License # 11161430-CN00
*We will waive your monthly fee of $79/month for the first 6 months. Mention this exclusive offer when you call in and include code SLC6 on your join paperwork.
Kelly Right Real Estate - The Right Way Home
burdened, white renter households increased by 21.0% from 2001 to 2019, while the total number of cost-burdened renter households grew by 40.4%. Additionally, the number of ‘severely burdened’ Hispanic households nearly doubled during the nearly two-decade time period. These increases exemplify the necessity for housing infrastructure solutions that can tackle the need for more supply on a large scale and can more equitably address the housing shortfall and affordability crisis.
Critical National Infrastructure
Treating housing as infrastructure, and attempting to relieve the cost burdens placed on millions of renter households, as a result of the large undersupply of housing, could provide substantial benefits for households and the economy. Notably, it would provide funds for other living costs, such as child care, health care, education or student loan payments, and raise the quality of life for renters currently struggling with mounting housing costs. Reduced cost burdens would also allow renters to save or spend on other items, producing increased economic activity and tax revenue for the economy at large. Finally, by allowing households to save and build wealth through greater housing affordability, addressing the underbuilding gap would help provide a path towards homeownership for households looking to do so. For these reasons, and in order to address a national crisis of a size and scale that is severely limiting financial stability and economic opportunities for millions of Americans, the housing underproduction gap must be treated as a critical piece of infrastructure in the United States. Like roads and bridges, affordable housing is a long-term asset that provides a safe, quality living environment for families. Increasing and preserving the supply of affordable housing— especially in areas connected to good schools, well-paying jobs, health care and transportation— will help more families climb the economic ladder and help communities meet their workforce needs. When it comes to housing, this means our children’s future, health, education, social and racial equity, opportunities for economic mobility, among many other potential benefits, but the scale and complexity of the problem in many local areas make it increasingly difficult to tackle without large-scale national solutions.
Benefits of Making New Housing Construction an Integral Part of a National Infrastructure Strategy Economic Impact of New Construction
The potential economic impacts that could be generated by significantly expanding new housing construction would extend into numerous areas of the economy. In the immediate term, significant local employment gains would be generated from single family homebuilding and multifamily development. Benefits from new employment include income generated and spent in the local economy. New disposable income generated per employee is typically spent on a variety of items such as food, clothing, transportation, health care and a range of other services, creating a positive multiplier effect that further adds to economic activity throughout the local and regional economy. Additionally, wages and salaries of workers are subject to federal, state (where applicable) and sometimes local income taxes, while increased spending fueled by this income is subject to sales taxes (in most states). Together these factors would generate a large, positive fiscal impact across all levels of government. During the planning and construction process, there are a variety of sectors and subsectors that benefit from increased activity associated with new housing construction, including professional and business services, financial activities, retail trade and transportation services. Supply chain operations within these sectors also benefit from increased spending directed towards labor, materials, architectural and engineering services, overhead, insurance, taxes and other costs associated with construction. Similar to employee wages and salaries, the profits of these businesses may be subject to federal, state or local taxes. Moreover, many states also collect sales tax on materials sold to homebuilders and multifamily developers, while most local jurisdictions charge fees for approving building permits and extending utility services, and in some cases, a range of other revenue sources or in-kind benefits for the local community. Upon completion of new housing units, new household formation, supported by greater availability and affordability of housing, provides an additional source of ongoing spending and revenue within the local economy. In the case of new rental units, monthly rent payments also provide a source of ongoing economic activity, while home purchases are typically accompanied by considerable additional consumer spending on goods such as home furnishings, which further add to total economic activity.
Methodology
In order to measure the potential economic benefits generated by large-scale infrastructure investments in new construction activity, RCG used IMPLAN, a nationally recognized inputoutput modeling system, to provide economic multipliers to determine the impact that construction of certain property types has on employment, income and overall economic activity
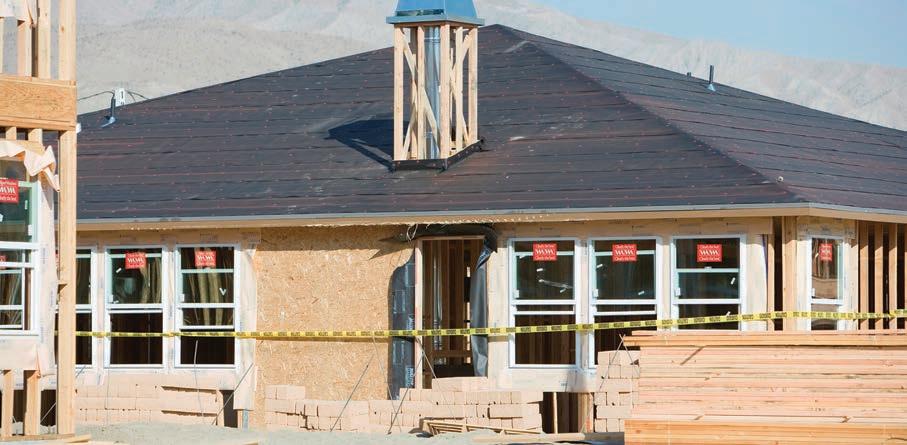
Image licensed by Ingram Image
across the nation. Multipliers for construction activities are generally considered temporary in nature for individual projects; however, given the ongoing levels of demand and the large underbuilding gap, the need for a prolonged period of elevated construction activity would be expected to translate to much longer-lasting benefits compared with the economic impact derived from any individual development project. Of particular importance from the perspective of infrastructure spending and the potential macroeconomic benefits for the national economy, the economic multiplier effects of spending on new housing construction are comparable to or even larger than many other types of infrastructure spending such as construction of highways and streets. In fact, based on national data from IMPLAN, every $1 million in direct spending on the construction of multifamily units would be expected to create 19.6 new full-time jobs and to generate approximately $359,000 in new federal, state and local tax revenue (including direct, indirect and induced measures).12 Similarly, every $1 million in spending on the construction of a single-family home would generate 17.6 new jobs and approximately $347,000 in new taxes. In comparison, the economic impact of multifamily and single-family home construction is somewhat greater than the same spending on the construction of highways and streets, which would generate 14.4 new fulltime jobs and $303,000 in new tax revenue. As highlighted previously, to reduce the supply deficiencies in the national housing market over the next 10 years, approximately 550,000 additional new housing units would need to be constructed per year over and above the historical trend of 1.5 million new units annually. The costs associated with this new development are estimated based on recent construction costs in 2019. Specifically, the National Association of Home Builders reported that the average cost for the construction of a single family home was approximately $296,700 in 2019. The average cost for construction for multifamily units nationally was estimated at $233,500 per unit, which incorporates the national average cost per square foot from RSMeans of $205 and the average multifamily unit size from the U.S. Census Bureau of 1,139 square feet for housing units completed in 2019. Notably, construction costs increased sharply through 2020 and early 2021, particularly for lumber. As such, average construction costs per home and per unit likely understate the direct spending and therefore the total magnitude of the economic impact of new construction activity. Lastly, generally consistent with the trend from 1968 through 2020, when 71.8% of new housing completions represented single family housing and 28.2% represented multifamily, RCG applied a distribution of 70% single family and 30% multifamily in order to estimate the potential economic impact from increased new construction. Note that this assumption is based on historical trends and is intended to provide a reasonable, broad estimate of construction rather than a proscriptive view of what will or should be built. Indeed, this historical distribution could certainly shift over time and across stages of the business cycle, based on numerous demand and supply factors including consumer demand preferences, interest rates and mortgage credit availability, land and capital availability, local zoning requirements, as well as construction costs and technology.
National Economic Benefits
Based on these estimates of national housing construction costs and the distribution of single family and multifamily completions, RCG estimates that building 550,000 additional new homes per year for the next 10 years would support an estimated 2.8 million new jobs
nationwide, spread across numerous sectors in the economy, and generate approximately $411 billion per year in additional economic activity (including direct, indirect and induced measures). Notably, these estimates of the potential macroeconomic impacts of the kind of largescale construction of new housing that would be necessary to rebuild the nation’s housing infrastructure are based only on the needs of refilling the underbuilding gap with new supply, and do not include the considerable additional costs of deferred maintenance for the aging stock of existing housing.
Fiscal and Social Benefits
Beyond the critical housing need and the enormous, potential economic benefits, rebuilding our national housing stock at the scale needed to fill the underbuilding gap would generate large fiscal, social and community benefits. In addition to new employment and economic activity, the construction of 550,000 additional new homes per year would be expected to generate more than $53 billion dollars annually in new tax revenue, including $18 billion in state and local taxes and $35 billion in federal taxes, reflecting a wide range of activity, including substantial new federal income taxes related to new job creation, as well as taxes on production and imports net of subsidies, sales taxes, property taxes and other forms of revenues generated through the construction timeline. Of particular importance for communities around the country, taxes generated by new housing supply would add to local property tax revenue. In fact, property tax revenue accounted for approximately 72% of all local tax collections as of 2018, according to data from the U.S. Census Bureau, and is a major source of local funding for K-12 education, parks, first responders and many other essential community services.15
Housing Affordability
Dramatically increasing the pace of new home construction and expanding the supply of all types of housing is the only way to substantially reduce the size of the current demandsupply gap and thereby stabilize housing costs in a more affordable range. Increasing the supply of available homes, including single family, multifamily, market rate and affordable housing across the full income spectrum, would be the best way to bring the pace of rent growth and home price appreciation more in line with the trajectory of household incomes. Moreover, this kind of large-scale effort would begin to unlock the backlog of pent-up housing demand by supporting household formation, especially among the millions of millennials currently living at home with parents. From a macroeconomic perspective, new household formation and greater levels of affordability would be expected to lead to significant potential for increased overall personal consumption expenditures, as individuals with more disposable income seek to improve their day-to-day lives. This factor would not only benefit these households and businesses in their local communities, but would also stimulate additional economic activity across the national economy. Greater levels of economic activity across the nation would further help to reduce joblessness in a period of continued, profound economic weakness for large segments of the population. The positive impact of major initiatives to accelerate new housing construction would likely extend far beyond these more direct economic measures. Among other benefits, increased housing affordability would: • Translate to improved labor market mobility, making it possible for households to seek out new job opportunities wherever they are available. • Provide greater financial stability, enabling individuals and families to keep up with other rising costs of living such as education, health care and child care. • Enable more households to save for college, retirement or unexpected future expenses. • Increase the ability of many households to save for the down - payment on a future home purchase, expanding access to the American Dream of homeownership, narrowing the racial homeownership gap and providing opportunities for building wealth that could help to close the national racial wealth gap over time. • Help to reduce or prevent homelessness in communities around the nation. Importantly, the combination of increased economic opportunities, expanded availability of affordable housing, greater mobility and financial stability would be particularly beneficial for low-and moderate income households and communities of color currently facing the greatest housing cost burdens.
Policy Considerations: The Crisis Demands a Once-in-aGeneration Response
Amid the urgency of our ongoing public health crisis, a more systemic, longer-term crisis festers. As a result of decades of underbuilding and underinvestment in our critical national housing infrastructure, there are simply not enough homes available to affordably house our nation’s population. Sadly, there is no silver bullet to
solving the chronic national shortage of housing. What is clear, however, is that the scale of the problem is enormous, and any serious effort to fill the underbuilding gap and address the affordability crisis will require a major national commitment to build more housing. While there is a wide range of potential policy pathways that could help to increase the pace of housing construction, considering the magnitude of the problem, measurable progress will likely require an all-of-the-above strategy that supports housing of all shapes and sizes across the full income spectrum, including affordable and market-rate housing, urban and suburban housing, new construction, redevelopment and conversions of underutilized non-residential structures, as well as a mix of single family homes, townhomes, duplexes, and multifamily apartments and condominium buildings both large and small. In particular, increased development of belowmarket or subsidized affordable units is necessary to address the urgent requirements of low-income households most in need. However, housing that is affordable to middle-income households, young families and essential workers is also in critically short supply. Moreover, with thoughtful planning that integrates new development with planning for other forms of community infrastructure such as transit, new housing focused on higherincome households can also help to significantly ease supply-side pressure by freeing up existing housing units. Considering the need to accelerate the pace of construction far beyond both current and historical production (even to tackle the problem over a period of 10 or 15 years), it will be necessary to dramatically expand resources for new development and address many of the most critical barriers to housing development. Among many other promising ideas, housing infrastructure investments should seek to: Address large shortages in capital and lending for the development of affordable housing by expanding resources and maximizing the potential of existing programs. Examples include: • Increase and expand the scope of the Low Income Housing Tax Credit (LIHTC) program, which has been highly successful at building multifamily housing but often requires intense competition or multiple rounds of applications for projects to receive the funding needed to move forward with development. • Incentivize investment in distressed urban, suburban and rural neighborhoods through the Neighborhood Homes Investment Act (NHIA), which would create a new federal tax credit for the development and renovation of singlefamily homes and two-to-four-unit buildings. • Bolster resources and accelerate or expand existing programs such as HUD Community Development Block Grants (CDBG), USDA rural housing services, Federal Housing Administration (FHA) multifamily insurance, the National Housing Trust Fund (HTF), Opportunity Zones, etc. Incentivize shifts in local zoning and regulatory environments to substantially increase the quantity and density of developable residential space. • Encourage cities and states around the country to responsibly eliminate or reduce hurdles that prevent or delay building, particularly limitations on density. • Examples include: upzoning existing residential areas, eliminating minimum lot sizes, rezoning commercial sites to accommodate residential construction, implementing density bonuses, reducing parking requirements for transitoriented developments and adopting fasttrack review and by-right development. • Strategies could include grants, loans, contingent funding, new local financing mechanisms such as zoning improvement tax credits and coordinated efforts to plan for housing alongside other types of infrastructure. Increase housing supply by incentivizing conversions of older or underutilized commercial space through tax credits or other means. • Following decades of structural shifts in the national economy, many parts of the country have a sizable stock of underutilized commercial space, including former manufacturing facilities and older and largely vacant malls. Moreover, in the wake of the pandemic, shutdowns added significantly to vacancy in the hardest-hit commercial real estate sectors, including retail, hotel and office buildings. • However, conversions can prove time consuming and costly, particularly in cases where environmental cleanup or historical preservation is a component of the conversion. • Beyond incentives for rezoning at the municipal level, federal tax credits for converting existing underutilized non-residential properties to new housing could prove particularly effective in reducing funding gaps and making conversions possible, thereby helping to narrow the residential underbuilding gap over time. • Notably, this approach would not only address the goals of creating housing and adding jobs but could also help mitigate some of the most pressing challenges in the hardest-hit commercial
(continued on page 38)
LA FUCINA
La Fucina is a container for contemporary design. Here, sophisticated simplicity is the definition of luxury. This 1955 remodel has been given new life as Salt Lake City’s first look into the world of contemporary Italian architecture. From the exterior shape to the interior layout, the quality of the materials to the expertise of the artisans, every detail was thought of, designed, and realized with the intent to bring Italy to the US.
FOR SALE $2,575,000
1828 S. 2600 E. SLC 84103 4,450 sq. ft. 5 bed 3.5 bath
For more information please contact: Equity Real Estate Advantage Brittany Brackenbury (925) 852-9115 Office brittanybrack@gmail.com

