• Change in Perspective: A National and Regional Context
• Shifting Behavior Patterns and Active Transportation
• Housing Construction Fares Well In Face of High Interest Rates
• Demographic Outlook 2025 for Central Arkansas
• Statistical Supplement
About Metroplan
Metroplan is a voluntary association of local governments that has operated by interlocal agreement since 1955. Metroplan now has members in five counties of the six-county metro area. Metroplan is the designated metropolitan planning organization (MPO) under Title 23 of the United States Code.
Metroplan serves as the regional voice on issues affecting Central Arkansas, develops transportation plans required by federal law, convenes stakeholders to deal with common environmental issues, and provides information and staff resources to our member local governments, the business community and the public. As part of that mission, Metroplan publishes Metrotrends twice yearly. The spring/ summer edition is normally the Demographic Review and Outlook and the fall/winter edition is the Economic Review and Outlook.
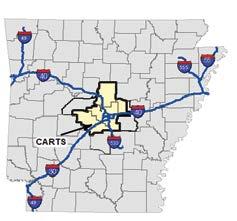
About CARTS
The Central Arkansas Regional Transportation Study, or CARTS, is the cooperative effort by the participating communities, transportation providers, and many other interested parties to develop a long-range transportation plan for the metropolitan area.
Metroplan’s Demographic Review and Outlook is an annual chronicle providing demographic and housing data and insight for the Little Rock-North Little Rock-Conway MSA.
Prepared by: Jonathan Lupton—research, writing and editing
Lynn Bell—graphics, layout, and editing
Photographs by Metroplan staff except where noted. Cover image by iStockphoto.com
This report was funded in part through grant(s) from the Federal Highway Administration and Federal Transit Administration, U.S. Department of Transportation. The views and opinions of the authors expressed herein do not necessarily state or reflect those of the U.S. Department of Transportation.
Notice of Nondiscrimination: https://tinyurl.com/yrp24d8a
Mid-decade Arrives
lthough it’s hard to believe it, we’re already passed mid-decade. Metroplan estimates that Central Arkansas has a population just short of 775,000. In the five years since 2020, the region has grown at a 0.7 percent annualized rate, a bit faster than state and national averages. Most of this growth can be attributed to net in-migration. The region’s natural increase (i.e. births over deaths) is still positive, but the margin between mortality and fertility is quite thin.
The chart at right depicts comparative growth via annualized rates, allowing equal comparison between different time spans. Central Arkansas (the Little Rock MSA) continues growing population slightly faster than U.S. and state averages. The regional growth rate is about the same as during the 2010–2020 decade.
Pop_Chg_Table+Chart25a
The chart below shows county growth trends in two intervals, 2010–2020, and 2020–2025.1 Faulker, Grant, and Perry counties grew faster in the more recent interval. Pulaski and Saline Counties appear to have grown just a bit more slowly, but the 2020–2025 figures are estimates only.
Annualized Population Growth 2000-2025
Annualized Population Growth 2000-2025
Source: Decennial census 2000-2020, with Census estimates for 7/1/2024.
The fastest-growing small city: Ward at In Central Arkansas +19%
Annual Rate of Population Change by County 2010-2020 and 2020-2025
Annual Rate of Population Change by County 2010–2020 and 2020–2025
2020-2025 2010-2020
Source: Decennial census 2000 and 2020, with Metroplan estimates for 2025,
The fastest-growing large city: Benton at +8%
1The chart depicts population growth via annualized rates, to allow direct comparison despite differing time intervals.
Saline
Pulaski
Perry
Lonoke
Grant
Faulkner
Components of Change 2020–2025
Population change in the 2020s has moved slowly. The total number of births in the Little Rock MSA has continued slowly declining. In 2021, during the COVID-19 pandemic, regional births exceeded deaths by less than 300. By 2024 the gap had widened with more than 1,000, but as the chart below shows, the gap between births and deaths remains smaller than it was back in 2010. As a result, the region showed only slow natural increase. The bulk of regional population growth came through in-migration.
The components of change table below gives a detailed demographic breakdown of population change by county for the six-county Little Rock MSA. The figures are estimates, with some margin for error, particularly in the migration category. Looking under “natural increase,” or the excess of births over deaths, the figures showed a net gain in just three of the region’s six counties: Faulkner, Lonoke, and Pulaski. In the other three, deaths slightly exceeded births. In-migration was greatest to Saline County, followed by Faulkner County. In every case, however, migration accounted for most of the population growth.
Rising mortality rates, seen both in Central Arkansas and the state as a whole, stem at least in part from aging population. A larger share of population is in the older age groups, which have higher mortality rates. Some of the rise in mortality also has to do with the COVID-19 pandemic, although impacts of the disease have diminished since about 2022. Arkansas is one of twenty U.S. states that saw more deaths than births in the 2020–2024 interval.1
Sources: U.S. Centers for Disease Control and Arkansas department of Health. Figures post-2016 are provisional.
Source: Arkansas department of Health. Figures are provisional.
Births and Deaths
3 counties in Central Arkansas showed a small gain of births over deaths from 2020–2025. In the other 3 counties, deaths slightly exceeded births.
Sources: U.S. Centers for Disease Control and Arkansas Department of Health. Figures post-2016 are provisional.
U.S. Bureau of the Census, population estimates from FSCPE, years 2020 through 2024.
Population Change
Little Rock-North Little Rock-Conway MSA Population Change 2020–2025
*Small community populations are generally under 1,000 ** Represents portion of Alexander by county ***Official MSA since May 2003
Among regional cities, the small cities of Ward, Austin and Bauxite have led the growth trend, with rates exceeding 15 percent in the past five years. Ward is now the region’s tenth largest city, with a population of over 7,000.
Benton grew fastest among the region’s larger cities, exceeding 8 percent growth, reaching 38,000. Conway followed with 7.7 percent to 69,000. Bryant was third, with 5.6 percent growth and a population nearing 22,000.
Pulaski County cities grew more slowly. Sherwood grew 3.8 percent, edging out Maumelle (3.5 percent) as the county’s fastest growing city. North Little Rock grew about 3.2 percent, Little Rock at 1.5 percent and Jacksonville at 1.3 percent.
Change in Perspective: A National and Regional Context
A region’s population does not change in isolation. Instead, there’s usually a regional and national context. During the 2020–2024 period, Arkansas ranked 19th among the 50 states for population growth, and its growth rate of 2.6 percent was just about the same as the U.S. average.
The Little Rock MSA grew by 2.8 percent from 2020 to 2024, based on U.S. census estimates.1 This was a little faster than the U.S., and just a bit slower than average for all U.S. metro areas. The table below shows this in context of all MSAs in the U.S. As you can see, Central Arkansas belongs to the category of metro areas with 500,000 to 1 million population. This group of metros saw the fastest overall population growth in the 2020–2024 period, at 4.4 percent.
The next table gives context for the U.S. West South Central (WSC) Census region, which includes the states of Arkansas, Louisiana, Oklahoma and Texas. Trends here differed sharply from the U.S. average. The largest metros grew fastest as a group. Within this category Austin led the list with 11.2 percent growth, followed by Dallas-Fort Worth at 9.2 percent, Houston at 9.0 percent and San Antonio at 8 percent. Within the WSC region those four large metro areas accounted for 82 percent of all metropolitan population growth. The overall growth rate of 6.2 percent for WSC metros was more than double the U.S. metro average.
U.S. Metro Area Population Analysis 2020-2024
* Based on Census Bureau West South Central Region: Arkansas,
Shifting Behavior Patterns and Active Transportation
The COVID-19 pandemic shifted a lot of trends in U.S. society. One of them was that the share of people driving to their jobs increased, while the shares using transit or active transportation modes declined. The biggest change was the share of people working from home, shown in the chart below. The shift toward working from home was less dramatic in Central Arkansas, but also has declined by less in the years since.
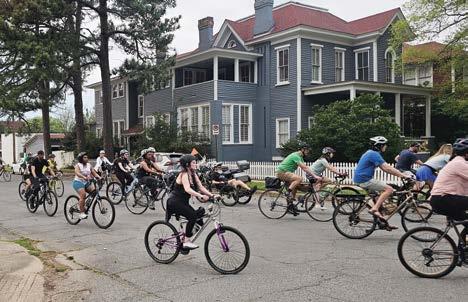
The table at right shows the share of workers who walked or biked to work in the years 2013, 2018 and 2023. Even highly pedestrian-friendly metro areas like Portland, Oregon and New York City, saw a decline in the share of workers using active transportation. While Central Arkansas has ranked low on this measure, it defied the trend, with a rise in commuting on foot and by bike. It is possible that recent improvements to pedestrian facilities, including bridges and trails, have helped boost the local trend.
Share of Workers Who Walked or Biked to Work
Source: American Community Survey 5-year data. Source: American Community Survey 5-year data.
Source: ACS 1-Year data. U.S. data for 2020 classified "experimental." No data Little Rock MSA in 2020.
Share of Workers Working from Home 2018–2023
Share of Workers Working from Home 2018-2023
The share of Central Arkansas workers commuting to jobs by bike or on foot has risen in recent years..
Pedal Party is a weekly social bicycle ride through Little Rock and Argenta, North Little Rock. The group meets on Monday nights at 6 p.m. and takes a different route each time, stopping along the way for food and refreshments at local small businesses and city parks. The average ride is about five miles. The gatherings are familyfriendly, inclusive, and average about 100 riders a week. The rides foster friendships and provide a chance to get familiar with ways to safely ride around the area.
Housing Construction Fares Well In Face of High Interest Rates
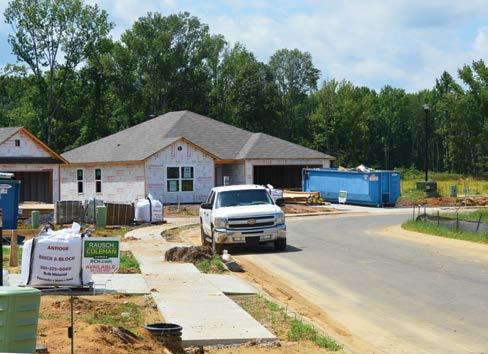
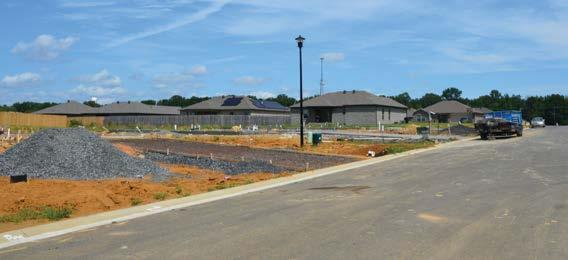
Growth in new housing units veered down in 2024, due to a slowdown in multi-family construction. Single-family housing construction in Central Arkansas defied high interest rates during 2024, rising above 2023 levels. Single-family housing permits rose 18 percent compared with 2023, and most of this housing construction started before the Federal Reserve eased rates down slightly during the fall of 2024. The fastest uptick in new homes occurred in Bryant, rising 88 percent above 2023 levels, while Benton and Cabot also saw rises of over 50 percent. North Little Rock ranked third for total single-family permits, rising 38 percent above its 2023 level. Most other markets were also up, although Little Rock and Sherwood declined a small amount and Conway saw a 30 percent dropoff. The chart on page 7 compares interest rates with the local housing construction trend. The local trend has ticked up a bit since rates dropped in late 2024.
Multi-family housing dropped by more than half in 2024 compared with the previous year. While this bears watching, the multi-family sector is statistically lumpy, since major complexes can add several hundred units in a month. The quarterly trend shown below conveys an uptick in early 2025, with nearly 400 new units permitted.
Trends in interest rates will matter going forward but are notoriously hard to predict with political as well as economic factors in play. In the meantime, the Central Arkansas region retains a housing cost advantage over similar and larger metro areas.
Housing Unit Permits 2021–2024
* Totals exclude Hot Springs Village, which
Central Arkansas Quarterly Housing Unit Permits by Type 2022 to Early 2025
Central Arkansas Quarterly Housing Unit Permits by Type 2022 to Early 2025
Owner-Occupied Homes as Share of Total 2023
Prime Interest Rate vs. Central AR Single-Family Unit Permits January 2019 - May 2025
Prime Interest Rate vs. Central Arkansas Single-family Unit Permits January 2019–May 2025
Source: ACS five-year 2013, 2018 and 2023.
Source: ACS five-year 2013, 2018 and 2023.
Source: ACS five-year 2013, 2018 and 2023.
Source: ACS five-year 2013, 2018 and 2023.
Source: ACS 2023 five-year.
Source: ACS 2023 five-year.
Source: Federal Reserve Bank of St. Louis.
Source: U.S. Bureau of the Census. Housing vacancies and homeownership, (CPS / HVS), table 8. U.S. Owner-Occupied Homes as Share
Source: ACS
Source: ACS 2023 five-year.
Homeownership and Housing
Amid a lot of talk about “housing crisis,” it is useful to look at the underlying statistics of housing. Despite the challenges posed by high interest rates, about 65 percent of American homes are owner-occupied. In Central and Northwest Arkansas, the rates are nearly the same: almost 64 percent in the former, and over 62 percent in the latter.
The second chart shows the long-term trend since 2000. Homeownership peaked at 69 percent around 2004, then slid to barely 63 percent around 2015. Since then, it rose until about 2020. Aside from a minor statistical hike generated by pandemic conditions in 2020, it has held roughly even in the 65–66 percent range.
There may be a “crisis” when people cannot afford to live in the neighborhoods they would like, or when high-cost, mostly coastal cities have prohibitive costs. But the data tell us homeownership is more widespread than it was a decade ago.
New homes in the Deerfield Estates subdivision in Ward.
Demographic Outlook 2025 for Central Arkansas
In times of economic turbulence, demographic analysis offers a dose of predictability. The Central Arkansas region has a track record of steady population growth. Natural population increase—the excess of births above deaths—continues, albeit slowly. There is also a net migration inflow. The region’s suburban counties are growing faster than the core. Some of the smallest cities, places like Ward, Greenbrier, Austin and Vilonia are its fastest growing, but even the largest cities are seeing population growth.
Metroplan has not made an official long-term population forecast since 2018. The chart below offers a couple of population forecast scenarios for the four-county Metroplan planning area to 2050.1 The Base Forecast is the original projection made in 2018, with the same final population in 2050 (about 914,000) but modified to allow for recent known population change through 2025. The Revised Forecast offers an alternative based on the trend seen from 2010 through 2025. The forecast is a little slower, yielding a population of about 867,000 by 2050.
Even under the slower trend, the region will see a population of 770,000 by 2030, or 25,000 additional people. Looking forward, a critical factor is household size. As the chart at bottom right shows, the average number of people per household in Metroplan’s four-county planning area has
dropped from 3.37 in 1950 to about 2.39 in 2020. It will probably drop a little further, to about 2.33 by 2030.
This is useful to know, because it helps with forecasting the number of housing units the region will likely need, or “future housing absorption” in real estate lingo. Based on the revised population forecast (bottom left chart) and the household size prediction (bottom right chart), one can expect about 14,900 new households will form in Central Arkansas between 2025 and 2030.
While the bulk of household growth will probably occur in the region’s outlying counties, an emerging infill trend suggests more people may choose to live in selected inner-city areas of Little Rock, North Little Rock, Conway, and possibly other cities. Improving pedestrian infrastructure has the potential to enhance lifestyles and accelerate business and housing growth in denser, more walkable nodes. Such trends favor older neighborhoods with more permeable traditional street grids, as opposed to the serpentine, low-density and congestionfeeding street forms found in many suburban areas.2
Like most forecasts, this one assumes trends will continue shifting along known lines. Such a forecast provides insight, but not certainty. It cannot predict the actual choices and actions people make, so you can be certain there will be surprises along the way.
Source: Source:
1. Base forecast from Metroplan's official 2018 forecast for long-range transporation plan, with adjustment for population trend 2015-2025.
1. Base forecast from Metroplan’s official 2018 forecast for long-range transporation plan, with adjustment for population trend 2015–2025.
2. Revised forecast is linear trend 2010-2025.
2. Revised forecast is linear trend 2010–2025. Central Arkansas (4-County) Trend 2000–2025 with Forecast Alernatives to
and Perry Counties.
2 For further insights we recommend Walkable City and Walkable City Rules, by Jeff Speck. Also review the June, 2024 version of this newsletter, focusing on infill development, at http://www.metroplan.org
1 Faulkner, Lonoke, Pulaski and Saline Counties. The official MSA also includes Grant
Statistical Supplement 2025
The chart at right shows mortality and fertility trends in the state of Arkansas from 2010 through 2024. The COVID-19 pandemic caused a flip for the state in 2020, when total deaths climbed above total births for the first time in modern recordkeeping. Given the pandemic’s impact, it was not surprising when total deaths climbed even higher in 2021 and remained relatively high the next year, too. As the chart on COVID deaths shows, however, by 2023 (the latest years for which we have statistics) COVID-19 deaths had gone way down. Yet the state still showed slightly more total deaths than births in 2023 and 2024.
The chart below gives additional insight into changing ped/bike commuting behavior described on p. 5. It uses the five-year ACS data to compare work commutes by foot and bike from 2013 through 2023 for several of the larger cities in Arkansas. Most cities saw some increase in the years 2013 to 2018 but declined by 2023. The COVID-19 pandemic seems to have altered behavior patterns. Among Arkansas cities, Fayetteville retains the highest share of walk and bike commutes, benefitting not only from an outstanding trail system, but also from its college-town demographics. Jonesboro and Conway have similar advantages.
Source: ACS 5-year.
Births and Deaths 2010-2024
Births and Deaths 2010–2024
Sources: U.S. Centers for Disease Control and Arkansas department of Health. Figures 2012 and 2017-2024 are provisional.
Mortality_Covid-19_AR_2019-2023.xlsx
Sources: U.S. Centers for Disease Control and Arkansas department of Health. Figures 2012 and 2017-2024 are provisional.
Source: U.S. Centers for Disease Control.
Arkansas Covid-19 Deaths
Source: U.S. Centers for Disease Control Arkansas Covid-19 Deaths City_Comp_Bike+Walk_2013(5)-2018(5)-2023(5).xlsx
+ Bike as Share of Total Work Commuting 20132023
Walk + Bike as Share of Total Work Commuting 2013–2023
However, only three of the cities shown here saw ped/bike commuting activity increase from 2018 to 2023: Bentonville, Springdale and Little Rock. Trail and bike lane improvements are likely contributing factors. The chart and data involved here should be used with caution, due to the limitations of sample data and the comparatively small share of workers who use pedestrian modes in any city. The figures are the best census data we have but are not a definitive measure of biking and walking trends.
PRESIDENT
Judge Allen Dodson Faulkner County
2025 Metroplan Board of Directors
VICE PRESIDENT
Mayor Ken Kincade City of Cabot
Mayor Crystal Herrmann City of Alexander
Mayor Bernadette Chamberlain City of Austin
Mayor Eddie Jones City of Bauxite
Mayor Tom Farmer City of Benton
Mayor Chris Treat City of Bryant
Mayor Cody Kees City of Cammack Village
Mayor Bart Castleberry City of Conway
Mayor David “Butch” House City of England
Mayor Sammy Hartwick City of Greenbrier
Mayor Terry Williams City of Guy
Mayor Clyde Crookham City of Haskell
Mr. Keith Keck Hot Springs Village
SECRETARY/TREASURER
Judge Matt Brumley Saline County
Mayor Jeff Elmore City of Jacksonville
Mayor Stephanie White City of Keo
Mayor Frank Scott, Jr. City of Little Rock
Mayor Wayne McGee City of Lonoke
Mayor Caleb Norris City of Maumelle
Mayor Danny Hester City of Mayflower
Mayor Jonathon Hawkins City of Mount Vernon
Mayor Terry Hartwick
City of North Little Rock
Mayor Mike Kemp City of Shannon Hills
Mayor Cain Nattin City of Sheridan
Mayor Mary Jo Heye-Townsell City of Sherwood
Mayor Kimberly Schane City of Traskwood
IMMEDIATE PAST PRESIDENT
Judge Barry Hyde Pulaski County
Mayor Preston Scroggin City of Vilonia
Mayor Charles Gastineau City of Ward
Mayor Terry Don Robinson City of Wooster
Mayor Derrick Rainey City of Wrightsville
Judge Randy Pruitt Grant County
Judge Doug Erwin Lonoke County
Mr. David Siskowski Arkansas Department of Transportation