GOAL 6: FINANCIAL STEWARDSHIP
4) Farebox recovery
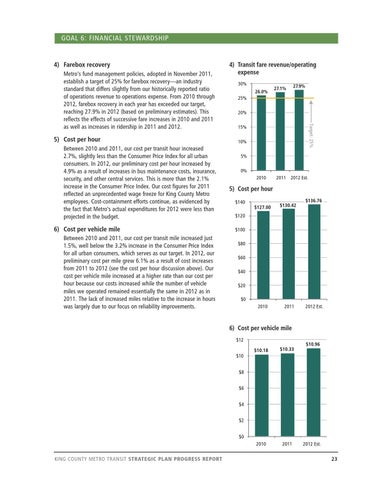
5) Cost per hour Between 2010 and 2011, our cost per transit hour increased 2.7%, slightly less than the Consumer Price Index for all urban consumers. In 2012, our preliminary cost per hour increased by 4.9% as a result of increases in bus maintenance costs, insurance, security, and other central services. This is more than the 2.1% increase in the Consumer Price Index. Our cost figures for 2011 reflected an unprecedented wage freeze for King County Metro employees. Cost-containment efforts continue, as evidenced by the fact that Metro’s actual expenditures for 2012 were less than projected in the budget.
6) Cost per vehicle mile Between 2010 and 2011, our cost per transit mile increased just 1.5%, well below the 3.2% increase in the Consumer Price Index for all urban consumers, which serves as our target. In 2012, our preliminary cost per mile grew 6.1% as a result of cost increases from 2011 to 2012 (see the cost per hour discussion above). Our cost per vehicle mile increased at a higher rate than our cost per hour because our costs increased while the number of vehicle miles we operated remained essentially the same in 2012 as in 2011. The lack of increased miles relative to the increase in hours was largely due to our focus on reliability improvements.
30% 26.0%
27.1%
27.9%
2011
2012 Est.
25% 20% Target: 25%
Metro’s fund management policies, adopted in November 2011, establish a target of 25% for farebox recovery—an industry standard that differs slightly from our historically reported ratio of operations revenue to operations expense. From 2010 through 2012, farebox recovery in each year has exceeded our target, reaching 27.9% in 2012 (based on preliminary estimates). This reflects the effects of successive fare increases in 2010 and 2011 as well as increases in ridership in 2011 and 2012.
4) Transit fare revenue/operating expense
15% 10% 5% 0% 2010
5) Cost per hour $140 $127.00
$130.42
2010
2011
$136.76
$120 $100 $80 $60 $40 $20 $0 2012 Est.
6) Cost per vehicle mile $12
$10.96 $10.18
$10.33
2010
2011
$10 $8 $6 $4 $2 $0
KING COUNTY METRO TRANSIT STRATEGIC PLAN PROGRESS REPORT
2012 Est.
23