Brought to you by
The Manufacturing & Business Podcast Network
O U R
P O D C A S T S :
MFGTALKRADIO.COM
L I S T E N TO O U R P O D C A S T S AT:
www.jacketmediaco.com
PAGE 20 © 2021 LAWeiss
PLUS PAGE 18
THE CASS TRANSPORTATION INDEX PAGE 24
CYBER SECURITY INDEX PAGE 52
[
FEATURE STORY: WHERE HAS ALL THE LABOR GONE?
OCTOBER ISM PMI:
60.8%
Released November 1st -The Full Executive Summary Report On Business - Page 28
ISO9001:2015 SINCE 1994 AND AS9100D SINCE 1998 NIST SP 800-171
(COMPLIANCE UNDER DEVELOPMENT)
*
2
Manufacturing Outlook / November 2021
*Toll free within the U.S.
TABLE OF CONTENTS Publisher LEWIS A WEISS Editor in Chief TIM GRADY Creative Director CRAIG ROVERE Contributing Writers ROYCE LOWE NORBERT ORE CHRIS KUEHL THOMAS R. CUTLER AMELIA ROY JEANNE-MARIE LOWRIE JOCELYN BRIGHT CHRIS ANDERSON LAWRENCE MAKAGON CHRISTINE CASATI KEN FANGER SCOTT STACHIW
Production Manager LINDA HOPLER Advertising ADVERTISE@MFGTALKRADIO.COM Editorial Office JACKET MEDIA CO. 75 LANE ROAD FAIRFIELD, NJ 07004 (973) 808-8300
5 PUBLISHER’S STATEMENT
So Many Things Happening and/or In Flux
6 MANUFACTURING OUTLOOK Global PMI stays put
MANUFACTURING TIDBITS
Insights from inside manufacturing in action
10 2022 PREDICTIONS THAT MOST IMPACT THE INDUSTRIAL by TR Cutler
12 B2B EMAIL MARKETING AND THE MANUFACTURING SECTOR ISN’T WORKING. TEXTING PROVES VASTLY MORE EFFECTIVE by TR Cutler
14 THE OUTLOOK FOR VIRTUAL REALITY TRAINING IN MANUFACTURING by Scott Stachiw
17 SPECIALTY FOOD MANUFACTURERS LEARN TO SURVIVE SUPPLY CHAIN DISRUPTIONS by TR Cutler
18 FEATURE STORY WHERE HAS ALL THE LABOR GONE? by Tim Grady
ISM MANUFACTURING REPORT ON BUSINESS PMI at 60.8%
30 NORTH AMERICA OUTLOOK by Amelia Roy
32 ASIA OUTLOOK by Christine Casati
34 EUROZONE OUTLOOK by Chris Anderson
35 GLOBAL PMI OUTLOOK by Norbert Ore
38 THE CREDIT MANAGER’S OUTLOOK by Dr. Chris Kuehl
42 METALS OUTLOOK
Steel’s Upcoming Demand
44 INNOVATION OUTLOOK Powering the 21st century with Integrated Photonics
46 AEROSPACE OUTLOOK Now it’s the Dreamliner
20
48
COVER STORY: CIRCLE OF UNCERTAINTY AND CONFUSION
China’s Promises On Coal
by Lew Weiss & Tim Grady
© 2021 Jacket Media Co. No part of this publication may be reproduced or used in any form without the prior written permission of the publisher. Manufacturing Outlook is a registered trademark of Jacket Media Co.
26
24 CASS INDEX
Cass Transportation Systems
Open call for...
Contributing Writers for new and existing content. Let’s start a conversation – Contact us at info@jacketmediaco.com or visit mfgtalkradio.com/writer for more information.
ENERGY OUTLOOK
50 AUTOMOTIVE OUTLOOK Let Hertz Put You In An EV
52 CYBER SECURITY OUTLOOK If It Ain’t Broke, Better Fix It! – Part 2: What to Do?
54 ISSUES OUTLOOK The Apprentice, Again…
PUBLISHERS STATEMENT Publisher’s Statement
So Many Things Happening and/or In Flux This month, Manufacturing Outlook is filled with so much content that could help businesses of all kinds across industry segments that I feel it needs to be summarized here. First, Tim Grady and I got together on the Circle of Uncertainty and Insecurity which is a collection of issues that require the next business decision, the next strategic move, to be looked at in view of all the issues facing us today. It seems that either way you shift or turn, something unexpected happens. That isn’t unusual in business, but it is certainly amplified now. Internally, Virtual Reality, or VR, is making things more efficient and training or knowledge transfer more effective. Scott Stachiw, Vice President of Client Solutions at Roundtable Learning presents the great advances in VR ready to be used in manufacturing today. And with technology changes and updates coming fast and furious, don’t miss Ken Fanger’s Cyber Security Outlook where he presents real world solutions so you can move your company forward step-by-step, even when there is a misstep. In our Innovation Outlook, we look at AIM Photonics (American Institute for Manufacturing Integrated Photonics), a ManufacturingUSA Innovation Institute, so you can see what is happening with integrated circuit light-based technology for semi-conductor chip reliability and performance. We find it fascinating how a new or different approach makes such a powerful impact which enhances what can be done with processing power. Then, TR Cutler touches on the future of email marketing, something manufacturers mostly did not consider part of their marketing mix just a few years ago, and the new twist of texting to touch prospective customers more instantaneously and even more effectively than email. And don’t miss his predictions for 2022 – you’ll start hearing more of those from media outlets in the next few weeks, but TR gets a step ahead of the coming chatter. Norbert Ore, our senior correspondent with Manufacturing Talk Radio also presents his Global Survey Insights report that looks at the Purchasing Manager’s Indexes in major countries, and some key regional PMI’s in the U.S., that paints a picture of where manufacturing is going as of October 2021. Each month, he presents an update of his report to give readers a sense of the bigger picture in manufacturing. After the sale, Dr. Chris Kuehl shares the National Association of Credit Manager’s Credit Manager’s Index report, where the rubber meets the road after the goods are delivered and payment is due. When the economy is good, invoices are mostly paid within terms, and for now, as has been the case for several months, invoice payments are pretty reliable. The ISM presents similar data, and Tim Fiore, Committee Chair of the ISM’s Manufacturing Report on Business® shares that economic upturns last about 35-36 months, and we are at Month 17. It could be a great ride if Washington D.C. doesn’t muck it up. Don’t miss the valuable, insightful content this month, and hear more as it happens on Manufacturing Talk Radio. We’re here to help manufacturing. n Have a Special Day
FOLLOW US:
Lewis A. Weiss, Publisher Contact laweiss@mfgtalkradio.com for comments, suggestions and ideas and guest requests for MFGTALKRADIO.COM podcast. Manufacturing Outlook / November 2021
5
MANUFACTURING OUTLOOK
NOVEMBER 2021
MANUFACTURING OUTLOOK
6
Manufacturing Outlook / November 2021
MANUFACTURING OUTLOOK
GLOBAL MANUFACTURING PMI STAYS PUT. SUPPLY CHAIN DISRUPTION, RAW MATERIALS SCARCITY, AND SKILLED LABOR SHORTAGES ARE STILL MAJOR ISSUES. CHIP SHORTAGE HURTING AUTO SALES WORLDWIDE, BUT MAY BE EASING. STEEL PRICES SOFTENING SOMEWHAT - FOR THE MOMENT? by ROYCE LOWE When all is put into perspective these days, there isn’t really too much good news on the manufacturing front. There are lots of orders, if you can find the personnel to fill them. Microchips are still hard to find, regardless of the business you’re in. Steel and aluminum and other metals shot up in price, but look to be declining. The reduced availability of chips means fewer new cars are being manufactured, hence a reduced demand for steel. The scene is confusing, the outlook uncertain. There will be a correction at some point in the not-too-distant future, but nobody, of course, knows when. A Biden administration official announced on October 30 that the U.S. had reached a deal with the European Union (EU) regarding the United States’ Section 232 tariffs on steel and aluminum, but few details were given at the time. National Public Radio (NPR) offered a broad explanation. It said, “The United States will keep steel and aluminum tariffs on European nations, but will allow a certain amount of steel and aluminum produced in the EU to enter U.S. markets tariff-free.” In return, NPR said, the EU will end retail tariffs it had put in place against U.S. consumer products. Under the agreement, the EU and the United States also agreed to negotiate the world’s first carbonbased sectoral arrangement on steel and aluminum trade by 2024. The
arrangement will be focused on addressing carbon intensity and global overcapacity. The cost of shipping goods across oceans in containers, for example from China, soared to unimaginable highs, but they came down just as dramatically between August and October. An executive with a Shanghai freight company said in early October that the cost of shipping a 40-foot container from China to the U.S. West Coast dropped by nearly half in the previous four days, going from about $15,000 to just over $8,000. The spot rate for shipping to the East Coast had fallen by more than one-quarter from over $20,000 to less than $15,000. Port congestion and freight rates are all adding to what is a chaotic situation. The ISM PMI figure for U.S. manufacturing moved from 61.1 in September to 60.8 in October, still in high demand territory. The overall economy continued with the seventeenth month of expansion.
Expansions average 35-36 months, so the U.S. is at the half-way point for the current growth cycle. The Bureau of Economic Analysis says the Real Gross Domestic Product increased at an annual rate of 2.0 percent in the third quarter of 2021, according to the Bureau’s “advance” estimate. The real GDP increase in the second quarter of 2021 was 6.7 percent. IHS Markit’s remarks on U.S. manufacturing for October show their PMI figure moved from September’s 60.7 to October’s 58.4.
There was a strong expansion in new orders in October, but the upturn in production was at the slowest rate for 15 months. There were material shortages, and severe supplier delays, leading to a marked increase in input costs. Selling prices increased accordingly. Supply chain problems and inflation pulled business confidence to the lowest for a year.
continued Manufacturing Outlook / November 2021
7
MANUFACTURING OUTLOOK Vendor prices and transportation surcharges put costs up; backlogs were up and employment with them. GLOBAL CRUDE STEEL PRODUCTION WAS DOWN BY 8.9 PERCENT YEAR-OVERYEAR IN THE MONTH OF SEPTEMBER for the 64 reporting countries – which represent 99 percent of world crude steel production – to 144.4 million tons (MT.) U.S. crude steel production for September was 7.3 MT, up 22.0 percent year-over-year. In September, China produced 73.8 MT, down 21.2 percent year-overyear; India 9.5 MT, up 7.2 percent; Japan 8.1 MT, up 25.6 percent; Russia (estimated) 5.9 MT, down 2.2 percent; South Korea 5.5MT, down 5.0 percent; Germany 3.3 MT, up 10.7 percent, and Brazil 3.1 MT, up 15.3 percent. The EU (27) produced 12.1MT, up 15.6 percent. Primary Global Aluminum Production in September was reported at 5.508 million tons, with production in China, at 3.183 million tons, representing 58 percent of the world total.
Production was 487,000 tons in GCC; 372,000 tons in the rest of Asia; 271,000 tons in Western and Central Europe; 304,000 tons in North America and 340,000 tons in Russia and Eastern Europe. J D Power and LMC Automotive forecast total U.S. light vehicle sales for October of 1,085,500 units, down 17.2 percent from
October 2020, and down 18.8 percent from October 2019. The seasonally adjusted annualized rate (SAAR) for new vehicles is forecast at 13.5 million units, down 2.9 million units from 2020 and down 3.3 million units from 2019. U.S. plug-in sales for the year-to-date are at 424,483 units: for the period since 2010, plug-in sales in the U.S. amount to 2,137,480 units, or about the number China sells in a year. The JP MORGAN GLOBAL MANUFACTURING PMI – a composite index produced by JPMorgan and IHS Markit in association with ISM and IFPSM (International Federation of Purchasing and Supply Management) – rose very slightly to 54.3 in October. Growth of manufacturing output slowed in October under record supplier delays, rising costs, and a stalling export trade. There was a record lengthening in supplier lead times and a steeper increase in input and selling prices. The rate of expansion in October was the weakest during the current upturn. continued
8
Manufacturing Outlook / November 2021
MANUFACTURING OUTLOOK Of the 31 nations for which October data were available, all but two (Mexico and Myanmar) registered over the 50.0 midpoint (the delineator between expansion and contraction). There were expansions across the consumer, intermediate, and investment sectors, with production rising slightly quicker in the consumer goods sector, decelerating slightly in the intermediate sector, but decreasing in the investment goods sector - for the first time in 16 months. Global supply chains remained under severe pressure during October, with average vendor lead times increasing to the greatest extent in the survey history. This is a direct result of labor shortages at every step of the supply chain, from raw materials through
production to final arrival of goods due to the pandemic and seismic shifts in worker mindsets. THE ECONOMIST magazine, in its latest weekly report on world economies, highlights changes in Gross Domestic Product (GDP), Consumer Prices, and Unemployment Rates for what it considers the world’s major economies. These data are not necessarily good to the present day, but are mostly applicable to at latest the past two months, and show definite trends in the world economy. The figures are qualified as being the latest available, and with reference to a given quarter or month. The figures for GDP represent the % change on the previous quarter, or annual rate. The consumer price increases represent year-over-year changes. The unemployment figures, %, are for the month as noted. n
The Manufacturing & Business Podcast Network
O U R
P O D C A S T S :
MFGTALKRADIO.COM
L I S T E N TO O U R P O D C A S T S AT:
www.jacketmediaco.com
Author profile: Royce Lowe, Manufacturing Talk Radio, UK and EU International Correspondent, Contributing Writer, Manufacturing Outlook. Manufacturing Outlook / November 2021
9
MANUFACTURING TIDBITS
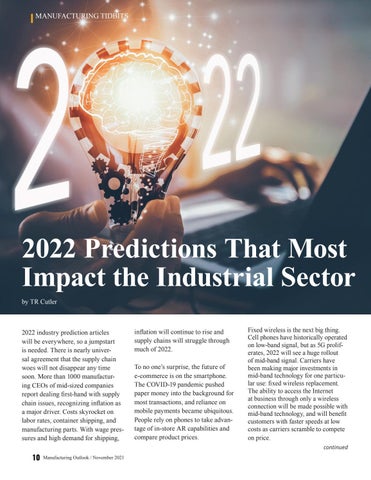
2022 Predictions That Most Impact the Industrial Sector by TR Cutler
2022 industry prediction articles will be everywhere, so a jumpstart is needed. There is nearly universal agreement that the supply chain woes will not disappear any time soon. More than 1000 manufacturing CEOs of mid-sized companies report dealing first-hand with supply chain issues, recognizing inflation as a major driver. Costs skyrocket on labor rates, container shipping, and manufacturing parts. With wage pressures and high demand for shipping,
inflation will continue to rise and supply chains will struggle through much of 2022. To no one’s surprise, the future of e-commerce is on the smartphone. The COVID-19 pandemic pushed paper money into the background for most transactions, and reliance on mobile payments became ubiquitous. People rely on phones to take advantage of in-store AR capabilities and compare product prices.
Fixed wireless is the next big thing. Cell phones have historically operated on low-band signal, but as 5G proliferates, 2022 will see a huge rollout of mid-band signal. Carriers have been making major investments in mid-band technology for one particular use: fixed wireless replacement. The ability to access the Internet at business through only a wireless connection will be made possible with mid-band technology, and will benefit customers with faster speeds at low costs as carriers scramble to compete on price. continued
10
Manufacturing Outlook / November 2021
MANUFACTURING TIDBITS Currently, the U.S. has deployed 387,000 towers. In order to be able to take on mid- and high-band technology while still covering all the same footprint, as many as 6x “nodes” will be needed on the network. Additional cell towers will be built as a result, but many of those nodes will come in the form of signal repeaters. Manufacturers should be embedding artificial intelligence, blockchain, and robotics in their operations today. The convergence of these new technologies will fundamentally shift the manufacturing enterprise. A new workforce with the ability to augment these technologies is beginning to emerge. In the industry of the future, all industrial assets will be connected within the same factory, as well as
between factories. By the end of 2022, factories will be reorganized on a network model and become a real connected digital platform. Predictive Maintenance Predicting failures and avoiding downtime is dominating the field of industry right now. “Downtime in your production line costs big money,” explained Angela Clement, a writer at Origin Writings. Ninety-eight percent of businesses report that a single hour of downtime costs them over $100,000. That is a lot of money to be wasting, which is why adopting preventative maintenance strategies is essential to keep costs down. Minimizing unplanned downtime and extending the life of factory machinery will always be trendy in up-and-coming years.
Author Profile:
Thomas R. Cutler is the President and CEO of Fort Lauderdale, Florida-based, TR Cutler, Inc., celebrating its 23rd year. Cutler is the founder of the Manufacturing Media Consortium including more than 9000 journalists, editors, and economists writing about trends in manufacturing, industry, material handling, and process improvement. TR Cutler, Inc. recently launched three new divisions focusing on Gen Z, the African manufacturing sector, and manufacturing in the entertainment sector. Cutler authors more than 1000 feature articles annually regarding the manufacturing sector. Over 5000 industry leaders follow Cutler on Twitter daily at @ThomasRCutler. Contact Cutler at trcutler@trcutlerinc.com n
Manufacturing Outlook / November 2021
11
MANUFACTURING TIDBITS
B2B Email Marketing and the Manufacturing Sector Isn’t Working.
Texting Proves Vastly More Effective
by TR Cutler According to McKinsey, email is 40 times more effective at acquiring customers than Facebook or Twitter. According to VentureBeat, every $1 invested in email marketing yields $38 in ROI. TR Cutler has a highly-curated email list of over 22 million US business decision makers nationwide; those data were collected before COVID and with so many manufacturing executives now working from home remotely or resigning suddenly, keeping an accurate email database is
almost impossible. Remote work introduces new and destructive viruses, bounced emails or those that end up in a spam folder which are up 40% in the past six months.
completed a global survey of 1200 manufacturing executives who reported deleting more than 75% of all incoming emails, with 90% aggressively unsubscribing due to the sheer velocity of messaging.
Buying lists, no matter how diligently they are validated, are junk within 90 days. Younger recipients of emails are accustomed to ghosting and deleting folks with whom a great initial sales call may have occurred. The Manufacturing Media Consortium just
The answers to a failing CRM email database for the industrial sector Start by sending an email asking if they wish to continue receiving information. That is just a great way to scrub those who will request removal. continued
12
Manufacturing Outlook / November 2021
MANUFACTURING TIDBITS If no responses occur within 30 days -- delete the email (not the contact) from the database. Pay someone to spend one week calling through the database to see if the contact is still with the organization. With so many mergers & acquisitions, resignations, promotions, and new hires, research indicates the any CRM database is at least 50% full of contacts no longer with the organization. The best solution is to capture cell phone numbers, whether at a webinar, tradeshow, conference, event, or meeting. The response rate to a text is running 600% higher than voicemails or emails. Everyone carries a phone on their person and responds
to incoming texts with alacrity. As long as there is no spam filter on the incoming texts, the response rate will justify the effort. There are other alternatives Posting fun TikTok videos will garner attention. Sending DMs (direct messages) to followers on Twitter will get attention. Consistent posting of short, but interesting YouTubes will capture views. Finally, the use of daily PR is transformative. A once a month press release is useless in the Google search world. If an ERP vendor only promotes attendance at events or a new product release, the sizzle will not be sustainable. If open for business, there is something to say.
Author Profile:
Thomas R. Cutler is the President and CEO of Fort Lauderdale, Florida-based, TR Cutler, Inc., celebrating its 23rd year. Cutler is the founder of the Manufacturing Media Consortium including more than 9000 journalists, editors, and economists writing about trends in manufacturing, industry, material handling, and process improvement. TR Cutler, Inc. recently launched three new divisions focusing on Gen Z, the African manufacturing sector, and manufacturing in the entertainment sector. Cutler authors more than 1000 feature articles annually regarding the manufacturing sector. Over 5000 industry leaders follow Cutler on Twitter daily at @ ThomasRCutler. Contact Cutler at trcutler@trcutlerinc.com n
Manufacturing Outlook / November 2021
13
MANUFACTURING TIDBITS
The Outlook for Virtual Reality Training in Manufacturing by Scott Stachiw, Roundtable Learning VP of Client Solutions Do you remember the View-Master™? It was an iconic red device you looked through like a pair of binoculars. A special disc with pictures was inserted, and the stereoscopic view gave the illusion of depth. It felt like you were looking into a scene of Batman fighting the Joker or at a lion that was about to walk right up to you.
and rotation. This allows you to “look around” the virtual scene and, with the right headset, even walk around. Not only can you see the lion, but you can also walk up to it!
a new workforce and adapt to new technologies within their processes.
In essence, this is exactly what virtual reality (VR) does.
So, how exactly do we use VR to elevate traditional learning, and how can it be applied to the future of manufacturing training? Let’s find out by breaking down VR’s benefits and exploring what lies ahead.
Creates a Safe Learning Environment A major benefit of VR training is that it allows learners to interact with virtual scenes and hazards all in a safe space. VR is an excellent tool for experiential learning of complex topics that are otherwise too risky, expensive or dangerous for hands-on training.
With VR, a special headset with stereoscopic lenses inside is worn. The difference from the View-Master is that the images you see are not pictures on a disc; rather they are displayed on a small video screen inside the headset. In addition, there are sensors on the headset that track your head position
Benefits of VR Training for Manufacturing The advent of VR has ushered in a new way of providing hands-on training and shared knowledge that is repeatable, accessible and measurable. This hands-on training can be valuable to manufacturers as they look to train
VR training places manufacturing employees in a learning environment where they practice operating and repairing equipment without risking their safety. This ensures they’re prepared for the job in real life and can confidently carry out processes on the manufacturing floor. continued
14
Manufacturing Outlook / November 2021
MANUFACTURING TIDBITS Provides Realistic Technical Skills Practice Learners can perform technical tasks firsthand, including product assembly and operating complicated machinery.
used to help guide management on the best positions for an employee based on their skill level and even provide areas of concern from a standpoint of productivity or safety.
By using 3D modeling and computer-generated graphics, a realistic model of a tool or manufacturing process can be recreated and made available to a learner in VR. This allows an organization to program learning scenarios with digital indicators and highlights, voice-overs and even animated characters that teach everything from fundamental knowledge to advanced critical thinking.
Future of VR for Manufacturing Everything I’ve mentioned up to this point focuses on the current state of VR for manufacturing, and as great as that is, there’s an even brighter future. Here are a few things to which we can look forward.
For example, a learner can be placed in a full VR warehouse environment where they experience all the real-life sights and sounds of their workplace. Throughout their VR activity, the learner is tasked with properly stacking boxes of product. If done incorrectly, the learner is given tips for how to improve their actions and can repeat the activity as much as they need. Collects Key Training Metrics One of the ways VR enhances the training experience is by capturing key training metrics and providing feedback to learners and training managers. VR training metrics include: • Usage Data — Fundamental technical information, such as who is using the training, how often they’re using it and how long they take to complete a task. • Progress, Completions and Replays — Quantitative measures that ensure learners are on the right track. •P erformance Indicators — Numerical indicators of productivity and engagement, such as decisions, timing, body movements and retinal eye tracking. This insight into a VR training activity is also effective for compliance and proficiency purposes. The scores and data from a VR experience can be
Haptic Gloves For starters, the advancements in wearable technology and haptic devices will soon make the environment inside the virtual experience more natural and realistic. Haptic gloves have special motors, sensors and vibration devices that allow a learner to feel like they are actually touching and/or grabbing virtual objects. For example, when a learner picks up a torque wrench, tiny wires that run from their fingers to magnetic brake motors in the glove will stop their fingers from moving as they wrap around the handle. Additionally, tiny vibrations will be felt in the learner’s fingertips and palm where the handle touches their hand. This also works when pushing buttons or flipping switches. Depending on the manufacturer of the haptic device, some can be used to pick up virtual objects as small as a #10 screw. Artificial Intelligence (AI) There will also be new uses for AI combined with VR training to give more realistic training experiences. AI involves using computers to do complete tasks that traditionally require human intelligence. This means creating algorithms to classify, analyze and draw predictions from data. Right now, VR training modules need to know all the possible scenarios and outcomes to provide training guidance. If a learner deviates from the training scenario, they are redirected and kept
on track. With AI, the program will adapt to each learner. The learning objective will remain the same, but the way in which feedback is provided may change — you can track where the learner is looking, if they have hesitation, the tone of their voice and more. Combine AI with things like body sensors and eye tracking, and now you can look at more than just the angle at which the learner is holding the chisel. With AI and VR, you can gain insight into your learner’s performance, from how they stand to where they look and how they hold their tools. There are nuances to everything we do, and AI is the answer to providing feedback based on those nuances because of its adaptability to an individual learner, which will ensure long-term knowledge retention from their immersive experience. Take Your Manufacturing Training to the Next Level With VR Ultimately, nothing will ever fully replace the knowledge gained from hands-on experience. New employees will undoubtedly learn more about a skill or trade in their first six months on the job than they could in two weeks of onboarding. But VR bridges the gap between fundamental classroom training and those critical onthe-job training experiences, making the onboarding process shorter and more effective. VR allows us to share years of experience from those who know the processes best and provides repeatable simulations and better metrics for tailored training solutions. Author Profile: Scott Stachiw is the Director of Immersive Learning at Roundtable, and leads the immersive learning team to leverage VR technology for its clients. He can be reached at sstachiw@roundtablelearning.com n
Manufacturing Outlook / November 2021
15
MANUFACTURING TIDBITS
Specialty Food Manufacturers Learn to Survive Supply Chain Disruptions by TR Cutler
continued
16
Manufacturing Outlook / November 2021
MANUFACTURING TIDBITS Nikki Lamb is the Founder and President of Harvest Specialty Foods, LLC. Lamb has won various supply chain and innovation awards including Gold in the Thomas Edison Awards, Wall Street Journal Award for Innovation and Supply Chain Distinction Award. Harvest Specialty helps clients bring new and existing products to consumers nationally and globally through product development, commercialization, and retail partnerships. Lamb was recently a guest on the Women and Manufacturing (WAM) Podcast. Listen here. Q: How do small specialty food manufacturers manage when receiving an order from their largest customer they cannot deliver on time? With so many supply chain disruptions, how can a promised delivery date happen with freight floating on ships in the Pacific? Nikki Lamb: There is no easy solution. While bosses and clients are asking for updates every 2 hours, answers are not available as to when deliveries can be expected. There are responsive strategies to manage these horrible supply chain disruptions. Many of the specialty food manufacturers are turning to partners or competitors who provide a similar product. Tapping into their vendor database or co-packers is a good place to start. Finding out which domestic vendors are used is a valuable and vital resource. Q: How should specialty food manufacturers utilize suppliers as potential partners? Nikki Lamb: Suppliers are always potential partners. Many suppliers
an account manager or broker/liaison who works for the co-manufacturer, ask them to reach out to the plant manager and their sourcing manager. The plant manager knows exactly what extras they have. They may even have ideas no one has considered.
are delivering volumes for competitors and have capacity to do more for specialty food manufacturers. Q: How should specialty food manufacturers manage the number of SKUs to avoid supply chain disruption? Nikki Lamb: Consider reducing the number of SKUs. Carrying twenty different vanilla SKUs in inventory makes no sense. It is the perfect time to reformulate using ingredients that are readily available and can be sourced from multiple suppliers. While time consuming, this product development project produces both short and long-term benefits. Using fewer suppliers increases volume which will likely reduce cost per unit. Specialty food manufacturers must consider replacing one ingredient with another (such as vanilla extract versus imitation vanilla).
Q: How important is communication for specialty food manufacturers during this supply chain crisis?
Q: Will this ingredient swapping compromise the product?
Author Profile:
Nikki Lamb: NEVER COMPROMISE THE PRODUCT. Be smart. Where consolidations and improvements can happen without compromising product integrity is essential during the supply chain challenges. It becomes a matter of continuous process improvement and lean manufacturing. The result will be improvements and innovations which give customers best in class products and services. Q: What if a specialty food manufacturer is using a third-party manufacturer making the same thing or their version? Nikki Lamb: The question should really be whether they have ingredients or parts to spare to help navigate the supply chain disruption. If there is
Nikki Lamb: Nothing is more important. Perhaps there is an option to prioritize who gets the product on hand. Alternatively, with supply constraints manufacturers must consider whether delivering to the best customers is most beneficial. Communication with all partners on a daily basis at this critical time is essential. Whether delivery is possible or not, be open and honest. This will solidify trust and build rapport. Thomas R. Cutler is the President and CEO of Fort Lauderdale, Florida-based, TR Cutler, Inc., celebrating its 23rd year. Cutler is the founder of the Manufacturing Media Consortium including more than 9000 journalists, editors, and economists writing about trends in manufacturing, industry, material handling, and process improvement. TR Cutler, Inc. recently launched three new divisions focusing on Gen Z, the African manufacturing sector, and manufacturing in the entertainment sector. Cutler authors more than 1000 feature articles annually regarding the manufacturing sector. Over 5000 industry leaders follow Cutler on Twitter daily at @ThomasRCutler. Contact Cutler at trcutler@trcutlerinc.com n
Manufacturing Outlook / November 2021
17
FEATURE STORY: LABOR OUTLOOK
Where Has All The Labor Gone? by Tim Grady
Labor shortages exist in almost every industry across the U.S., from major corporations to the smallest mom-andpop shops. It is not unique to the U.S. as companies in most developed countries of the world have the same issue. Covid was not only a health pandemic, it was the catalyst that changed the way people looked at work. And when countries across the globe shut down businesses en masse, or restricted activities to working remotely, the psychological mindset of employees changed forever. It began with work-life balance, something found as far back as 3,000 years ago in Chinese Feng Shui. Full-time work, with commute time, consumed a minimum of 50 hours of the 268 hours in a 7-day week. Some careers consumed 1-1/2 to 2 times that number of
18
Manufacturing Outlook / November 2021
hours. Individuals longed for a career where they could work from home, but employers were largely resistant to off-site employees. Then Covid and government-mandated shutdowns forced the issue. Almost immediately, in order to survive, businesses had to provide a remote work solution, and all their arguments against it went out the window. Currently, more than 30% of employees have no interest in returning to their former commute-work-commute fly-a-desk grind. At least in the U.S., where the federal government supplied stimulus checks so employees would still have an income, something else arose from that compensation existence – the opportunity to ponder one’s future career. The
most recent result has been workers shopping for better paying jobs, workers quitting to jump to a better paying job (the Great Resignation), workers changing careers entirely, and workers shifting from a W-2 employee life to a 1099 self-employed effort by starting their own business. New business starts began picking up pace in 2020 and accelerated through 2021 marking the largest gain in new starts in more than 3 decades, that hasn’t tapered off yet. The perception of a better work-life balance either working from home, or owning your own business, or both, has a certain luster, even though the bloom may come off that rose as time marches on. Nonetheless, working 60 hours a week for yourself with the potential of creating recurring income
FEATURE STORY: LABOR OUTLOOK periencing negative population growth typically go into an extended period of economic decline because a disparity exists between the workers needed and the workforce available. If birth rates suddenly doubled in 2022, it would take 25 years before that population growth could supply even a neophyte workforce.
in some Internet digital business has a better feel to it than reporting to a boss in a job that may be no more secure than a business start-up. The self-employed mindset may not be so easily swayed in the near-term by employer promises or paychecks, especially with stories of former employees who bested their previous income in their first year. One quietly occurring tsunami moving through the U.S. workforce is retirement. Each day since 2011 when the first baby-boomers born in 1946 began to retire, 10,000 boomers have left the workforce – yes, every day. With them went 20, 30, even 40 years of knowledge. With them went their loyalty mindset, or a willingness to continue to work for the same employer for decades. This has been called the brain drain, and little has stemmed the tide of this sweeping exit of skilled workers. Predicted more than 25 years ago was the current birth dearth, or the situation where family size in the U.S. would shrink post-1964, resulting in insufficient population growth to offset the retirement of the baby-boomers. Just exactly that has happened and, for the first time in its history, the U.S. is experiencing near-zero population growth. And, as baby-boomers pass away, with follow-on generations having smaller families later in life, the U.S. will likely experience negative population growth. Countries ex-
Employers are raising wages, but a certain reality exists – companies have to make a profit to continue to stay in business. A “job” is created by a company to complete certain tasks with a return on that investment. The “job” belongs to the company, not the employee, and if the cost of that role rises past a certain point, the job may be redefined and crafted differently. So what’s coming? Technology – Machines Replacing Humans Is The Outlook The plethora of apps for smartphones has demonstrated that all kinds of things can be done with a bit of coding. The price of robots, like other electronics, continues to fall each year as more code is developed so that robots can perform more complex tasks, and do them safely in the presence of humans, or in place of humans. Robots are becoming more sophisticated and even life-like. Coupled with AI – Artificial Intelligence, and machine learning that provides feedback so code can be refined, robot skill sets are advancing faster than 4-year college grads. Nothing demonstrates this more than the dancing, jumping, running robots in videos coming out of Boston Dynamics; albeit, some very bright minds created those robots. If humans are unwilling to perform a job at a cost that justifies the existence of that job, then industry will solve that problem another way. Yes, we will need software engineers to write code, and manufacturing to make intricate parts, but those skill sets require post-secondary education for most people. But, we won’t need as many software engineers as the people being replaced by machines that can work
24-7 with planned maintenance time and upgrades. And in many cases, those engineers may be freelancers. While some might point to other sources of labor, like immigration, the people flooding the southern U.S. border do not have the advanced skill set needed by industry, and won’t have for more than a decade. With the U.S. labor participation rate (all people over the age of 16 able to work) hovering around 60%, adding more unskilled labor to the workforce will not slow the pace of human replacement. In addition, there are few effective training programs to up-skill the U.S. workforce fast enough to generate skilled labor sooner than robots can be built and advanced to take over more and more jobs. Even skilled labor brought in from overseas will end up in many of the jobs Americans could have had if the apprenticeship programs had been widely created two decades ago in the U.S., instead of universities churning out individuals with degrees that have little use in modern manufacturing or business. So, the outlook that the U.S. will have several million unfilled jobs by 2025, exacerbated by reshoring, may not materialize as technological advancements in robotics, automation, A.I., miniaturization, and other unseen developments change the vacancy equation. Perhaps it is good that the U.S. population isn’t growing, and the work-life balance is shifting some of the population to self-employment and gig work. We are reliving history. About the Author: Tim Grady is a host of Manufacturing Talk Radio, as well as a consultant to business and industry. He can be reached at timgrady@mfgtalkradio.com n
Manufacturing Outlook / November 2021
19
COVER STORY
Circle Of Uncertainty And Insecurity By: Tim Grady and Lew Weiss
20
continued Manufacturing Outlook / November 2021
CONSUMER PRICE INDEX
3D PRINTING
COVID-19
RECESSION
RESHORING
CIRCLE OF UNCERTAINTYVACCINATIONS AND INSECURITY HEALTHCARE
DIVERSITY NO PLACE FOR CONTAINERS
IMMIGRATION POLITICS BLACK LIVES MATTER
TRUMP A.I.
CHINA THREAT
EXTINCTION OCEANS
U.S. GOVERNMENT
GREAT RESIGNATION
SUPPLY CHAIN
fects every country and every person on Earth. Most go through their daily lives able to compartmentalize, set aside, or ignore the negative around them. However, those negatives are now on news channels 24/7, splattered across the Internet on a million podcasts and websites, pushed to digital devices as news feeds, and spoiling normal conversations. People are no longer talking – they are screaming. Civility has evaporated. Tensions run high on almost any topic shown in the tag cloud image. And tolerance of an opposing point of view is non-existent. In fact, opposing points of view are flash points that evoke instant rebuke, where every opinion bellows belligerently to be heard, making understanding impossible. Cooler heads are not prevailing. Sadly, elected leaders are part of the problem. The media is part of the problem. The old adage, “If it bleeds, it leads” (popularized by William Randolph Hearst in the 1890’s) has become, “If it inflames, give it a name” and then shape a storyline to
LONG LEAD TIMES
AUTOCRACY FOOD SUPPLY
ENVIRONMENT
JOB TRAINING CONGRESS
CLIMATE CHANGE
DEMOCRATS & REPUBLICANS CRUMBLING INFRASTRUCTURE
GLOBAL WARMING
INFRASTRUCTURE BILL
COLLEGE DEBT
A NEW NORM
TARIFFS
MILLENIALS
RUSSIA
RETIREES
ANTI-SEMITISM
ECONOMIC STATS CONFLICT
ROBOTICS
WORKER SHORTAGES
POVERTY
CRIME
BIRTH RATE
SALES
DIVIDED CITIZENS
Some have been through wars; many have been through recessions, but few have been through turbulence that af-
INFLATION
SHORTAGE OF TRUCK DRIVERS
NO SHIPPING CONTAINERS
TAXES
Lots of these conditions existed before the pandemic, but the pandemic amplified and magnified them. It created an overwhelming uncertainty that touches the lives of every person on Earth, and every government, as well. Our coping mechanisms are being overwhelmed by fears and anxieties that are every bit as destructive as experiencing war at home, like the bombing of London or the decimation of cities in Europe or Japan. Many are wondering if they are next, others are trying to recreate what was – that ‘normal’ we knew before the current level of divisive politics or the pandemic.
LOSS OF LOGISTICS RACISM
GDP
Few of the words and terms in the Circle of Uncertainty and Insecurity tag cloud seen here operate independently of many of the others. Fixing one may fix multiple things, and/or make them worse, and no one will know until something is tried. Of course, that introduces risk and change, neither of which are comfortable in and of themselves. But it cannot stay the way it is – it is all too true that, “A house divided against itself cannot stand.” - Abraham Lincoln, June 16th, 1858
SKILLS GAP
NO TRUCK CHASSIS
NUCLEAR WAR GOV’T REGULATION CYBER SECURITY
HIGHER PRICES
MATERIAL SHORTAGES
It is, without a doubt, the strangest time in America, and in most countries of the world. The unknowns outweigh the knowns, uncertainty outweighs certainty, and insecurity outweighs security, unfortunately by a significant margin. Whether your point of view is that of the every day citizen, to a business owner, employee, professional, politician, corporate executive, or even a billionaire, most are wondering which way is up, while others are trying to find which way is out of this amalgamation of forces and situations that are all interlaced.
COVID PANDEMIC
COVER STORY
MIDEAST
© 2021 LAWeiss
feed those flames. Sensationalize everything negative; occasionally mention something positive. And get people whipped into a frenzy. It’s working, it’s selling advertising, but it’s not good. There is no shortage of subjects to inflame: health care, childcare, inflation, recession, supply chain, government overreach, student loan debt, terrorism at home, climate change, skills gap, food supply, immigration, worker shortage, autocracy, fascism, anti-Semitism, artificial intelligence, China, racism, and the usual four horses of the apocalypse: war, famine, pestilence and death. Oh, and let’s not forget taxes. And that’s just the short list. What is troubling is the level to which the negatives and hyperbole have ramped up. The difficulty isn’t finding negatives to talk about because things are going so good, it is finding positives to talk about when things are in a maelstrom. Focusing just on the economy, one could conclude that it is growing robustly and expanding vigorously, but labor is in continued
Manufacturing Outlook / November 2021
21
COVER STORY TIDBITS MANUFACTURING
short supply in nearly every business across the planet. Raw materials are stuck on ships at sea. In other words, find something positive to tout, and the talking heads will torpedo it with a whirlwind of negatives, most of which are real but some of which are overblown. That is feeding the Circle of Uncertainty and Insecurity. In the previous normal, it seemed that things were manageable. Post-pandemic, if the pandemic is actually on its way out, the human landscape looks like an EF-5 tornado coupled with a hurricane or cyclone tore apart the psyche of the survivors. Some took a direct hit, like losing a loved one. Some experienced serious damage, like a business being shut down that cannot be restarted. Many were unscathed in their person or possessions, but battered in their emotions.
22
Manufacturing Outlook / November 2021
The Way Out There is no doubt that the world needs a way out. Things need to be fixed. In the U.S., the current administration is trying to spend trillions to fix things, which seems insane, except the U.S. has spent trillions on war over the last 20 years that fixed nothing. Does the national debt of $28 trillion concern the average citizen in America? Today, the awareness is higher, the objections are louder, but the solutions are not obvious or free. It was always going to be the case that the fix would mean higher taxes. And the national debt – it will never be paid off – and someday, those chickens will come home to roost in something possibly quite similar to The Great Depression. As they say, those who fail to learn from history are doomed to repeat it.
Another fix is simply to hold our tongues – and our fingers. Social media isn’t social – it is viciously, brutally, spitefully anti-social. People ‘say’ things on social media they would never say to your face. If they did say it to your face, you wouldn’t have them in your ‘social’ circle. Pick a topic – almost any topic, and you will find polarization with people strongly for or strongly against with few cool heads in the middle. Consequently, the less said these days, the better. Another old adage is, “If you can’t say anything nice, don’t say anything at all.” If people applied that today, social media chatter would collapse overnight. In fact, some people would be incredibly hardpressed to find something nice to say. Which, tragically, is a big reveal of something called the EQ, or emotional intelligence. continued
COVER STORY Compromise is another lost interpersonal skill. Unless both parties can have a win in the equation, the only other outcome is win-lose, which leaves one party bitter, angry, and looking for payback. The win-lose scenario permeates most conversations and interactions today. It feeds the uncertainty and insecurity. People do not want to interact with other people, especially someone with an opposing point of view, because the interaction is most likely to be or become hostile, quickly. It is a me-versus-you, us-versus-them society, factions facing opponents on a battlefield rather than humans working towards solutions. The media has to change. Journalism hasn’t existed for decades, ever since the newsroom became a profit center. Nearly all ‘news’ programs are not news – they are some facts, many
factoids (something that sounds like a fact but isn’t actually factual) littered with commentary and inflammatory rhetoric. The term ‘gaslighting’ is often used these days. It means to attempt to convince someone that their reality isn’t real, even when their common sense knows it is, but to instead believe in an alternate reality that serves someone else’s agenda. In other words, people have become pawns being used for someone else’s endgame. And the media couldn’t be more complicitous as the “channels” to people’s eyes and ears, whether it is network ‘news’ or social media – most of it has become pawn manipulation. The shift that has to occur is to seek win-win instead of win-lose, to pursue understanding instead of conflict, to humanize conversations rather than weaponize words, to encourage rather than to offend, and then the Circle of
New Jersey Manufacturers,
Do You Have... • Jobs that are difficult to fill with the right candidates? • Positions that have high turnover? • Occupations where a highlyskilled workforce is retiring soon?
Uncertainty and Insecurity becomes an opportunity field of challenges and acceptable solutions, one step at a time.
About the Authors: Tim Grady and Lew Weiss are the hosts of Manufacturing Talk Radio. Over the last 8 years, they have talked to hundreds of guests in the manufacturing sector, as well as businesses across all industries. Lew can be reached at laweiss@ mfgtalkradio.com. Tim can be reached at timgrady@mfgtalkradio.com. n
NJMEP offers Workforce Development Solutions to close the Skills Gap: • Pre-Apprenticeship Programs • USDOL Apprenticeships • ’Project 160’ No-Cost Training • ’Tri50’ Upskilling opportunities discounted with funds from the CARES Act
Building Skills. Building Confidence. Building the Future.
• Challenges in motivating employees?
Workforce challenges are still the number one concern for New Jersey manufacturing businesses. NJMEP is offering manufacturers a suite of workforce programs focused on solving these businesses most disruptive issues.
• Positions requiring skills that can be learned on the job?
New opportunities were developed using funds provided by the CARES Act. These new recruiting and upskilling programs are available for a limited time at a reduced cost.
• Difficulty attracting new and more diverse talent pools?
Contact NJMEP today to learn more about the Pro-Action Education Network™.
Contact NJMEP today and start taking the right steps forward.
2 RIDGEDALE AVE., SUITE 305 • CEDAR KNOLLS, NJ 07927 P: 973.998.9801 | WWW.NJMEP.ORG | INFO@NJMEP.ORG
Manufacturing Outlook / November 2021
23
CASS INDEX OUTLOOK
Cass Transportation Index Report by CASS INFORMATION SYSTEMS, INC.
Cass Freight Index - Shipments The shipments component of the Cass Freight Index® was 0.8% higher than the year-ago level in October, similar to the 0.6% y/y increase in September. On a seasonally adjusted (SA) basis, our shipments index recovered 2.8% m/m in October, after falling 4.9% m/m in September, partly due to Hurricane Ida. The two-year stack reversed to a 3.2% increase from a 1.3% drop in September. Freight volumes remain capacityconstrained, as shown by declining rail volumes and the ongoing backlog of containerships at anchor waiting to unload, but the 2.9% m/m improvement shows a modest rebound as restocking demand remained elevated. A pickup in automotive
24
Manufacturing Outlook / November 2021
volumes likely also helped, as October rail carloadings in the motor vehicle category rose about 15% m/m. Freight Expenditures The expenditures component of the Cass Freight Index, which measures the total amount spent on freight, rose to a new record level of 3.96, up 37% y/y in October. This index reaccelerated from 32% growth in September despite a slightly tougher prior-year comparison. On an SA basis, expenditures rose 3.9% m/m in October, mostly due to higher shipment volumes, and to a lesser degree from higher rates. On a two-year stacked basis, the Cass expenditures index was up 41% in October, mostly explained by higher rates, as shipment volumes were up just 3.2% on this basis. If normal seasonality were to play out for the
rest of this year, the full-year increase in this index would be 34% in 2021, after a 7% decline in 2020 and no change in 2019. Tougher comparisons in the coming months will naturally slow these y/y increases further, but normal seasonality implies double-digit increases through most of the first half of 2022. Inferred Freight Rates A simple calculation of the Cass Freight Index data (expenditures divided by shipments) produces a data set of inferred freight rates that explains the overall movement in rates. The freight rates embedded in the two components of the Cass Freight Index were 36% higher y/y in October, accelerated from the 31% y/y increase continued
This CASS INDEX has been posted with the permission of Cass Information Systems, Inc.
CASS INDEX OUTLOOK in September, partly on an easier comparison. The inferred rates rose 1.6% m/m on a seasonally adjusted basis in October in the third straight m/m increase. Though difficult to quantify, there are a lot of excess miles in the system due to all of the supply chain disruptions in the shortage economy of 2021. Chassis production improved this month but remains far from what is needed to address rail network congestion, so West Coast imports continue onto truckload, considerably raising the length of haul in the largest freight market. These excess miles are part of the 36% y/y increase in inferred freight rates, because, as noted in the calculation above, these rates are on a per shipment basis, rather than a per mile basis. But the difference between the increase in overall inferred freight rates and the Cass Truckload Linehaul Index® also includes higher fuel surcharges (not included in the TL index), sharper increases in air cargo rates, and mix shifts between modes, with a smaller proportion of lowcost intermodal and rail, and a larger proportion of relatively higher-cost air and refrigerated truckload. For full-year 2021, if normal seasonality were to play out, this index would be up about 20% from 2020. The data set is diversified among all modes, with truckload representing more than half of the dollars, followed by LTL, rail, parcel, and so on. Truckload Linehaul Index The Cass Truckload Linehaul Index® value of 150.9 in October rose 0.3% from September, and rose 12.2% y/y, similar to the 12.7% increase in September.
With upward pressure from chip shortages and upcoming vaccine mandates which could slow the driver recovery and push freight into the for-hire spot market, this index is still projected to trend higher. This data series trending below the 22% increase in Q3 public TL fleet rates is due to longer-haul mix. The large public fleets, by contrast, have been opting for shorter-haul shipments with better returns. Longer-haul mix related to intermodal chassis shortages pushing more freight off the rails and into truckload markets, particularly from the West Coast to Midwest, is continuing to pressure these data. While tempcontrolled length of haul is up a little, dry van length of haul is up meaningfully. We estimate this reduced the Cass Truckload Linehaul Index by roughly 7%-8% this month, so the mileage-neutral truckload rate is probably up about 20% y/y. Freight demand is clearly still strong and persistent supply constraints are keeping upward pressure on rates. The gradual easing of supply constraints for critical components of trucking capacity – drivers and equipment – will continue to be key to the longerterm outlook. This should change the trajectory of the Cass Truckload Linehaul Index over the next year, but not quite yet. Freight Expectations The current supply chain issues are building pent-up demand, and a broad range of freight demand fundamentals remain supportive, suggesting a positive demand environment will continue well into next year. Though the near-term direction of freight rates remains higher, cyclical forces like driver hiring and wafer fab construction, which take time, are
diligently occurring in the background and will dictate the direction of capacity, volume, and rate trends in 2022. Equipment. The heavy-duty truck production outlook continues to be pressured mightily by semiconductor shortages. However, global semiconductor shipments accelerated to 16% y/y growth in Q3, in a signal that perhaps the worst of the chip shortage is behind us. Chassis production improved in recent months to at least stop the contraction of the chassis fleet, but much more needs to be done to improve intermodal network performance. Trailer supply chains also face labor constraints. Drivers. In the strongest report this year, the October jobs report featured 15,300 total trucking job additions, including revisions, as hiring trends continue the improving trend of the past five months, ever since extended unemployment curtailments began. Though the ACT Research ForHire Driver Availability Index ticked down this month amid vaccine mandate uncertainty, the improving trend should continue as mandates are delayed in court and most of the trucking industry is effectively exempted. For more detail on a variety of risks related to the proposed vaccine mandate, from team drivers to private fleets to dock workers, see this month’s ACT Freight Forecast report. This report also forecasts the shipments component of the Cass Freight Index® and the Cass Truckload Linehaul Index® through 2023. n
Manufacturing Outlook / November 2021
25
ISM REPORT OUTLOOK
THE INSTITUTE FOR SUPPLY MANAGEMENT’S MANUFACTURING REPORT ON ® BUSINESS
BREAKING NEWS
ISM PMI at 60.8% for October 2021 Released November 1
ISM PMI for the past 5 years
OCTOBER 2021 60.8%
Expanding Contracting
continued
26
Manufacturing Outlook / November 2021
ISM REPORT OUTLOOK INSTITUTE FOR SUPPLY MANAGEMENT®
Analysis by
reportonbusiness Economic activity in the manufacturing sector grew in October, with the overall economy achieving a 17th consecutive month of growth, say the nation’s supply executives in the latest Manufacturing ISM® Report On Business®. The October Manufacturing PMI® registered 60.8 percent. Manufacturing performed well for the 17th straight month, with demand and consumption registering month-overmonth growth, in spite of continuing unprecedented obstacles (including the Imports Index moving into contraction territory) and everincreasing demand. Meeting demand remains a challenge, due to hiring difficulties and a clear cycle of labor turnover: As workers opt for more attractive job opportunities, panelists’ companies and their suppliers struggle to maintain employment levels. Disruptions from COVID-19, primarily in Southeast Asia, continue to have an impact on many industry sectors. Congestion at ports in China and the U.S. continues to be a headwind, as transportation networks remain stressed. Demand remains at strong levels, despite increasing prices. The 16 manufacturing industries reporting growth in October are: Apparel, Leather & Allied Products; Furniture & Related Products; Textile Mills; Electrical Equipment, Appliances & Components; Machinery; Printing & Related Support Activities; Food, Beverage & Tobacco Products; Computer & Electronic Products; Chemical Products; Fabricated Metal Products; Miscellaneous Manufacturing‡; Petroleum & Coal Products; Plastics & Rubber Products; Paper Products; Primary Metals; and Transportation Equipment. ISM ‡Miscellaneous Manufacturing (products such as medical equipment and supplies, jewelry, sporting goods, toys and office supplies).
Timothy R. Fiore, CPSM, C.P.M.
Chair of the Institute for Supply Management® Manufacturing Business Survey Committee
MANUFACTURING
PMI at 60.8% ®
PMI
Manufacturing grew in October, as the Manu2019 2020 2021 facturing PMI® registered 60.8 percent, 0.3 60.8% percentage point lower than the September reading of 61.1 percent. The Manufacturing PMI® continued to indicate strong sector expansion and U.S. economic growth in 50% = Manufacturing Economy October. All of the six biggest manufacturBreakeven Line ing industries expanded, in the following 43.1% = Overall Economy Breakeven Line order: Food, Beverage & Tobacco Products; Computer & Electronic Products; Chemical Products; Fabricated Metal Products; Petroleum & Coal Products; and Transportation Equipment.
Manufacturing at a Glance INDEX
Oct Index
Sep Index
% Point Change
Direction
Rate of Change
Trend* (months)
Manufacturing PMI®
60.8
61.1
-0.3
Growing
Slower
17
New Orders
59.8
66.7
-6.9
Growing
Slower
17
Production
59.3
59.4
-0.1
Growing
Slower
17
Employment
52.0
50.2
+1.8
Growing
Faster
2
Supplier Deliveries
75.6
73.4
+2.2
Slowing
Faster
68
Inventories
57.0
55.6
+1.4
Growing
Faster
3
Customers’ Inventories
31.7
31.7
0.0
Too Low
Same
61
Prices
85.7
81.2
+4.5
Increasing
Faster
17
Backlog of Orders
63.6
64.8
-1.2
Growing
Slower
16
New Export Orders
54.6
53.4
+1.2
Growing
Faster
16
Imports
49.1
54.9
-5.8
Contracting
From Growing
1
Overall Economy
Growing
Slower
17
Manufacturing Sector
Growing
Slower
17
*Number of months moving in current direction. Manufacturing ISM® Report On Business® data is seasonally adjusted for the New Orders, Production, Employment and Inventories indexes.
Commodities Reported
Note: The number of consecutive months the commodity is listed is indicated after each item.
Commodities Up in Price: Adhesives (4); Aluminum (17); Aluminum Products (7); Caustic Soda (5); Copper (2); Copper-Based Products; Corn; Corrugate (13); Corrugated Packaging (12); Crude Oil; Diesel Fuel (10); Electrical Components (11); Electronic Components (11); Foam (2); Freight (12); Isocyanate; Labor — Temporary (6); Logistics Services (2); Maintenance, Repair, and Operations (MRO) Supplies (2); Motors; Natural Gas (4); Nylon; Ocean Freight (11); Packaging Supplies (11); Pallets (4); Paper (2); Phosphates; Plastic Containers (2); Plastic Resins (14); Polyester Resin; Polyethylene (9); Polyethylene Terephthalate (PET); Polypropylene (16); Polyvinyl Chloride (PVC); Printed Circuit Board Assemblies (PCBAs); Printed Circuit Boards (PCBs); Resin-Based Products (9); Rubber-Based Products (3); Semiconductors (9); Steel (15); Steel — Bars; Steel — Carbon (11); Steel — Cold Rolled (3); Steel — Drums (2); Steel — Hot Rolled (14); Steel — Stainless (12); Steel Products (14); and Tin Products. Commodities Down in Price: Wood (3). Note: To view the full list, visit the ISM® Report On Busines ® website at ismrob.org
14
ISMWORLD.ORG Manufacturing Outlook / November 2021
continued
27
ISM REPORT OUTLOOK
ISM Report On Business ®
®
Manufacturing PMI® New Orders (Manufacturing) 2019
October 2021 Analysis by Timothy R. Fiore, CPSM, C.P.M., Chair of the Institute for Supply Management ® Manufacturing Business Survey Committee
20
2020
New Orders
2021
ISM’s New Orders Index registered 59.8 percent. Fourteen of 18 manufacturing industries reported growth in new orders in October — in the following order — are: Apparel, Leather & Allied Products; Furniture & Related Products; Printing & Related Support Activities; Textile Mills; Primary Metals; Chemical Products; Food, Beverage & Tobacco Products; Machinery; Petroleum & Coal Products; Miscellaneous Manufacturing; Computer & Electronic Products; Electrical Equipment, Appliances & Components; Fabricated Metal Products; and Transportation Equipment.
59.8%
52.8% = Census Bureau Mfg. Breakeven Line
Production (Manufacturing) 2019
2020
Production
2021 70
59.3%
52.1% = Federal Reserve Board Industrial Production Breakeven Line
The Production Index registered 59.3 percent. The 10 industries reporting growth in production during the month of October — listed in order — are: Petroleum & Coal Products; Furniture & Related Products; Electrical Equipment, Appliances & Components; Machinery; Fabricated Metal Products; Chemical Products; Computer & Electronic Products; Miscellaneous Manufacturing‡; Transportation Equipment; and Food, Beverage & Tobacco Products.
Employment (Manufacturing) 2019
2020
Employment
2021
52% 50.6% = B.L.S. Mfg. Employment Breakeven Line
20
Supplier Deliveries (Manufacturing) 53.1% 2019
2020
2021
75.6%
80
Inventories (Manufacturing) 2019
2020
44.5% = B.E.A. Overall Mfg. Inventories Breakeven Line
Manufacturing (products such as medical equipment and
supplies, jewelry, sporting goods, toys and office supplies).
28
Manufacturing Outlook / November 2021
Supplier Deliveries The delivery performance of suppliers to manufacturing organizations was slower in October, as the Supplier Deliveries Index registered 75.6 percent. All 18 industries reported slower supplier deliveries in October, in the following order: Apparel, Leather & Allied Products; Furniture & Related Products; Paper Products; Machinery; Electrical Equipment, Appliances & Components; Nonmetallic Mineral Products; Food, Beverage & Tobacco Products; Fabricated Metal Products; Computer & Electronic Products; Miscellaneous Manufacturing‡; Plastics & Rubber Products; Printing & Related Support Activities; Textile Mills; Transportation Equipment; Chemical Products; Wood Products; Petroleum & Coal Products; and Primary Metals. No industries reported faster supplier deliveries in October.
Inventories
2021
57%
‡Miscellaneous
ISM’s Employment Index registered 52 percent. Of 18 manufacturing industries, the 11 industries reporting employment growth in October — in the following order — are: Apparel, Leather & Allied Products; Textile Mills; Electrical Equipment, Appliances & Components; Furniture & Related Products; Printing & Related Support Activities; Plastics & Rubber Products; Machinery; Computer & Electronic Products; Fabricated Metal Products; Chemical Products; and Miscellaneous Manufacturing‡.
The Inventories Index registered 57 percent. The 14 industries reporting higher inventories in October — in the following order — are: Apparel, Leather & Allied Products; Printing & Related Support Activities; Textile Mills; Electrical Equipment, Appliances & Components; Furniture & Related Products; Plastics & Rubber Products; Machinery; Food, Beverage & Tobacco Products; Computer & Electronic Products; Paper Products; Miscellaneous Manufacturing‡; Primary Metals; Chemical Products; and Fabricated Metal Products.
continued
ISM REPORT OUTLOOK
ISM Report On Business ®
®
Manufacturing PMI®
October 2021 Analysis by Timothy R. Fiore, CPSM, C.P.M., Chair of the Institute for Supply Management ® Manufacturing Business Survey Committee
Customer Inventories (Manufacturing) 2019
2020
Customers’ Inventories
2021
31.7%
ISM’s Customers’ Inventories Index registered 31.7 percent. No industries reported higher customers’ inventories in October. The 15 industries reporting customers’ inventories as too low during October — listed in order — are: Nonmetallic Mineral Products; Paper Products; Primary Metals; Machinery; Wood Products; Textile Mills; Plastics & Rubber Products; Fabricated Metal Products; Electrical Equipment, Appliances & Components; Miscellaneous Manufacturing‡; Food, Beverage & Tobacco Products; Chemical Products; Furniture & Related Products; Computer & Electronic Products; and Transportation Equipment.
Prices (Manufacturing) 2019
2020
Prices
2021
85.7%
52.7% = B.L.S. Producer Prices Index for Intermediate Materials Breakeven Line
Backlog of Orders (Manufacturing) 2019
2020
The ISM Prices Index registered 85.7 percent. In October, all 18 industries reported paying increased prices for raw materials, in the following order: Apparel, Leather & Allied Products; Nonmetallic Mineral Products; Paper Products; Printing & Related Support Activities; Textile Mills; Furniture & Related Products; Machinery; Petroleum & Coal Products; Chemical Products; Computer & Electronic Products; Plastics & Rubber Products; Electrical Equipment, Appliances & Components; Miscellaneous Manufacturing‡; Primary Metals; Fabricated Metal Products; Transportation Equipment; Food, Beverage & Tobacco Products; and Wood Products.
Backlog of Orders
2021
63.6%
ISM’s Backlog of Orders Index registered 63.6 percent. The 15 industries reporting growth in order backlogs in October, in the following order, are: Apparel, Leather & Allied Products; Textile Mills; Paper Products; Machinery; Furniture & Related Products; Wood Products; Electrical Equipment, Appliances & Components; Miscellaneous Manufacturing‡; Chemical Products; Food, Beverage & Tobacco Products; Computer & Electronic Products; Fabricated Metal Products; Plastics & Rubber Products; Primary Metals; and Transportation Equipment.
New Export Orders (Manufacturing) 2019
2020
New Export Orders
2021
54.6%
ISM’s New Export Orders Index registered 54.6 percent. The 10 industries reporting growth in new export orders in October — in the following order — are: Furniture & Related Products; Paper Products; Primary Metals; Miscellaneous Manufacturing‡; Fabricated Metal Products; Food, Beverage & Tobacco Products; Computer & Electronic Products; Machinery; Chemical Products; and Transportation Equipment.
Imports (Manufacturing) 2019
2020
2021
Imports ISM’s Imports Index registered 49.1 percent. The five industries reporting growth in imports in October are: Textile Mills; Chemical Products; Furniture & Related Products; Food, Beverage & Tobacco Products; and Fabricated Metal Products.
49.1%
‡Miscellaneous
Manufacturing (products such as medical equipment and
continued
supplies, jewelry, sporting goods, toys and office supplies).
Manufacturing Outlook / November 2021
29
NORTH AMERICA OUTLOOK
NOVEMBER 2021
NORTH AMERICA OUTLOOK by Amelia Roy
The Institute of Supply Management PMI figure moved from 61.1 in September to 60.8 in October indicating a continuing strong expansion. New orders, employment and production are growing, supplier deliveries are slowing at a faster rate; backlogs are growing; manufacturing inventories are growing; customer inventories are too low; prices are increasing, exports are growing and imports are contracting.
“All of the six biggest manufacturing industries — Food, Beverage & Tobacco Products; Computer & Electronic Products; Chemical Products; Fabricated Metal Products; Petroleum & Coal Products; and Transportation Equipment, in that order — registered moderate to strong growth in October. The 16 manufacturing industries reporting growth in October — in the following order — are: Apparel, Leather
& Allied Products; Furniture & Related Products; Textile Mills; Electrical Equipment, Appliances & Components; Machinery; Printing & Related Support Activities; Food, Beverage & Tobacco Products; Computer & Electronic Products; Chemical Products; Fabricated Metal Products; Miscellaneous Manufacturing; Petroleum & Coal Products; Plastics & Rubber Products; Paper Products; Primary Metals; continued
30
Manufacturing Outlook / November 2021
NORTH AMERICA OUTLOOK
and Transportation Equipment. The two industries reporting a decrease in October compared to September are Wood Products; and Nonmetallic Mineral Products.’’ Comments from the manufacturing industry don’t change much from month to month. It’s still about labor, materials, freight, and chips. There is not much optimism for a change in the near term. Computer and Electronics products say that “getting anything from China is near impossible extreme delays.” Commodities up in price: Adhesives (4); Aluminum (17); Aluminum Products (7); Caustic Soda (5); Copper (2); Copper-Based Products; Corn; Corrugate (13); Corrugated Packaging (12); Crude Oil; Diesel Fuel (10); Electrical Components (11); Electronic Components (11); Foam (2); Freight (12); Isocyanate; Labor — Temporary (6); Logistics Services (2); Maintenance, Repair, and Operations (MRO) Supplies (2); Motors; Natural Gas (4); Nylon; Ocean Freight (11); Packaging Supplies (11); Pallets (4); Paper (2); Phosphates; Plastic Containers (2); Plastic Resins (14); Polyester Resin; Polyethylene (9);
Polyethylene Terephthalate (PET); Polypropylene (16); Polyvinyl Chloride (PVC); Printed Circuit Board Assemblies (PCBAs); Printed Circuit Boards (PCBs); Resin-Based Products (9); Rubber-Based Products (3); Semiconductors (9); Steel (15); Steel — Bars; Steel — Carbon (11); Steel — Cold Rolled (3); Steel — Drums (2); Steel — Hot Rolled (14); Steel — Stainless (12); Steel Products (14); and Tin Products.
stocks at a record pace, despite sharp rates of cost inflation. Selling prices and employment were up. There was a quick rate of growth of export orders. Business confidence was at its strongest since April 2018.
Commodities down in price: Wood (3).
The consultancy estimates light vehicle sales totaled 128,419 for the month for the lowest October sales since 2011. The drop in October was second this year only to September’s 19.6 percent fall from a year earlier. The seasonally adjusted annualized rate came in at 1.57 million vehicles.
Commodities in short supply: Adhesives and Paints (4); Caustic Soda; Corrugated Packaging (4); Electrical Components (13); Electronic Components (11); Foam; Freight (2); Labor — Temporary (6); Ocean Freight (7); Ocean Freight Containers; Packaging Supplies; Pallets; Phosphates; Plastic Containers (2); Plastic Products (9); Plastic Resins — Other (8); Polyvinyl Chloride (PVC) (2); Printed Circuit Board Assemblies (PCBAs) (3); Rubber-Based Products (3); Semiconductors (11); Silane; Silicon; Steel (11); Steel — Hot Rolled (12); Steel — Stainless (8); and Steel Products (9). Note: The number of consecutive months the commodity is listed is indicated after each item. CANADA’s PMI in October was at a seven-month high, with production and new orders continuing in expansion. October’s PMI, at 57.7, was up from September’s 57.0. Supply shortages, material scarcity, severe delivery delays continue, along with higher transportation and energy costs. Firms raised input
DesRosiers Automotive Consultants says Canadian auto sales were down 17.7 per cent in October from a year earlier as vehicle shortages caused by semiconductor supply issues continue to weigh on the industry.
MEXICO saw raw material shortages causing further drops in production, with some clients postponing purchases due to lack of items. Delivery times lengthened at a near record rate. There were softer contractions in new orders, stocks of purchases and employment. Production decreased for the twentieth month in a row. There were higher prices for electronic components, metal, oil, resin and transportation. Business sentiment was at a 42-month high, re expectations that the pandemic will recede and raw material availability will improve. The PMI for October, at 49.3, was up from September’s 46.6, a strongly positive move for manufacturing that has been crippled by the pandemic and related issues more than similar countries around the world. n Amelia Roy, Staff Writer
Manufacturing Outlook / November 2021
31
ASIA OUTLOOK
GLOBAL OUTLOOK
ASIA
Continuing Challenges Affecting Both Growth and The Global Economy by Christine Casati This month China has continued to face daunting challenges amid the following: energy shortages due to coal shortages or cutbacks, logistics bottlenecks, increasing demand for its products at home and abroad, threats to its financial stability caused by potential defaults undermining its epic property boom, drastic measures to achieve Zero COVID, historic political decision-making, rampant rumors of imminent war with Taiwan, and now soaring inflation after panic buying. Overall the above picture has negative implications for the global economy. According to a consensus of global economic and policy experts, shifts in Chinese government policymaking and President Xi’s mixed messages to the public have contributed to this situation.
32
Manufacturing Outlook / November 2021
The numbers give us a mixed picture. China’s economic growth, while continuing to fall from initial targets, is expected to achieve at least 5 percent growth for 2021. October’s PMI for China stood at 49.2, down from 49.6 in September. Currently China’s steel mills and forge shops are vastly underutilized. The PMI for the steel sector in October was 38.3 percent, down 6.7 percentage points compared to September (China Steel Logistics Committee). The PRODUCTION index for Chinese steel was down by 9.2 percentage points compared to September. Meanwhile the October Sub-index for new orders saw a big decrease of 10.8 percent which was a 28.2 percent drop month on month. Export orders also dropped 0.8
percent to 38.7 month on month. This is the fourth consecutive month of decline. In September, overall industrial production increased by 3.1 percent. But if we look at industrial growth year-on-year from September 2019 (pre-COVID) to the end of September 2021, industrial production increased by a total of 10.2 percent, or about 5 percent annually. There was a large increase in early 2021 compared to a very low base the year prior. However, this level of growth is not expected to continue as we see the trend in the October steel sector numbers above. China’s October Producer Price Index (PPI) accelerated year-on-year to 13.5 percent from September’s 10.7 continued
ASIA OUTLOOK percent a year ago (China National Bureau of Statistics). This is the fastest increase in the PPI since they began recording these statistics in the 1990s. Consumer inflation rose in October for the first time in three months (1.5 percent year-on-year), caused by rising energy bills and disruptions in the food chain, among other factors. Government warnings to stock up led to increases in the price of veggies by 16 percent and up to 30 percent increases at gas pumps. Soaring producer and consumer inflation in China is leading to global impacts on inflation. For example, this week, the USA inflation rate has hit 6.2 percent, the highest in 31 years. Other factors contributing to China’s decline in growth are the clampdowns in the technology sector, in some cases leading global players to pull out (most recently Yahoo), and some younger CEOs of successful and/or rising Chinese technology companies to resign (Tencent). SoftBank also took a beating but its CEO said he’s glad to be less dependent on China. Finally, the Chinese Communist Party’s decision to issue the third historic decision to allow President Xi Jinping to be China’s Supreme Leader indefinitely is a cause for uncertainty. The preparation for this occurred in 2018 when the Constitution was amended allowing China’s National Chairman unlimited terms. The first decision endorsed Chairman Mao; the second decision reversed the first and endorsed Chairman Deng Xiaoping. Such unlimited power to make decisions affecting markets and economic institutions is not expected to be good for economic growth.
There is a bright spot in China’s engagement with the United States. Amid preparations for a summit between Presidents Biden and Xi that occured earlier in November, China has signed onto a BILATERAL agreement with the United States to reduce methane emissions. However, they have NOT signed onto the U.S.- Coalition led agreement among participants at COP26 to achieve certain levels of methane emissions. Around Asia, countries such as Australia, New Zealand, and Singapore have decided to learn to live with COVID, but China has not. China fears far worse chaos than slowing economic growth if they allow COVID to spread. September saw China auto sales down for a fifth consecutive month, with sales down 19.6 percent year-over-year to 2.07 million vehicles overall, according to the China Association of Automobile Manufacturers (CAAM,) as a prolonged global shortage of semiconductors disrupts production. NEVs continue to thrive, however, where sales more than doubled to 357,000 units. Tesla, making Model 3 sedans and Model Y SUVs in Shanghai, sold 56,000 Chinamade vehicles in September, the highest since it started production in Shanghai some two years ago, and up 27 percent from 44,264 units in August. A senior CAAM official said chip shortages eased in September, and that supply is expected to further improve in the final three months this year. So far this year, NEVs have sold 2,157,000
units, including 1,788,000 batterypowered vehicles. JAPAN’s PMI rose from 51.5 in September to 53.2 in October. Japan saw renewed improvement in production and new orders, and input prices and selling prices were up at the quickest rate in over 13 years. There was a further easing of COVID-19 restrictions, and a very marked increase in business optimism. There are ongoing material shortages and delivery delays. Employment continued to increase in October, with the rate of job creation the strongest since April 2019. INDIA saw production and new orders up at the fastest rates in seven months. Purchases were up sharply in October, with the strongest increase in input costs since early 2014. Again, prices of raw materials, transportation and fuel all added to ever-increasing input costs. There was strong growth in sales and production in all three sectors, with intermediate goods the strongest, and an increase in export sales at a pace that was the quickest in three months. There was a slight drop in employment. The PMI for October, at 55.9, was up from September’s 53.7. Author profile: Christine is cofounder and President of China Human Resources Group, Inc, a management consulting firm based in Princeton NJ. She has provided U.S. companies with strategic development and project implementation services for projects in China since 1986. n continued
Manufacturing Outlook / November 2021
33
EUROZONE OUTLOOK
GLOBAL OUTLOOK
EUROZONE by Chris Anderson IHS Markit’s Eurozone Manufacturing Composite Purchasing Managers’ Index (PMI), in October at 58.3 nearly reached September’s 58.6. This represents an eight-month low for an index that is expanding in the 8 leading countries. Production and new orders softened in October. Supplier lead times lengthened drastically, leading to very high inflation rates. Input costs and selling prices took inflation to new highs. Backlogs continued to rise during October, an ill effect of supply-chain disruption: firms lacked the necessary parts to complete production. Employment was up for the ninth consecutive month. Low container availability, widespread shortages of components and raw materials, plus transportation issues, were all mentioned as sources of supply-chain pressures in October. The level of positive business sentiment fell to a one-year low.
34
Manufacturing Outlook / November 2021
The selling rate for automobiles in Western Europe dropped to 9.7 million units per year in September, from a rate of 11.7 million in August. This is evidence of the major sourcing issues, with dealerships unable to meet demand. All major Western European countries, with the exception of Spain, saw falls in selling rates. The UK had its worst September for over 20 years. Plugin vehicle sales were up 42 percent in September to 227,238 units. The first nine months of the year saw the sale of 1.58 million passenger plug-in vehicles registered in Europe, or 17.3 percent of the total market. The UK PMI rose to 57.8 in October from 57.1 in September. New order growth was up despite a reduction in export work. Selling prices were up at a record rate. There was a further slowing in the manufacturing upturn as production growth slowed from
increased supplychain disruption, staff shortages, and declining export work. The PMI increase was due to improved growth in new orders and employment, but a further slowdown in production growth held back the PMI figure. Supply-chain delays, shortages of raw materials, and “certain skills” had contributed to slower production growth. New export work fell slightly for the second successive month. Companies reported cancellations or postponements by some overseas clients due to longer lead times caused by port delays and freight issues. The domestic market held up better. Employment was up for the tenth consecutive month, at small, medium and large companies. UK manufacturers are optimistic, with 62 percent looking to increased production over the coming year. The U.K. Office for Budget Responsibility (OBR) says that leaving the European Union will reduce the size of the British economy by about 4% in the long run, with the pandemic cutting GDP by a further 2%. Richard Hughes, the fiscal watchdog’s chairman, said: “We’re less connected to the outside world than we were before, and this is as a result of the fact that it’s become harder to trade with our critical trading partner.” France, meanwhile, is threatening to disrupt the flow of trade with Britain, and energy supplies to the Channel Islands, due to a lack of licenses given to French boats since Brexit. Hmm, a lot of this is about fish. Irish trade continued to shift away from the U.K. and toward the rest of Europe in the first nine months of the year, according to data from Dublin Port. Britain now accounts for about half of all cargo shipped on pallets or in containers, down from two thirds Chris Anderson, before Brexit. n Staff Writer
GLOBAL PMI OUTLOOK
GLOBAL PMI OUTLOOK
by NORBERT ORE, DIRECTOR, HEAD OF INDUSTRIAL SURVEYS, STRATEGAS RESEARCH PARTNERS
Norbert Ore, Director, Head Of Industrial Surveys, Strategas Research Partners
PRICES SOAR – EMPLOYMENT LAGGING . OCTOBER 2021 BUSINESS SURVEY INSIGHTS There are winners and losers in every economic scenario and that is certainly the situation this month. While the U.S., Eurozone, the U.K., and Taiwan reported significant growth in October, the remaining surveys indicated expansion at a slower pace in countries where
growth is more difficult to achieve. While most sub-indexes were encouraging, Prices and Employment were discouraging. Many of the countries that we follow continue to have trouble recruiting workers. Prices, particularly energy prices, remain uncomfortably high.
This month’s scatterplot shows varying degrees of expansion as 16 of the 18 surveys we follow closely were sufficiently above the level that we consider expansion. Nine PMIs were in the Expanding-Strengthening quadrant and seven PMIs were in the Expanding-Weakening quadrant. Overall, very similar to September.
continued Manufacturing Outlook / November 2021
35
GLOBAL PMI OUTLOOK ISM U.S. Manufacturing PMI™ In October, the U.S. Manufacturing PMI (60.8) continued its trend above most of its global trading partners. The table below shows the year-todate average for each of the index’s components. New Orders are critical to economic growth as they are the precursor to expansion in Production. New Orders are considered to have leading properties, while Production is coincident. Employment is considered to be a lagging indicator, but at certain points in a recovery cycle it can tend to lead. For example, “blue collar employment” tends to strengthen and lead as manufacturers begin to ramp up at the beginning of a recovery. Supplier Deliveries is a reverse index in that a longer lead-time is considered positive for economic growth – it is also a good indicator of pricing strategies as longer lead-times support higher prices. Inventories offer insight into future Production plans and are often measured against New Orders to determine the capability of meeting future orders. The YTD averages for the PMI components depict strong output, weak employment, and insufficient inventories across a broad spectrum of products.
A PMI reading above 43.1 percent generally indicates an expansion of the overall economy. Therefore, the Manufacturing PMI in October indicated the overall economy grew for the 17th consecutive month following a contraction in April 2020. According to the ISM press release, “the past relationship between the Manufacturing PMI® and the overall economy indicates that the Manufacturing PMI® for October (60.8 percent) corresponds to a 5-percent increase in real gross domestic product (GDP) on an annualized basis.” Activity could be
stronger if supply chain disruptions were less severe (i.e. labor disincentives, component shortages, school closures, skill mismatches, high inflation). Drivers: New Orders (59.8, -6.9), Production (59.3, -0.1), and Employment (52.0, +1.8) boosted Manufacturing activity in October, continuing the growth experienced so far this year. Supplier Deliveries (75.6, +2.2), a contrarian in that it signals slower delivery times above 50.0 as economically bullish, are still stretched.
continued
36
Manufacturing Outlook / November 2021
GLOBAL PMI OUTLOOK A Quick Word on Capacity Thirteen industries are still operating below their pre-pandemic capacity utilization levels in the U.S., contributing to output limitations. Looking at the relative importance, these thirteen groups comprise 64% of industrial production. n
Manufacturing Outlook / November 2021
37
CREDIT MANAGER’S OUTLOOK
CREDIT MANAGERS’ OUTLOOK
by DR. CHRISTOPHER KUEHL MANAGING DIRECTOR OF ARMADA CORPORATE INTELLIGENCE THIS REPORT REPRINTED COURTESY OF THE NATIONAL ASSOCIATION OF CREDIT MANAGERS (NACM.ORG) WHERE MORE IN-DEPTH INFORMATION CAN BE FOUND.
Combined Sectors NACM’s Credit Managers’ Index (CMI) has been fluctuating for months starting with the decline from the pandemic, followed by unanticipated economic recovery earlier this year. However, October’s readings show some form of stability. This month’s combined index score remained fairly unchanged with only a 0.1-point drop to 58.0 compared to last month. “The fact that the CMI this month is nearly identical to the CMI last month is an anomaly but perhaps a welcome one,” said NACM Economist Chris Kuehl, Ph.D. “Given the fact that credit managers
tend to think more about the future than what is happening right now, this outbreak of stability may be pointing to a more predictable end of the year.” The combined index of favorable factors improved with a 1.7-point gain this month. Sales numbers and dollar collection improved by 2.3 points to 72.7 and 63.4, respectively. Amount of credit extended improved the most with a 2.5-point jump to 70.0 - the first time this category has breached the 70’s. New credit applications slipped 0.4 points to 64.6.
“Many companies are buying more heavily and aggressively than they usually do as they are trying to beat inflation and they are concerned about the supply chain,” Kuehl noted. The combined index for unfavorable factors slipped with a 1.3-point drop to 51.5 - the lowest level seen in the last year. Rejections of credit applications remained unchanged at 52.1 while accounts placed for collection dipped slightly by 0.2 points. The disputes category dropped 2.8 points into the contraction zone and the dollar amount of customer deductions also fell by 2.8 points into contraction territory. Filings for bankruptcies stayed fairly stable with a 0.5-point drop. continued
38
Manufacturing Outlook / November 2021
CREDIT MANAGER’S OUTLOOK
continued Manufacturing Outlook / November 2021
39
CREDIT MANAGER’S OUTLOOK
Manufacturing Sector The overall index for manufacturing remained fairly stable with a 0.2-point gain, but there was some more variability in the subsectors. Favorable factors gained 0.8 points while unfavorable factors slipped 0.9 points. “The stability in this sector comes as a bit of a surprise given the impact that supply chain woes have had on the sector this year,” Kuehl said. “Manufacturing has been the bright spot for the economy through the majority of the pandemic as the consumer had little choice but to shift their spending from services to goods.”
NACM CMI - 2 - September 2021 Sales improved slightly with a 0.2-point gain while new credit applications data dropped by 2.0 points. Dollar collections jumped by 3.1 points and amount of credit extended rose into the 70s for the first time in years. “Much of the motivation for the rise in credit has been the moves by manufacturers to buy more inventory as they worry about the impact of inflation and the chronic supply chain issues,” Kuehl said.
Within unfavorable categories, the rejections of credit applications fell 0.4 points while accounts placed for collection dropped 0.8 points. The disputes category fell further into contraction territory with a 2.3-point drop while dollar amount beyond terms escaped the contraction zone with a 0.5-point gain. Dollar amount of customer deductions slipped into contraction territory with a 2.4-point drop. Filings for bankruptcies remained unchanged at 56.5.
continued
40
Manufacturing Outlook / November 2021
CREDIT MANAGER’S OUTLOOK
n Author profile Dr. Christopher Kuehl (PhD) is a Managing Director of Armada Corporate Intelligence and one of the co-founders of the company in 1999. He has been Armada’s economic analyst and has worked with a wide variety of private clients and professional associations in the last ten years. He is the Chief Economist for the National Association for Credit Management and is on the Board of Advisors for their global division – Finance, Credit and International Business. He prepares NACM’s monthly Credit Managers Index. He is the Economic Analyst for the Fabricators and Manufacturers Association and writes their bi-weekly publication, Fabrinomics, which details the impact of economic trends on the manufacturer. Chris is the chief editor for the Business Intelligence Briefs, distributed all over the world by business organizations and he is one of the primary writers (with Keith Prather) for the Executive Intelligence Briefs. He also makes close to a hundred presentations each year to business and industry associations in the US and overseas. He is on the Board of the Business Information Industry Association in Hong Kong and serves as a resource for the media and for many trade publications. Chris has a doctorate in Political Economics and advanced degrees in Soviet Studies and Asian Studies and was a professor of international economics and finance for over 15 years prior to starting Armada.
Manufacturing Outlook / November 2021
41
METALS OUTLOOK
NOVEMBER 2021
METALS OUTLOOK by Royce Lowe Steel’s Upcoming Demand Worldsteel (the World Steel Assn.) recently updated its Short Range Outlook for steel demand for the next two years. It is forecasting a 4.5 percent increase in 2021 to 1,855.4 MT, following a 0.1 percent increase in 2020, and a 2.2 percent growth to 1,896.4 MT in 2022. This is actually stronger than expected, except for China. In the developed economies, a reduction in supply chain bottlenecks, continued pent-up demand, and rising business and consumer confidence, will strengthen the recovery through 2022. Steel demand fell by 12.7% in 2020, and is forecast to increase by 12.2% in 2021 and 4.3% in 2022, reaching its pre-pandemic level. The Chinese economy sustained its strong recovery from 2020 into early 2021, but it has slowed since June. Steel demand fell by 13.3 percent in July, and then by 18.3 percent in August.
42
There has been recent bad weather and spikes in infections this past summer, but slowdowns in construction and caps on steel production are the more serious causes. Real estate activity has weakened due to tough government measures on developers’ financing introduced in 2020. At the same time, infrastructure investment has not picked up in 2021 due to a depletion of investment opportunities and limited local government financing ability. With a continuing negative trend in the real estate sector, Chinese steel demand will show negative growth for the rest of 2021. As a result, while the January to August apparent steel use still stands at a positive 2.7%, overall, steel demand is expected to decline by one percent in 2021.
No growth in steel demand is expected in China in 2022, with the real estate sector remaining depressed in line with the government policy stance on rebalancing and environmental protection. Some restocking activities might support apparent steel use. Recent government action to push for a transition away from the real estatedependent growth model is likely to continue. In the U.S., the economy continues its robust expansion, driven by pent-up demand and a vigorous policy response following months of individual income support. The level of real GDP exceeded its previous high in the second quarter of this year. The EU is continuing its recovery, with Germany, a powerhouse exporter, continuing to see a strong continued
Manufacturing Outlook / November 2021
METALS OUTLOOK manufacturing performance, despite supply-chain disruptions. Steel demand in 2022 in Germany will benefit from a high manufacturing sector backlog and a construction sector that is expected to continue to grow. Italy, meanwhile, is seeing a strong recovery in such steel-using sectors as construction and domestic appliances.
is simple: Pay attention to Europe. They are not our friends. Topalian was somewhat less aggressive than his peer, but still suggested that steel made in the U.S. is “significantly cleaner than many import products and thus should be used where possible during the construction of renewable energy products.”
Japan and South Korea will see gradual recovery, with increasing exports, automotive manufacturing, and construction. Developing economies, excluding China, are to some extent being held back by new Covid-19 waves and low vaccination levels. India has been strongly affected by Covid-19 outbreaks, but has seen recovery since July in all sectors. Steel demand is expected to show recovery in 2021, and this year will likely see steel demand to 100 million tons. Vietnam, which successfully escaped the serious economic impact of the pandemic in 2020, has seen serious outbreaks in 2021. Brazil saw strong growth in 2021, but for 2022 is looking at fiscal weakness, higher interest rates, and political tension.
It is debatable whether or not these statements by these CEOs regarding the trustworthiness of Europe, and the cleanliness - or lack of it - of imported steel, ring true.
rolled coil reaching $2,200 per ton. Late October sees the price retreating for the first time in a long time, to below $1,900 per ton. This may be the end of these price increases; there again it may not. Prices on hot-rolled coil in Europe have softened by some 100 euros per ton since mid-September, and are still mostly stable in S.E. Asia.
Steel demand was initially aided by the strong performance of the automotive and durable goods sectors, but shortage of semiconductors and problems with supply chains and expensive raw materials are undermining this recovery. The momentum in the construction sector is weakening with the end of a residential construction boom and sluggish non-residential sector activities. The recovery in oil prices is supporting a recovery in energy sector investment.
Lourenco Goncalves of ClevelandCliffs and Leon Topalian of Nucor recently told analysts and investors on their companies’ third-quarter conference calls that they support the broad aims of U.S. negotiators, who are looking to replace the so-called Section 232 tariffs with a tariff-rate quota system that would allow for the dutyfree importing of a certain amount of European steel before imposing tariffs. But Goncalves was very vocal about holding the line with EU negotiators, saying the trade bloc has “no business playing both sides” of the broader steel production debate involving China.
President Biden’s infrastructure stimulus bill has been signed into law. While it should favorably impact steel demand, it may not do it at a very high market price point. The best estimates are “late 2022.” It’s been a super year for those in the hot-rolled steel coil business, with the price of the commodity reaching $1,960 per ton in late September-Early October, and cold-
Goncalves suggested that Europe needs to work with the U.S., saying that they (Europe) need to understand that if they are with us they should not be with China. We need to protect ourselves is his message. Not allowing Europeans to take advantage of us, he continued, is extremely important. He further said that when he talks to administration members, his message
Asian 304 grade stainless steel hotand cold-rolled coil prices, in October, were at their highest since September 2011. The past twelve months have seen prices in China up by over 50 percent, in Japan figures last reached in October 2008. China’s carbon reduction targets, and the country’s current electricity crisis, are largely responsible for these price hikes. There was movement in the prices of non-ferrous metals in the past month. The price of aluminum, from peaking at $1.45 per lb in mid-October, fell back to $1.23 in late October. It has moved from $0.80 per lb in the past year to $1.23. Copper moved from $4.15 per lb. in late September to $4.48 per lb. in late October. It has moved from $3.00 to $4.50 over the past year. Nickel moved up from $8.40 per lb in late September to $9.00 per lb in late October, and in the past year from $7.00 per lb. to $9.00 per lb. Zinc went from $1.40 per lb. in late September to $1.55 in late October; from $1.14 per lb. to $1.55 over the past year. n
Author profile:
Royce Lowe, Manufacturing Talk Radio, UK and EU International Correspondent, Contributing Writer, Manufacturing Outlook.
Manufacturing Outlook / November 2021
43
INNOVATION OUTLOOK
POWERING THE 21ST CENTURY WITH INTEGRATED PHOTONICS AIM Photonics (American Institute for Manufacturing Integrated Photonics), a Manufacturing USA® institute, establishes processes and protocols for the design, development, and manufacture of Photonic Integrated Circuit systems so manufacturers can harness a global market projected to exceed $792 billion annually by 2022. Manufacturing USA, a public-private partnership with 14 manufacturing institutes across the nation, connects companies, academic institutes, non-profits, and local, state, and federal entities to solve industry-relevant advanced manufacturing challenges in new technology areas with the goals of enhancing industrial competitiveness and economic growth and strengthening national security.
Technology Focus Area Photonic Integrated Circuits use light for applications that traditionally use electronics. Integrating light-based technology onto typical semiconductor chips dramatically improves performance and reliability of electronic integrated circuits while reducing weight and power consumption. Photonic sensors use light as radar—or “LIDAR”—in commercial and defense applications. In addition to tiny postage-stamp-sized LIDAR sensors that provide real-time 3D mapping for driverless cars, photonics can be used to manage database systems for cloud computing, detect sarin gases in national security environments, enhance medical imaging, and rate food safety by measuring the interactivity of chemicals. The institute is focusing on activities that target manufacturing readiness so that firms may more quickly transition to full-scale volume operation.
Approach to Innovation and Collaboration
LEARN MORE
+
CONNECT WITH AIM PHOTONICS Albany and Rochester, NY 518-956-7221 info@aimphototonics.com aimphototonics.com
AIM Photonics brings together partners in industry, government, and academia to advance next generation photonic technology by accelerating access through such programs as: Integrated Photonics Foundry Ecosystem reduces time to market by providing institute members with low-cost access to resources throughout the product development cycle TAP Facility: the world’s first 300mm open access test, assembly, and packaging facility, advances next generation PIC technology and connects with the photonics supply chain In-house 300 mm semiconductor fabrications for organizations to cost-efficiently generate their own silicon photonic devices and components AIM Academy: creating educational and workforce development programs in photonics fundamentals and automated design with in-person and online courses, hands-on training, and internship programs, as well as technology roadmapping for the future photonics ecosystem
Advanced Manufacturing National Program Office, NIST | www.ManufacturingUSA.com | 301-975-2830 | amnpo@nist.gov
44
continued Manufacturing Outlook / November 2021
INNOVATION OUTLOOK
COLLABORATIVE PROJECT EXAMPLES “New York is quickly becoming a global leader in photonics, and by supporting this burgeoning industry, we continue to invest in the future of the Finger Lakes and move the economy and – Andrew Cuomo, former Governor of New York busi-ness community forward.”
HIGH-CAPACITY PHOTONIC INTERCONNECTED SYSTEMS: Researching and testing replacements for costly traditional electronic switches that currently operate massive cloud-based data centers to overcome data bottlenecks and power consumption. New technology can increase data throughput at least tenfold while reducing energy consumption dramatically, so operating a data center will no longer cost more than building one.
SARIN GAS SENSOR: An AIM Photonics-led team is developing a process to produce detectors for chemical warfare toxins such as deadly sarin gas. The team is creating a polymercoated waveguide that concentrates a small gas sample for detection and analysis—the technology has broad-reaching non-defense applications including medical diagnostics and Advanced Manufacturing National Program Office, NIST | www.ManufacturingUSA.com | 301-975-2830 | amnpo@nist.gov point-of-care uses in medical offices. CRYOGENIC FOCAL PLANE ARRAYS (FPAS): In conjunction
Advanced Manufacturing National Program Office, NIST | www.ManufacturingUSA.com | 301-975-2830 | amnpo@nist.gov
with the U.S. Department of Defense, Sandia National Labs, University of Arizona, Raytheon and other firms, AIM Photonics is supporting the design, fabrication and testing of cryogenic PICbased datalinks for FPA readout with the potential to strongly advance imaging capabilities for national defense. This work will address limitations of conventional electronic readouts such as heat and communications bottlenecks and identify a common datalink solution operable across multiple systems and environments.
UNIVERSAL PIC PROCESS DESIGN KIT (PDK):
AIM Photonics’ unique collaboration with design companies Synopsys’ Optical Solutions Group, Cadence Design Systems, PhoeniX Software—now part Advanced Manufacturing of National Program Office, NIST | www.ManufacturingUSA.com | 3 Synopsys, Lumerical Inc., Mentor, Analog Photonics, MOSIS, and many other industry partners are addressing the challenges and fundamental changes needed with integrated photonics chip design. AIM Photonics has established an integrated photonic PDK, which now provides designers cost-effective and quick turn “Design to Fab” solutions utilizing AIM Photonics industry leading Foundry Partners.
“The integration of photonic integrated circuits with focal plane arrays is a critical path in developing future DoD imaging systems vital to the nation’s security.” – Dr. Frank Jaworski, Program Manager Emerging Technology, Raytheon Vision Systems Advanced Manufacturing National Program Office, NIST | www.ManufacturingUSA.com | 301-975-2830 | amnpo@nist.gov
Manufacturing Outlook / November 2021 Advanced Manufacturing National Program Office, NIST | www.ManufacturingUSA.com | 301-975-2830 | amnpo@nist.gov
45
AEROSPACE OUTLOOK
NOVEMBER 2021
AEROSPACE OUTLOOK by Royce Lowe Now it’s the Dreamliner There has been a further problem with the Boeing 787 Dreamliner, on jets built over the past three years, concerning “certain titanium parts that are weaker than they should be.” While effectively confirming parts of a story in the Wall Street Journal, a Boeing spokesman said that Boeing was notified by a supplier that some 787 parts “were improperly manufactured.” Boeing said it will rework undelivered 787 Dreamliners following the discovery of another defect on the jet. There have been no 787 deliveries since May. The Boeing spokesman stated that there is no safety-of-flight concern for the active in-service fleet. The Journal story also said the Federal Aviation Administration (FAA) was probing a series of quality-control issues, claiming the company allowed unqualified staff to sign off on quality checks. Boeing declined to comment on the probe, saying it would be “premature” to discuss the issues with a party other than the FAA. The FAA did not comment on this issue, and both parties are being tight-lipped.
The statement regarding parts being weaker than they should be raises a series of possible questions regarding said parts. Weaker than they should be could mean that they had been wrongly specified by Boeing, but if this were the case, all 787s may have been affected, and Boeing says this is not the case. So perhaps the problem titanium parts were supplied and installed over the past three years? Perhaps Boeing changed the particular part over the past three years. If the parts were weaker, then the titanium was “weaker” and further questions arise, namely did Boeing’s supplier unwittingly or otherwise supply weaker, for which read ‘defective’ parts? Boeing’s supplier would most likely have used material from its own supplier, and the material would certainly have been accompanied by a full range of test certificates. “Weaker” could mean that the material used by Boeing’s supplier did not meet the aerospace material specification (AMS), to which the test results would be compared. In any event, Boeing, being the final end user, should have
identified the defective parts unless the test certificate values were fudged, although it is common practice to accept the test results on the documents that accompany the parts at face value. There are many questions, and the FAA, of late very strict in their attitude towards Boeing’s quality control procedures, will be looking for answers. This is definitely a quality control problem, perhaps at several levels. Meanwhile, Boeing is increasing production of its 737 MAX even though Chinese airlines are still not allowed to accept deliveries of the still-grounded (in China) plane. They will increase production from 19 to 31 planes per month in early 2022. Boeing CEO David Calhoun is optimistic, but as he told CNBC, if the China orders don’t start coming through fast, he will need to reassess. An aviation analyst says Boeing would need to deliver over 500 MAX aircraft in 2022 to meet its goals. The plane continued
46
Manufacturing Outlook / November 2021
AEROSPACE OUTLOOK has done well since its re-certification by the FAA in November 2020, and is now operated by 31 carriers worldwide. According to Boeing, the company has delivered 195 MAX aircraft since its return. But China is key to the continuing success of the MAX, and of the 370 MAX jets in the manufacturer’s current inventory, about a third are designated for China. Chinese airlines cannot receive the jet without the country’s regulatory approval. According to Bloomberg, Boeing has plans to clear most of its inventory by the end of 2023, assuming it can deliver its stockpile to China in early 2022. Boeing has been working with the Civil Aviation Administration of China to re-certify the jet in the country. The sustainable fuel offensive is taking hold in the air transport industry. For the first time, an Airbus A319neo made a test flight in the Toulouse region on Thursday, October 28, using a LEAP (Leading Edge Aviation Propulsion) engine running on 100% sustainable
aviation fuel (SAF). This alternative energy source is favored by the aviation industry, and could reduce the carbon footprint of existing aircraft by up to 80 percent, taking into account their entire lifecycle, using biomass, food and agricultural waste. The fuel used during this flight, supplied by Total Energies, was made from used cooking oil. This is why manufacturers are determined to exceed the current rate of SAF incorporation in aircraft, which is set at 50% for most certified systems. This is why Airbus, Dassault Aviation, Safran, ONERA (French National Aerospace Research Centre ) and the French Ministry of Transport have launched the VOLCAN project, which stands for VOL with Carburants Alternatifs Nouveaux, (new alternative fuels), and which includes the flight of this A319neo. These players are seeking to analyze the impact of a flight using 100% sustainable fuel on the aircraft’s equipment and emissions. What engine adaptations are needed? What about emissions and drag?
This work, like the work Airbus is doing with Rolls-Royce, is aimed at promoting the deployment of sustainable aviation fuels. Air transport is responsible for about 3% of global greenhouse gas emissions. Aircraft and engine manufacturers are working together to certify 100% SAFcompatible aircraft and engines by the end of the decade. This democratization will also depend on the availability of resources and the ability to collect them, as well as the implementation of incentives to encourage the use of fuels that are much more expensive than traditional kerosene. n A long road ahead, a little at a time. Author profile: Royce Lowe, Manufacturing Talk Radio, UK and EU International Correspondent, Contributing Writer, Manufacturing Outlook.
Manufacturing Outlook / November 2021
47
ENERGY OUTLOOK
NOVEMBER 2021
ENERGY OUTLOOK
China’s Promises On Coal by Jocelyn Bright While many countries in the world are trying to outdo each other with the size of their wind turbines, on land or sea, fixed or floating, and while these same countries are promising to reduce their carbon footprint, there are still questions regarding the sincerity of some of these promises. We’re speaking here particularly of China, and of Xi Jinping’s statement at the United Nations General Assembly in late September, when he pledged, in a video recording: “China will step up support for other developing countries in developing green and low-carbon energy, and will not build new coal-fired power projects abroad.” The US Climate Envoy John Kerry welcomed the announcement, saying in a statement that he was “absolutely
delighted to hear that President Xi has made this important decision.” China has been funding coal projects in countries like Indonesia and Vietnam under a massive infrastructure project known as the Belt and Road Initiative (BRI). But it has been under pressure to end the financing, as the world tries to meet Paris climate agreement targets. The BRI has seen China fund trains, roads, ports and coal plants in numerous countries, many of them developing nations. For the first time in several years however, it did not fund any coal projects in the first half of 2021. For nearly a decade now, coal-fired power stations have been a key feature of Xi Jinping’s Belt and Road Initiative
of foreign investment. However, the reality is that the number of these projects has fallen significantly. China burns half the world’s coal, and is still adding numerous power plants at home, with a lifespan of 40 to 50 years. The biggest question remains, and will for some time, namely when will China start to cut the overall number of power plants within its borders and substantially reduce its dependency on this most polluting form of power generation? To be fair to China, it has to provide power for 1.4 billion people, so it verges on the impossible for it to stop using coal for an indefinite period. The country is making efforts to continued
48
Manufacturing Outlook / November 2021
ENERGY OUTLOOK reduce its dependence by advances in alternate forms of energy, wind and solar, and in the production and use of electric vehicles. The true test for China will come as its promise to build no more plants outside the country is monitored. Xi is not the only national leader to have his fingers wrapped around coal. After months of being hauled over the coals, so to speak, to beef up its climate-change commitments, Australia’s prime minister, Scott Morrison, recently told parliament that his coalition government would reduce the country’s emissions to “net zero” by 2050. That would still be trailing other rich countries, according to the Climate Council, an Australian pressure group. Mr. Morrison is resistant to more urgent cuts and says he wants a 26-28% cut by 2030,
compared with 2005 levels-a fraction of what many other Western countries are promising. Australia’s coal industry is thriving. It is the world’s second-biggest exporter and state and federal governments keep opening new mines. In addition, Mr Morrison plans to open up five new natural gas basins to fuel a “gasfired recovery” from the pandemic. Australia hopes to supply the world with fossil fuels until the dirtiest countries stop burning them. That might be too late. Meanwhile, over in Blighty, the Chinese owner of the UK’s only largescale battery factory has revealed plans for a big expansion that will put the plant in Sunderland among the biggest electric vehicle facilities in Europe. Envision said annual
capacity at the plant would eventually rise to 38 gigawatt hours (GWh), an increase from a previous plan of 11GWh that was announced in July as part of a supply deal for the Japanese carmaker Nissan’s Sunderland plant. Battery companies are investing billions of pounds around the world in new facilities as they race to match the accelerating demand for electric vehicles. Lei Zhang, the chief executive of Envision, said in an interview with the Financial Times that the Shanghai-based company was in talks with global carmakers about using the Sunderland plant, and another in France, to supply Jocelyn Bright, their car factories. n Staff Writer
NEW EPISODES EVERY TUESDAY AT MFGTALKRADIO.COM
Manufacturing Outlook / November 2021
49
AUTOMOTIVE OUTLOOK
NOVEMBER 2021
AUTOMOTIVE OUTLOOK by Lawrence Makagnon LET HERTZ PUT YOU IN AN EV Tesla just won’t run away and hide for even a little while. Nor will its boss. The latest big news for the company is an order from Hertz GlobalHoldings Inc., not long out of bankruptcy, for 100,000 Teslas, for delivery over 14 months. Bloomberg says the order, months in the making, is worth $4.2 billion. It sparked craziness in the stock market and made Elon Musk $36 billion richer – on paper. Other car-rental companies are expected to follow the EV route. Tesla’s network of superchargers will be available to customers, while Hertz will build its own network. Mark Fields, ex Ford CEO is the interim CEO of Hertz. Tom Brady will do the commercials. How can this venture fail?
50
Mary Barra, GM’s Chair and CEO, says that GM will close the gap in the next four years. She told CNBC that GM would carry on working until it has the number one EV marketshare. She was speaking during GM’s third-quarter earning’s report, when she had to announce a drop in sales and profit from the same period last year. GM put this down to the semiconductor shortage and rising commodity prices. The expectation is that GM’s adjusted earnings will finish the year above their previous forecasts. GM have their work cut out catching Tesla, even over a fouryear span. Tesla has 60 percent of the U.S. EV market versus GM’s 9 percent.
GM is aiming high. It is looking to have a range of more than 30 EV models at various prices by 2025, and to have EVs account for at least 40% of GM’s forecasted revenues of roughly $300 billion by 2030. Barra said that as sales rise, the EV business margins will grow, in large part because of its Ultium battery and charging platform and more rapid product development. Toyota is to put up $3.4 billion on vehicle batteries through 2030, with at least $1.2 billion to be spent in the U.S., which will create 1,750 new jobs. The first batteries will be for the Toyota battery hybrid vehicles. continued
Manufacturing Outlook / November 2021
AUTOMOTIVE OUTLOOK
Toyota says it has sold 18.7 million hybrid, plug-in hybrid, fuel cell, and battery electric vehicles worldwide, including 4.5 million in the U.S.. These figures represent just under a quarter of Toyota sales, but the company says it expects this to rise to 70 percent by 2030. Toyota forecasts November production at 10-15 percent below normal, from one million units to between 850,000 and 900,000, with 50,000 fewer in Japan, 50,000 -100,000 units overseas. World plugin sales from January to August 2021 read as follows, in thousands of units: Tesla Model 3 285; Wuling Mini EV - 254; Tesla Model Y - 181; VW ID4 - 61; BYD Han EV - 50; Those were the top five. Number 19 was the Ford Escape PHEV, number 20 the Ford Mustang Mach-E. Bloomberg and BloombergNEF (New Energy Finance) recently made a case for the disruptive effects of the EV revolution on the traditional automotive manufacturing, selling and servicing. Not to mention the American cornfields. Less gasoline means the need for ethanol, which is blended into motor fuels and
consumes a third of the U.S. corn crop, will also fall. When we consider the work that goes into the manufacture of “traditional” vehicles, namely those with an internal combustion engine, most of the casting, forging, extrusion, machining, welding and other hot and cold work operations, will no longer be required in an electric vehicle. Not to mention the dealerships. It’s estimated that some 4.7 million jobs in the U.S. are given over to the manufacturing, selling and servicing of such vehicles.
number of parts in a conventional car’s motor and transmission, it’s almost unbelievable that some EV powertrains have as few as 17. Then there are the radiators, gas tanks and exhaust systems the EVs don’t need. There are no spark plugs, there’s no oil to change, no mufflers to corrode. We are, admittedly, looking quite a way down the road. We don’t know when the “crunch” will come, but we do know that all the major automobile giants are totally committed to the EV revolution.
And think of how many jobs are devoted to oil and gas extraction. BloombergNEF predicts the demand for oil will be reduced by 4.7 million barrels a day by 2040, in the U.S. alone, or some 26 percent of U.S. consumption.
AUTOMOTIVE OUTLOOK: When America introduced the automobile in the first decade of the 1900’s, during the age of the horse and buggy, it was a novelty that was not expected to succeed. Within 20 years, it disrupted the manufacture of buggies and tack, and many small and mid-size manufacturers went bankrupt.
ExxonMobil and Chevron, two American oil giants, reported their best quarterly profits in years, powered by surging energy demand and a commodity-price boom. ExxonMobil’s net income in the three months to September was $6.8bn, up $2.1bn from the second quarter; Chevron’s was $6.1bn, an increase of $3bn. Flush with cash, ExxonMobil will resume share buybacks starting next year after halting them in 2016. Mmmm! The scenario just described will entail job losses. Hence the need for jobs to replace them, hence the need for training, on the job, in the classroom. Hence the need for action on the part of government, business, likely academia. We will look further into this in the “ISSUES OUTLOOK.” Battery manufacture will employ thousands, but when we consider the
As the manufacture of electric vehicles ramps up, the demand for hundreds of original equipment and replacement component parts will be similarly disrupted, and many small and mid-size manufacturers will have to shift to making EV parts, or specialty replacement parts for older or ‘antique’ internal combustion engines, or make something else – or, go out of business.
Lawrence Makagon, Staff Writer
The OUTLOOK for the first serious impacts of this manufacturing disruption may be one or two decades away. n
Manufacturing Outlook / November 2021
51
CYBER SECURITY OUTLOOK
NOVEMBER 2021
CYBER SECURITY OUTLOOK
If It Ain’t Broke, Better Fix It! – Part 2: What to Do?
By Ken Fanger MBA, CMMC-RP, President, On Technology Partners If you read my first article, “If It Ain’t Broke, Better Fix it!” ( Manufacturing Outlook October 2021), you understand that you need to have your technology up-to-date if you want to stay cyber-safe and protect your business. The question now becomes: Where to start? Do you just upgrade everything or take it slow? Can you afford to shut down your business to get everything in place? “What is all this going to cost me, and can I even afford it?” In this article, I hope to help you address these questions and help you move forward in your “Better Fix It” process.
52
Manufacturing Outlook / November 2021
Use these six steps to help you prepare for upgrading your technology and getting out of the “If it ain’t broke, don’t fix it” trap. 1. Evaluate your current situation. Before you spend any money to make changes, take the time to get an inventory of what you have. What systems have not been updated? What effect do those systems have on your operations? Also determine how do you get support on these systems? I have worked with several companies where they had custom-created applications that an individual had created, and
that individual no longer supported the system. It could be because the person retired, changed jobs, or, in one case, it was because the person had died suddenly of a heart attack. Also consider what is pushing the evaluation. Is it just an internal concern, or is there an external driver such as a mandate or compliance requirement that is forcing the change? This will affect the speed in which you need to make changes. Make sure to also understand how old your items are. If you are still using items from the 90s, they may need to be upgraded more urgently—not to mention they will also be more challenging (but necessary) to upgrade. continued
CYBER SECURITY OUTLOOK 2. Determine what is most important. Now that you know what you have, start to look at what is important. I tend to use a 10-point system. If it does not affect the bottom line, it would get a 1; if it shuts down the company’s production, it would get a 10.
or two to give you time to get a budget reserve. However, we all know that if we don’t feel an urgency for something, or understand its importance, then we may find it easier to take that planned budget and “move it” to other more immediate problems.
Here are some examples: I would give a one (1) to a secondary door access system. The reason for this is that if the system is not working, it would only cause a minor disruption to operations; people could walk around to another door. Then I would give a ten (10) to the inventory/ERP system, as that being down would result in production being stopped or reduced.
4. Determine your timeline. This can be the hardest part because there is never a good time to upgrade your systems. The best way to do this is to look for down production times or maintenance windows. Where possible, schedule your upgrades during low production times or after hours. Remember—this means members of your team will have to be available during that time, so you will need to budget for overtime or extra hours. Next, make sure that you have a change-over timeline. I like to try to have the systems run in tandem for a week or two, especially when they are critical to your operations. This gives you the means to see if things are working as expected, while maintaining a fallback if you need to abort the process.
Here are some additional items to think about: 1. Does it stop your production line? 2. Is it needed for daily operations? 3. Does it contain vital information? 4. Does it affect accounting/billing/ payroll? 5. Does it affect inventory or shipping? 6. H ow disruptive do you think it will be to change? Questions like these will help you determine what items have the potential to be the most disruptive and need to be addressed first, and what items are of lower priority that can be addressed later. 3. Determine your budget. Now comes the least desirable part of this process: determining the money required. Many of us know that we can’t afford to replace these systems, but it is also true that we cannot afford not to. At this stage, you will need to set a budget for which items you will upgrade. I always suggest starting with the items that you defined as a 10 (from above). These are the most important to your operations and losing them could potentially cost you the company. In a perfect world, you can plan for your upgrades in a year
5. Set your plan. This next step is vital: Make sure you build a plan. In this plan, you should define all stakeholders that need to be involved, including any working or production people that are affected. Then, set up your timelines and milestones to ensure that you are being successful in your efforts. In this plan, you should try to define what unknowns you may have, and what you are doing to mitigate them. I have learned that you should make your plan as simple as possible, keeping to the facts with bullet points and not a lot of words. You need people to review this plan and use it as they go. A project management system like Trello may help you collaborate. Take the planning very seriously, as it can mean the difference between success and failure.
6. Manage the unexpected. I always include this last part because no matter what you do, there will always be the unexpected. If you have planned for it, then it will be easier to adjust for it. Anything can change unexpectedly: you could lose a vital employee, the system could crash unrecoverably, or you could get a massive order and not be able to continue the change. Having ideas about what could go wrong will help you to be ready to address any issues, while also minimizing the chances they undermine your company. Remember to stay calm and keep moving; there are times when projects go poorly and panic can make matters worse. If you have already considered the “bad,” then it will not leave you like a deer in the headlights when it happens. No project is perfect, so remember: “Pray for the best and plan for the worst.” Contact us at https://ontechnologypartners.com/contact/ if you have questions or need help with technology upgrades. n Author profile: Ken Fanger, MBA has 30 years of industry experience in the fields of technology and cyber security, and is a sought-after CMMC Registered Professional, helping manufacturers and contractors to meet DoD requirements for CMMC compliance. He is passionate about technology deployment, and his MBA in Operations & Logistics has helped him to be an asset in the designing and deployment of networks to enhance the manufacturing experience. Over the past 5 years, he has focused on compliance and security, including working on the SCADA control system for the Cleveland Power Grid. Mr. Fanger works with each client to identify their unique needs, and develops a customized approach to meeting those needs in the most efficient and cost-effective ways, ensuring client success.
Manufacturing Outlook / November 2021
53
ISSUES OUTLOOK
NOVEMBER 2021
ISSUES OUTLOOK
by Royce Lowe
The Apprentice, again… As mentioned above, it looks as though the inevitable growth of electrification of all types of transport vehicle passengers and goods - will entail the loss of many traditional manufacturing, sales and servicing jobs. It is also inevitable that new skills will be required to replace at least some of these. The American manufacturing scene is today, and has been for a goodly while, in expansion mode, but of late, throughout the pandemic, there have been cries from the manufacturing industry for more workers, many of them skilled. There is no doubt that this problem is one of the most severe confronting American industry, despite ongoing pleas from many quarters for a solution. On the face of it, this is a problem with a none-too-difficult solution. It is also a problem that has been around for a long time. It basically concerns the
hiring of people looking for jobs for which, in some cases, their skills are suited, in others, it calls for training. This involves, in large part, what we call apprenticeships (derived from the French apprendre, meaning to learn), something America has not been terribly good at, something the Germans and other Northern European countries excel at. Not surprisingly, the problem has been studied for years, and recommendations galore have been thrown at it. A recent article in Industry Week, authored by Michael Collins, who studies and writes on the manufacturing scene, points to a Deloitte and the Manufacturing Institute prediction that U.S. manufacturing would have 2.1 million unfilled jobs by 2030. In July 2021, the Department of Labor (DOL) Job Openings and Labor Turnover Survey (JOLTS) showed 889,000 unfilled manufacturing jobs. Collins’ enquiries to the DOL failed
to determine how many of the jobs were skilled versus unskilled. Further enquiries to government and industry also failed to answer this question. Further enquiries to various manufacturing associations came up with answers such as the unfilled jobs are 25 percent white-collar jobs, 75 percent blue-collar; 75 percent are highly-skilled jobs and 25 percent unskilled; most unfilled jobs are middle-skill and many require apprentice training. Many companies do not want to invest in long-term apprentice training, feeling they won’t get a good return on their investment, or that their trainees will go looking for better jobs. Couldn’t such fears be assuaged by showing more interest in the better employees, perhaps paying them more, or ending up being one of the better companies in their field? The National Tooling and Machining Association says 70 percent of its continued
54
Manufacturing Outlook / November 2021
ISSUES OUTLOOK members are shops with less than 40 employees, and thus they can afford neither the time nor the money for apprentice training. Perhaps good training and treatment of employees would help a company to be the best at what it does? The website of the Office of Apprenticeship Training says that the total annual number of registered apprentices in manufacturing fell from 20,950 in 2001 to 15,510 in 2020, while apprenticeships in other sectors like construction are growing.
average number of hours of training, per employee, among their members is 27.7 hours per year. and for new employees it was 42.9 hours per year. The training survey also shows that only 32% of members have apprentice training programs. The study says that “75% of industrial organizations identified reskilling the workforce as important or very important for their success over the next year, but only 10% said they were very ready to address this trend.”
The 2021 skills gap report also focuses on smart manufacturing and the 4th Industrial Revolution. It says manufacturers must transform the world of work using artificial intelligence, advanced robotics, automation analytics, cloud computing, wireless communication, big-data analytics and the IoT. But the report doesn’t say anything about how much training will be needed to accomplish the digital revolution. If manufacturing is having trouble finding entry level workers and investing in the training of semi- and advanced-skilled workers, how will it train people for the digital revolution and transform the world of work?
The Economic Policy Institute says the passage of President Biden’s infrastructure and reconciliation bills will lead to the creation of 556,000 new manufacturing jobs.
A January 2020 training survey by the Manufacturing Institute shows that the
Instead of investing in long-term training, multinational corporations have been trying to solve the skilled worker shortage with such stopgap measures as: hiring H-1B foreign visa workers: these visas are used mostly for engineers and in the hightech industries and are limited to 85,000 new jobs per year; outsourcing: moving production and jobs to lowcost countries; automating: there has been a huge investment in automation such as robots, packaging machines, and automated production lines, but
not enough workers can troubleshoot, operate and maintain the automation, which has added to the skilled-worker shortage; buying services: there are not enough tool and die and mold-making shops in the U.S. today. Corporations buy these services from foreign companies; poaching trained workers: for many years, corporations have been stealing trained workers from their suppliers by offering higher pay and benefits. The Deloitte report says 2.69 million manufacturing workers will be retiring, making training of current and future workers even more critical. In fact, 10,000 baby-boomers have been retiring every day since 2011, when those born in 1946 turned 65. A DOL breakdown of the 889,000 unfilled manufacturing jobs into highly skilled, semi-skilled and unskilled categories would give industry leaders a good idea of what level of training is required. This issue has been dissected and discussed numerous times over the past decades. It is surely past the time for further discussion; action is the only plan left. n Author profile: Royce Lowe, Manufacturing Talk Radio, UK and EU International Correspondent, Contributing Writer, Manufacturing Outlook.
200” Max O.D. 6” Min O.D. To 80,000 lbs.
ISO9001:2015 SINCE 1994 AND AS9100D SINCE 1998 - NIST SP 800-171 (COMPLIANCE UNDER DEVELOPMENT)
TOLL FREE IN THE U.S. 800.600.9290 - 973.276.5000 - CANADA: 416.363.2244 - INFO@STEELFORGE.COM - STEELFORGE.COM
Manufacturing Outlook / November 2021
55
ISSUES OUTLOOK
U.S. 56TOLL FREE 800.600.9290 - IN CANADA: 416.363.2244 Manufacturing Outlook / November 2021
ISO9001:2015 SINCE 1994 AND AS9100D SINCE 1998 NIST SP 800-171
(COMPLIANCE UNDER DEVELOPMENT)
*
*Toll free within the U.S.