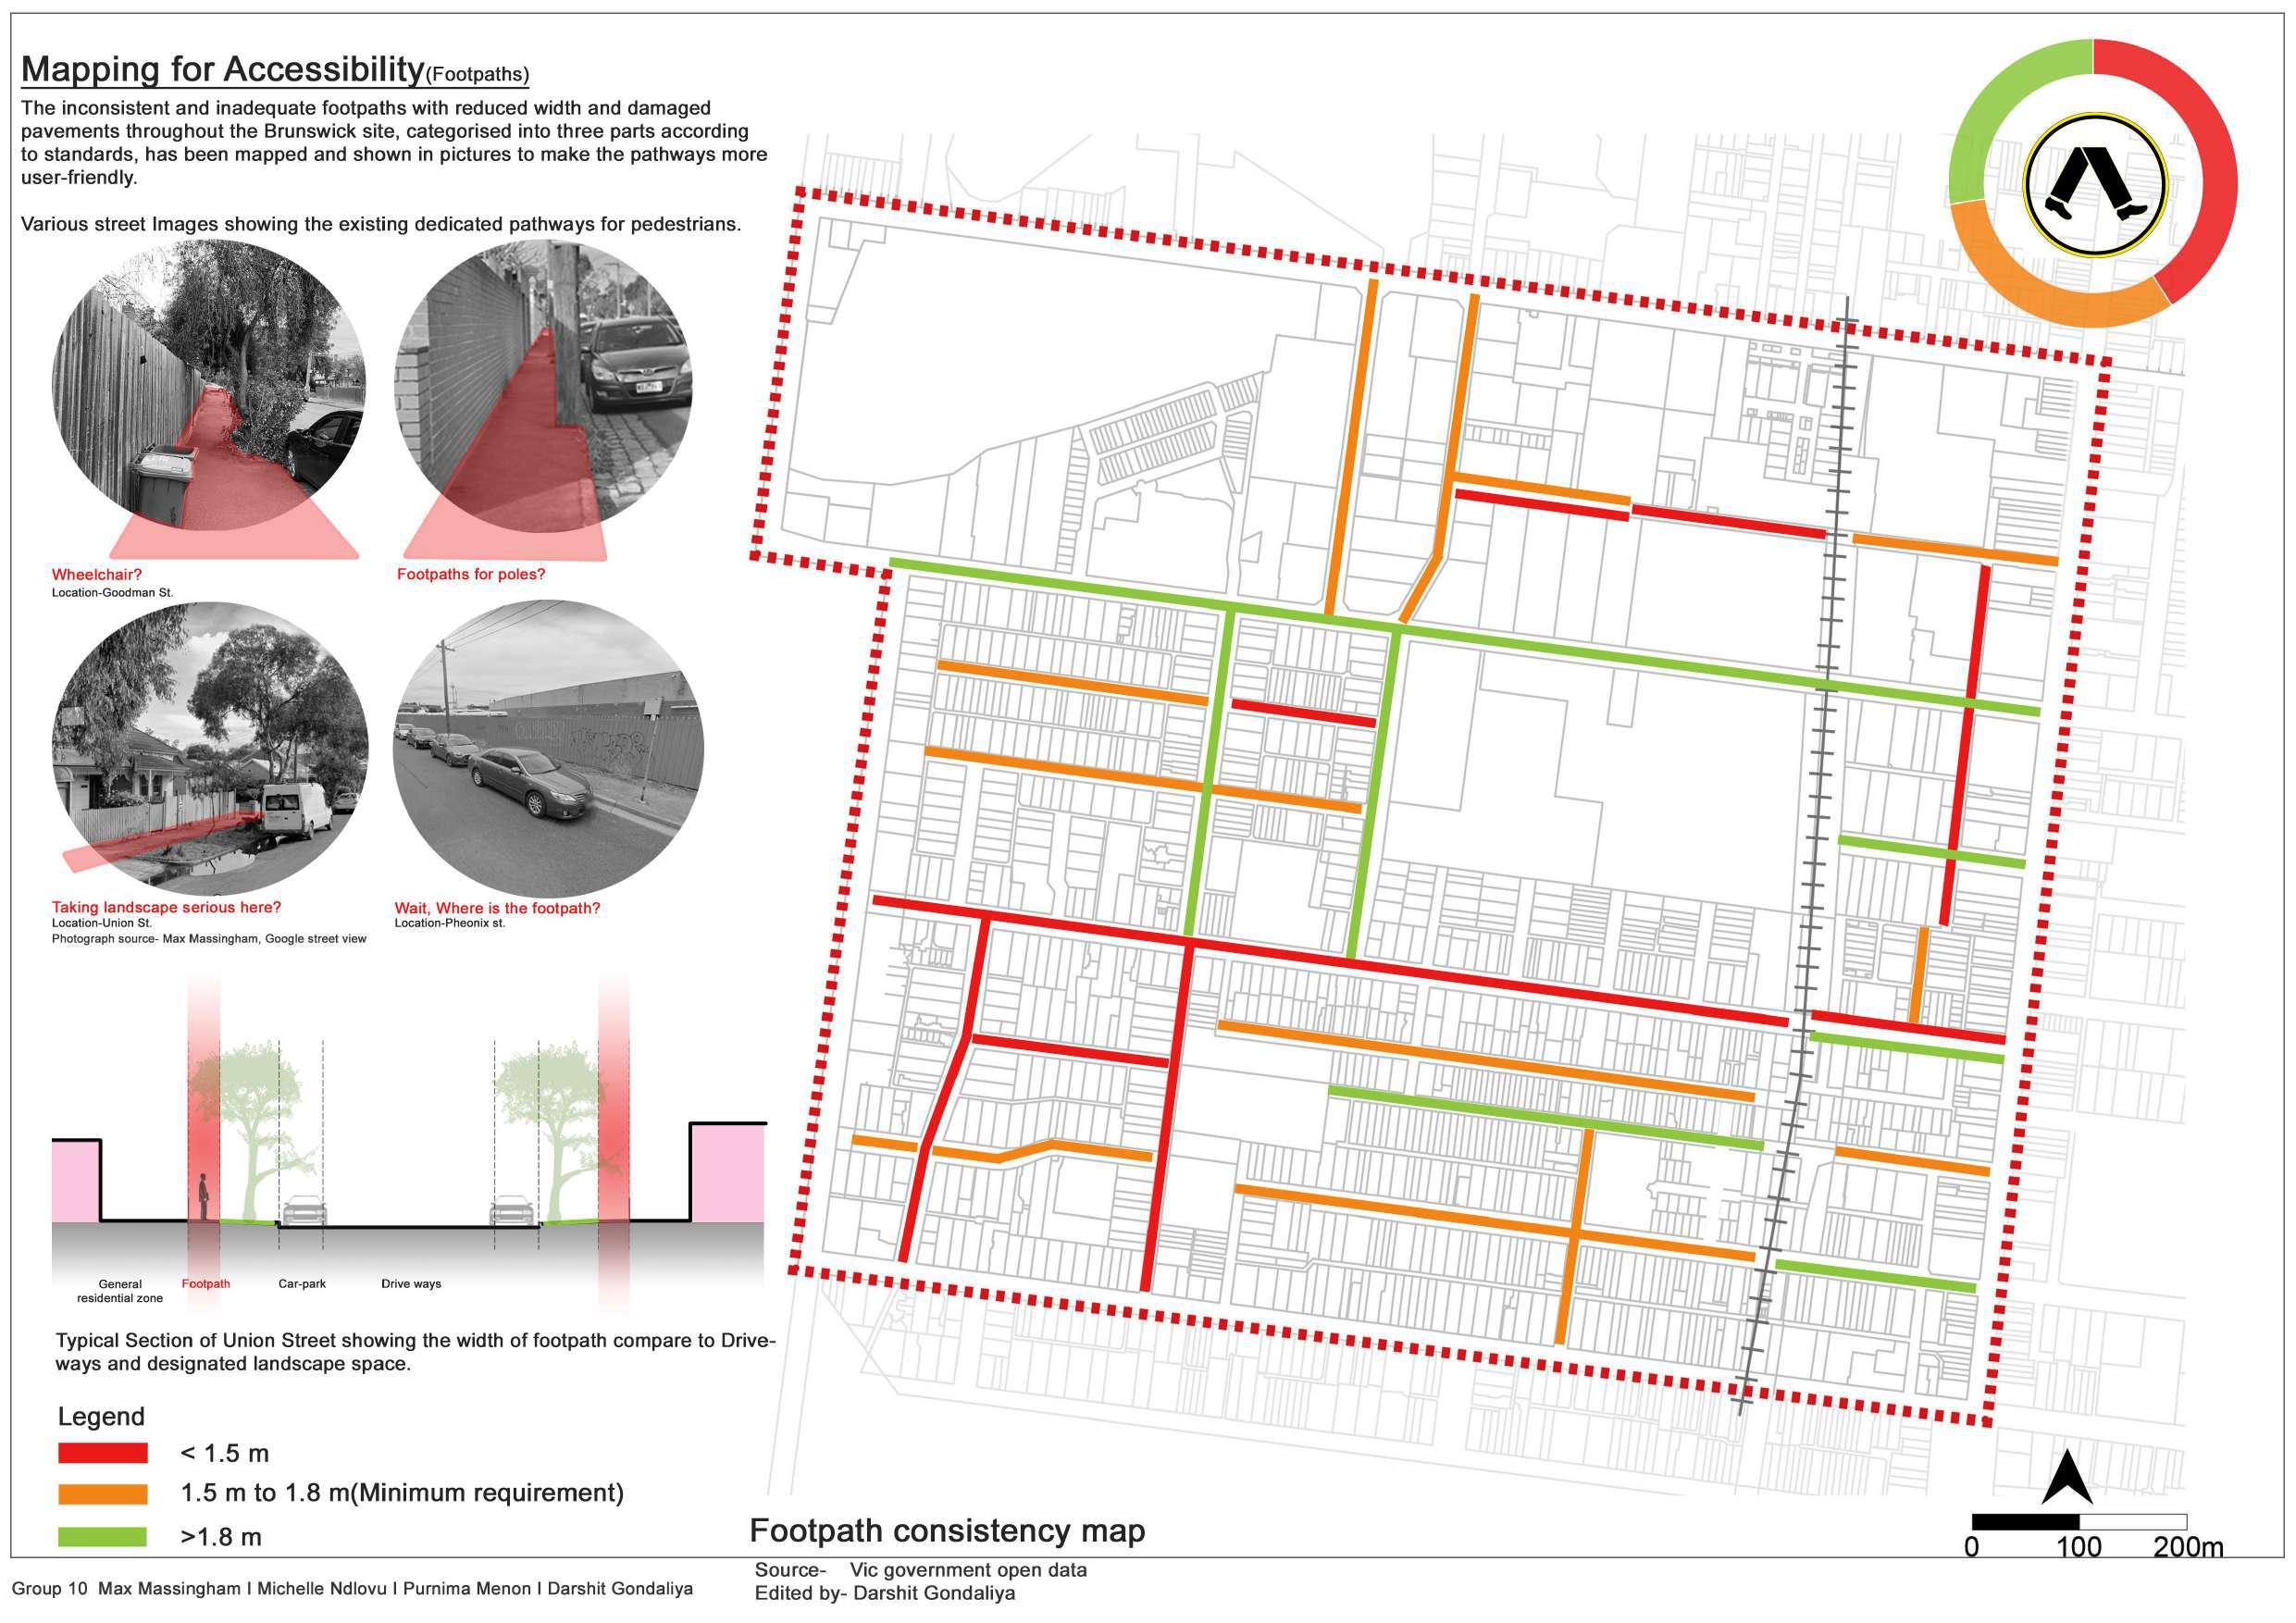
2 minute read
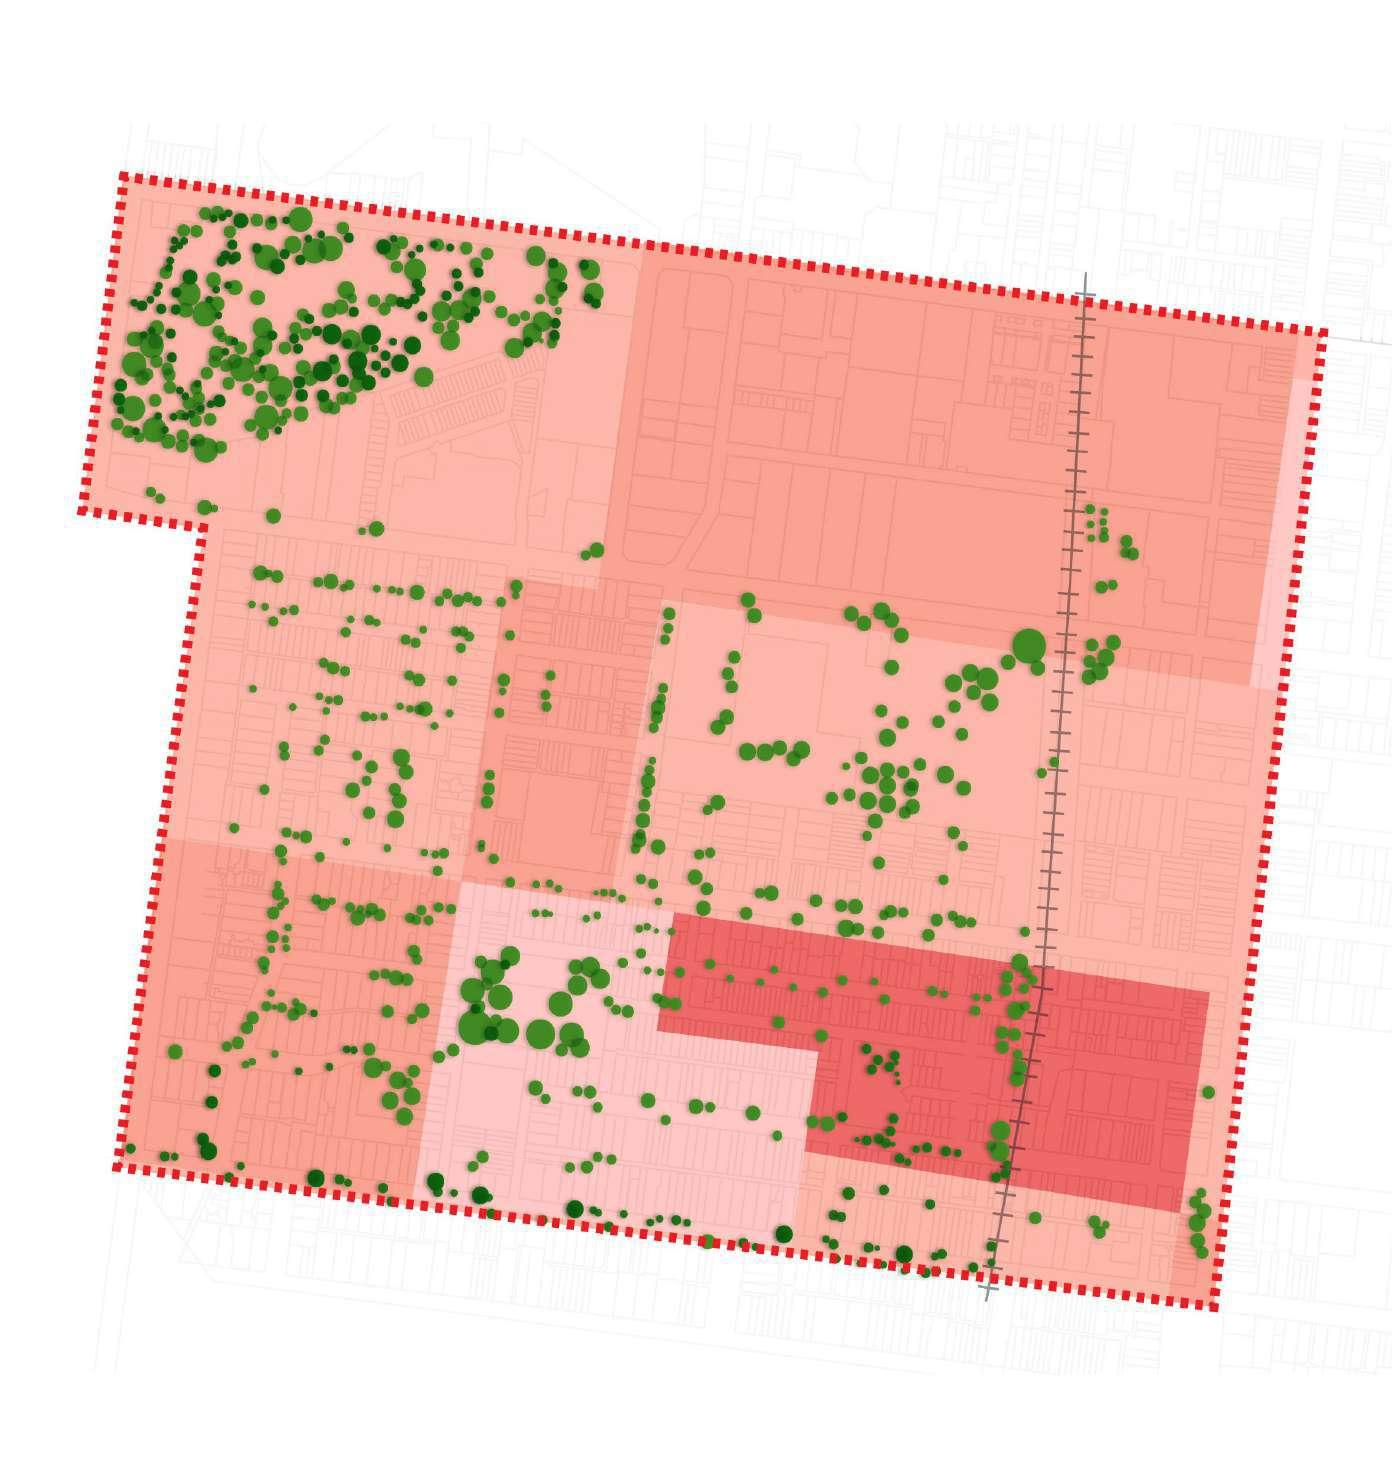
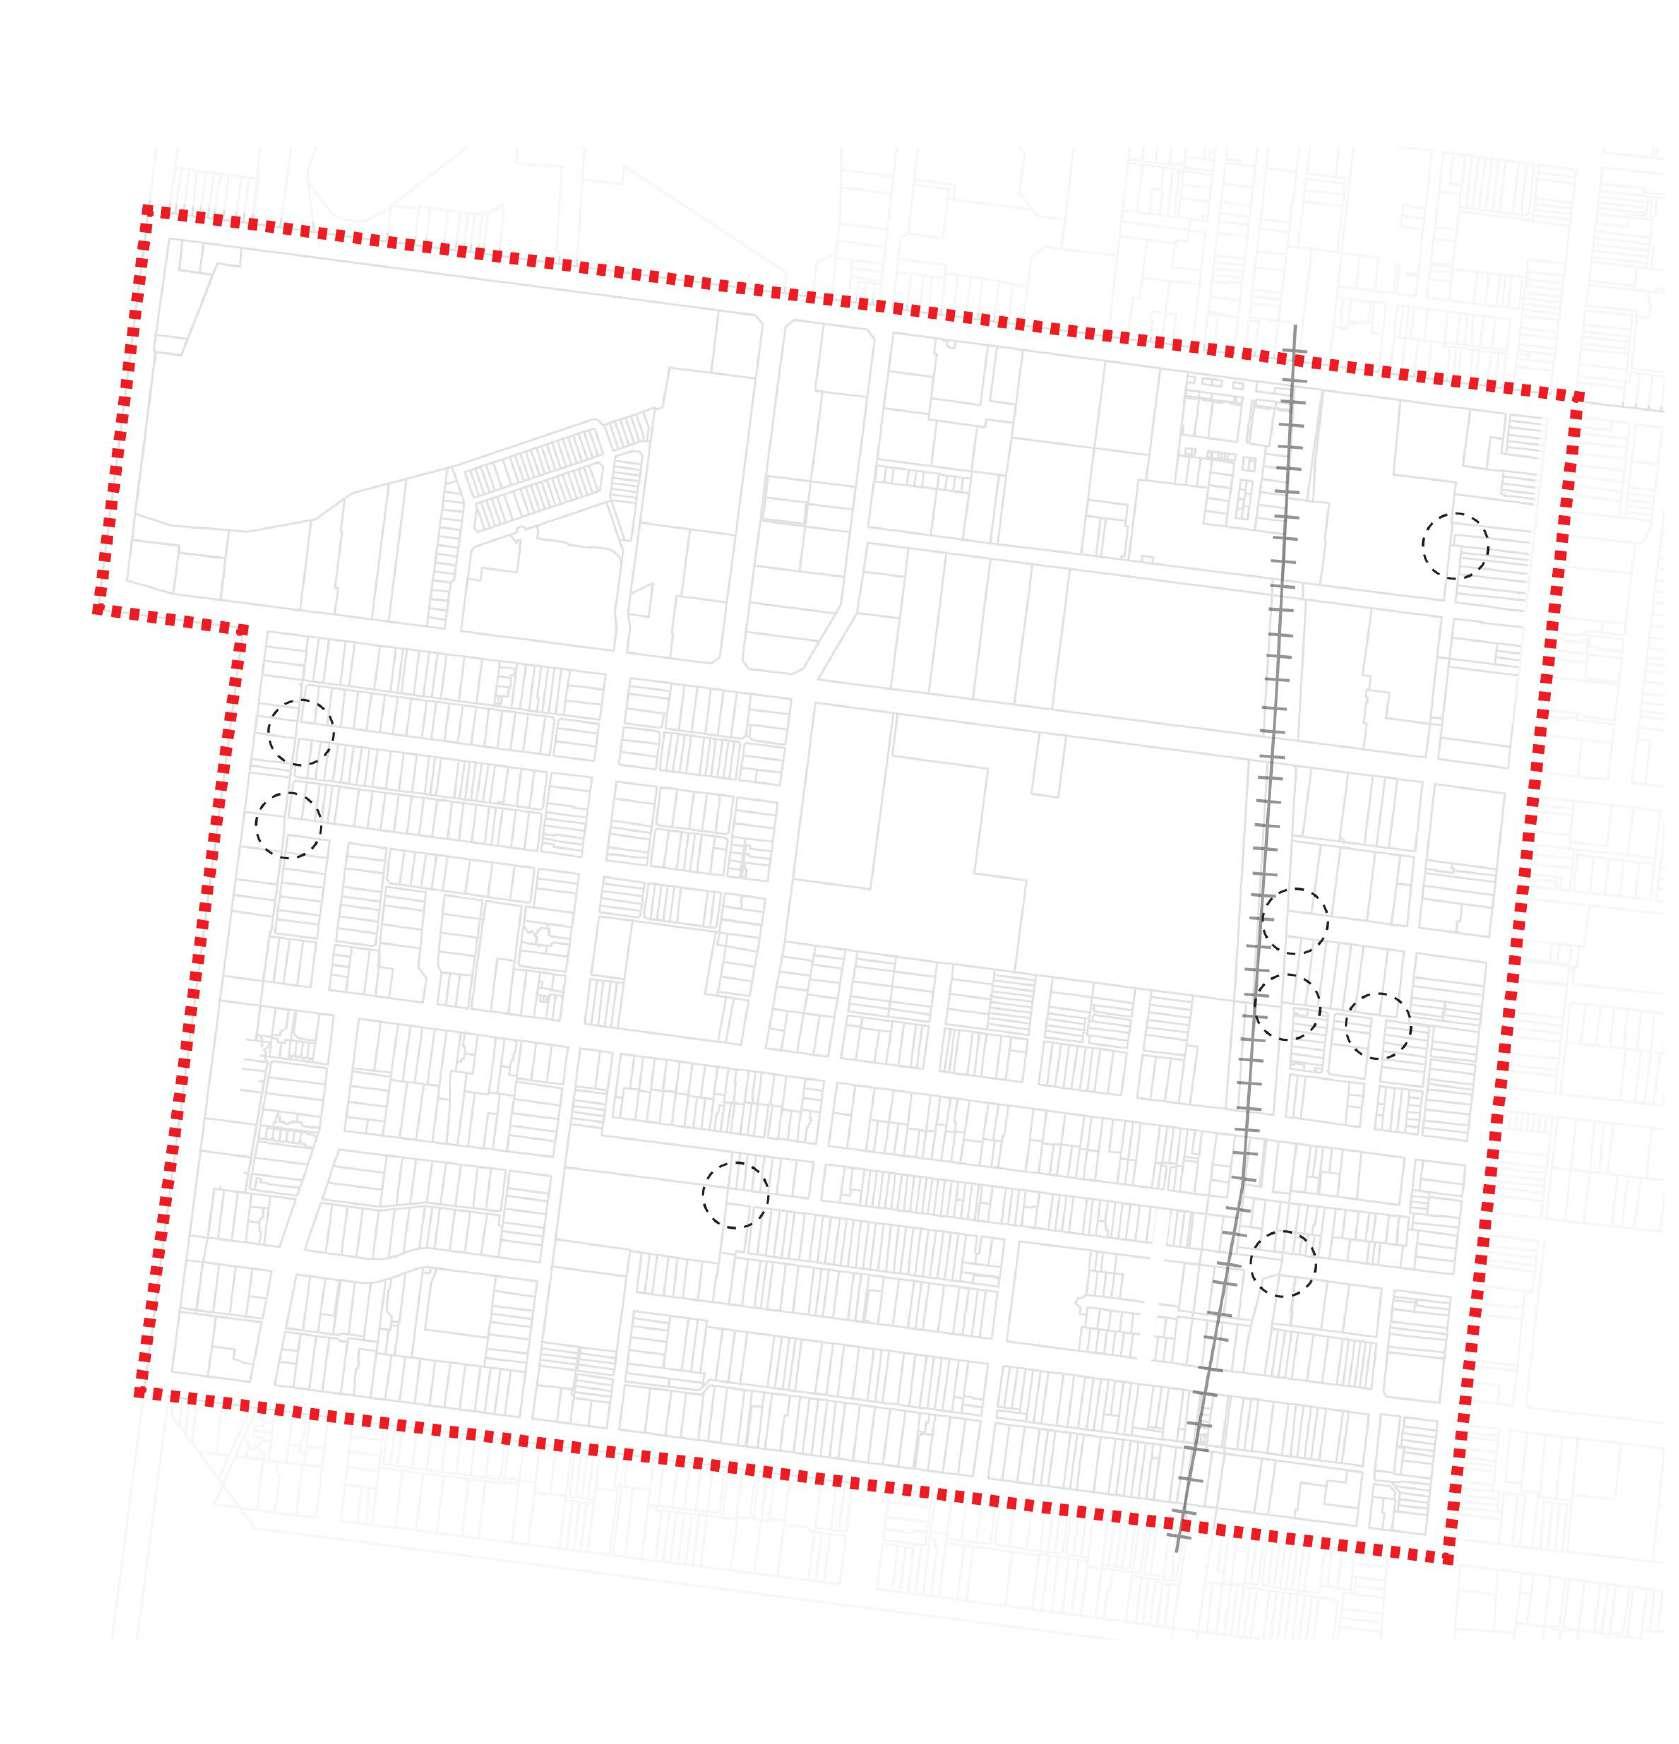
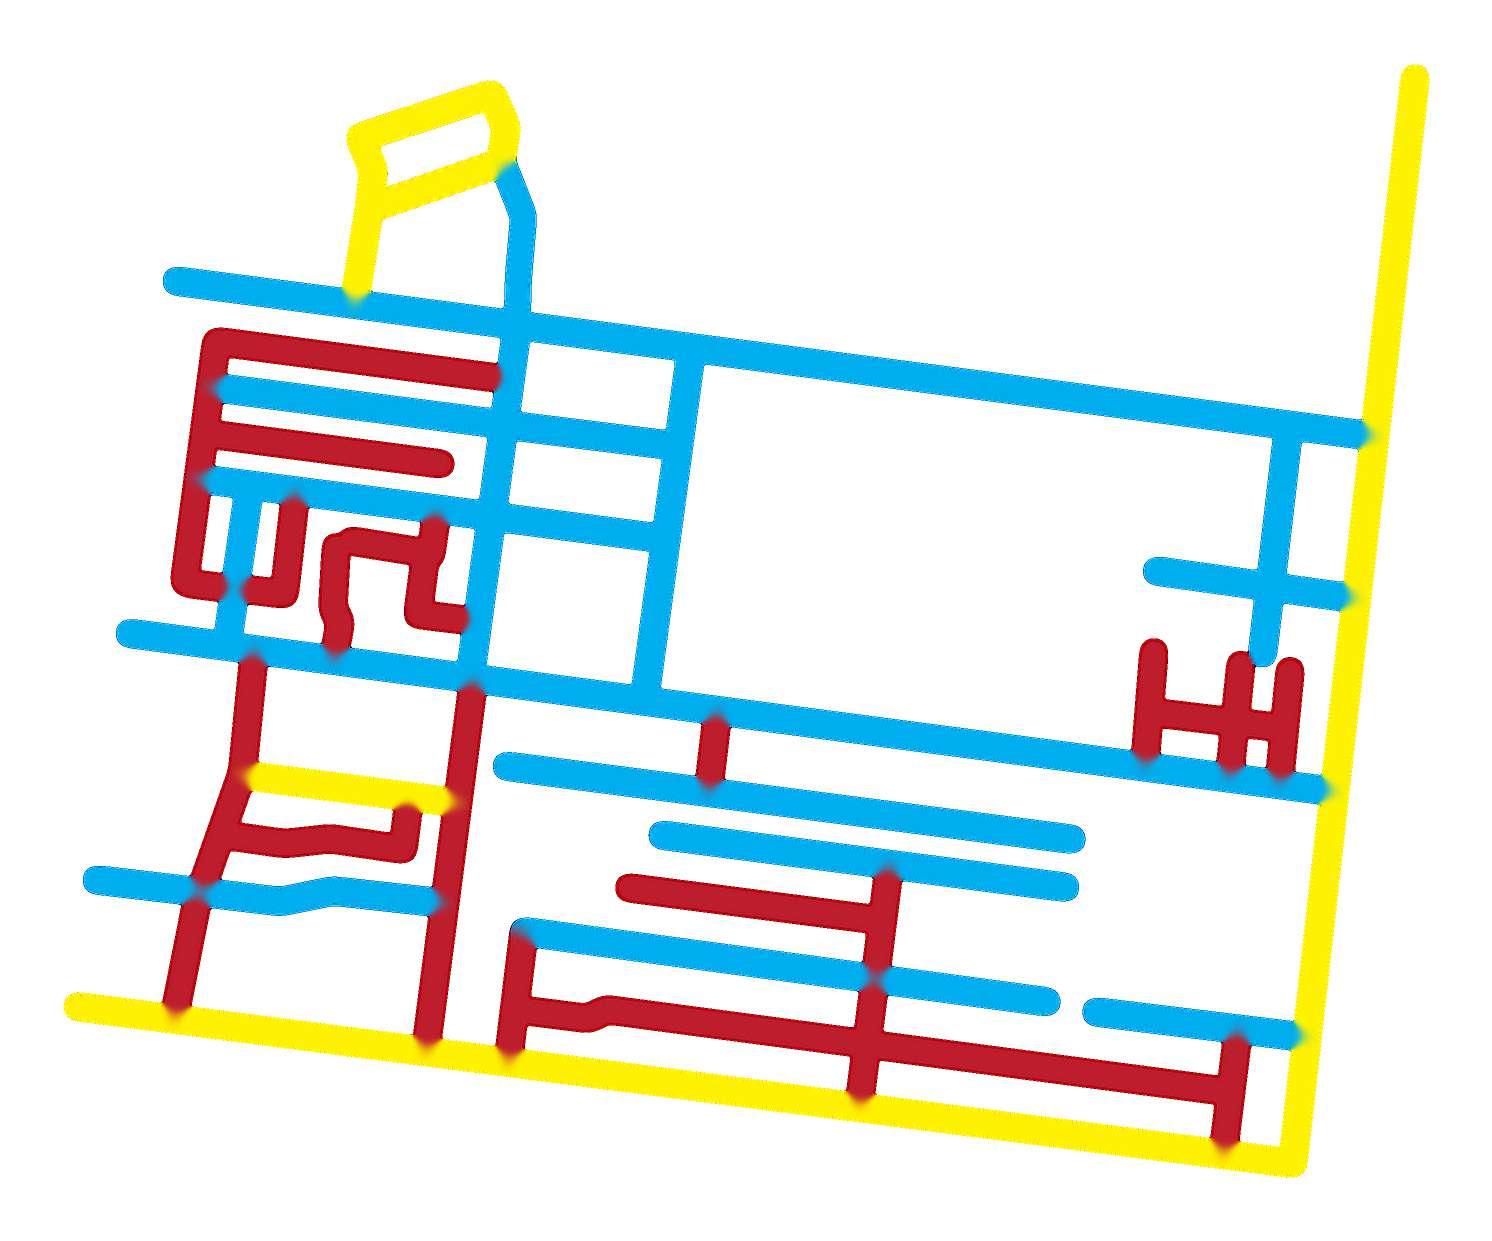
Pedestrian Sidewalk Cover & Heat Vulnerability Index


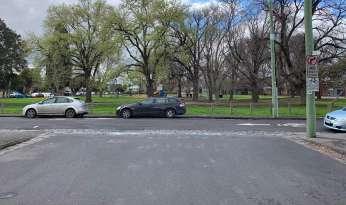
This map attemps to portray a connection between street canopy cover and the heat index produced at that area.
Advertisement
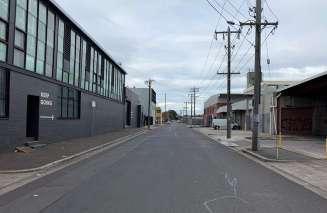
Impervious streets and landscapes have an effect in inducing the UHI phenomenon. The industrial area has increased impermeable surfaces such as parking lots, large driveways and low albedo pavements which owe to higher temperatures resulting in a high heat induced vulnerability (Vujovic et al 2021).
Pavement Material
Source:
Source:
Legend
Source:
Sidewalk with minimal or no canopy cover
Sidewalk with sporadic tree cover
Sidewalk with sufficient tree cover
Source:
Existing trees
Major problem zones with no canopy cover
Heat vulnerability ratings are from 1 to 5. These points are alloted based on three major components (Sun et al 2019):
- Heat Exposure
- Sensitivity to heat
- Adaptive Capacity
Heat Vulnerability Index Map with sidewalk canopy cover
Source: Heat Vulnerability Index (2018) (SA1) https://mapshare.vic.gov.au/coolinggreening/
Edited by: Purnima
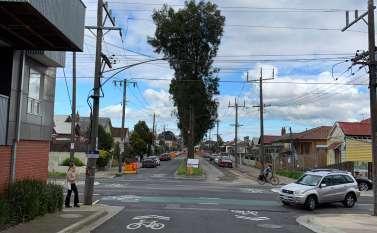
Pedestrian Activity & Urban Activity Mapping

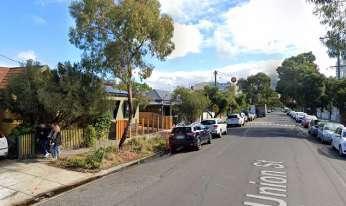
Active streets are minimal in the residential and industrial zones. The streets appear ‘passive’ with no active surveillance denoted as ‘eyes on the street’ by Jane Jacobs (1961, p. 106).
As denoted by the map, high active streets within the site are characterised either by commercial use, institutional use, public parks and transit nodes. Industrial and residential zones have minimal urban activity making the streets dull and barren.
Pedestrian Activity Zones
Activities caused by or near University or college campus, due to student and pedestrian crowd
HIGH-ACTIVITY ZONES
Activity near Cafes and restaurants during peak hours
Commercial Institutional Transit Zone
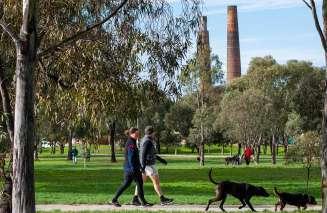
Activity near public open spaces such as parks and recreational zones
Activity node with people accessing the Gilpin Park during morning and evening hours of the day. Activities include - trails, dog walks, kids play zones.
Travelling pedestrian traffic on footpaths and sidewalks
Police Complex
Tram Station
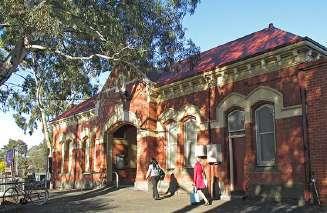
Railway Station
Railway Line
Dead end zones/ dead alley ways
Map for urban activity hotspots
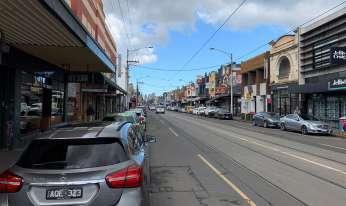
High activity urban activity zones along Sydney Road and the junction of Brunswick Road due to local shops, cafes, restaurants and the public tram station.
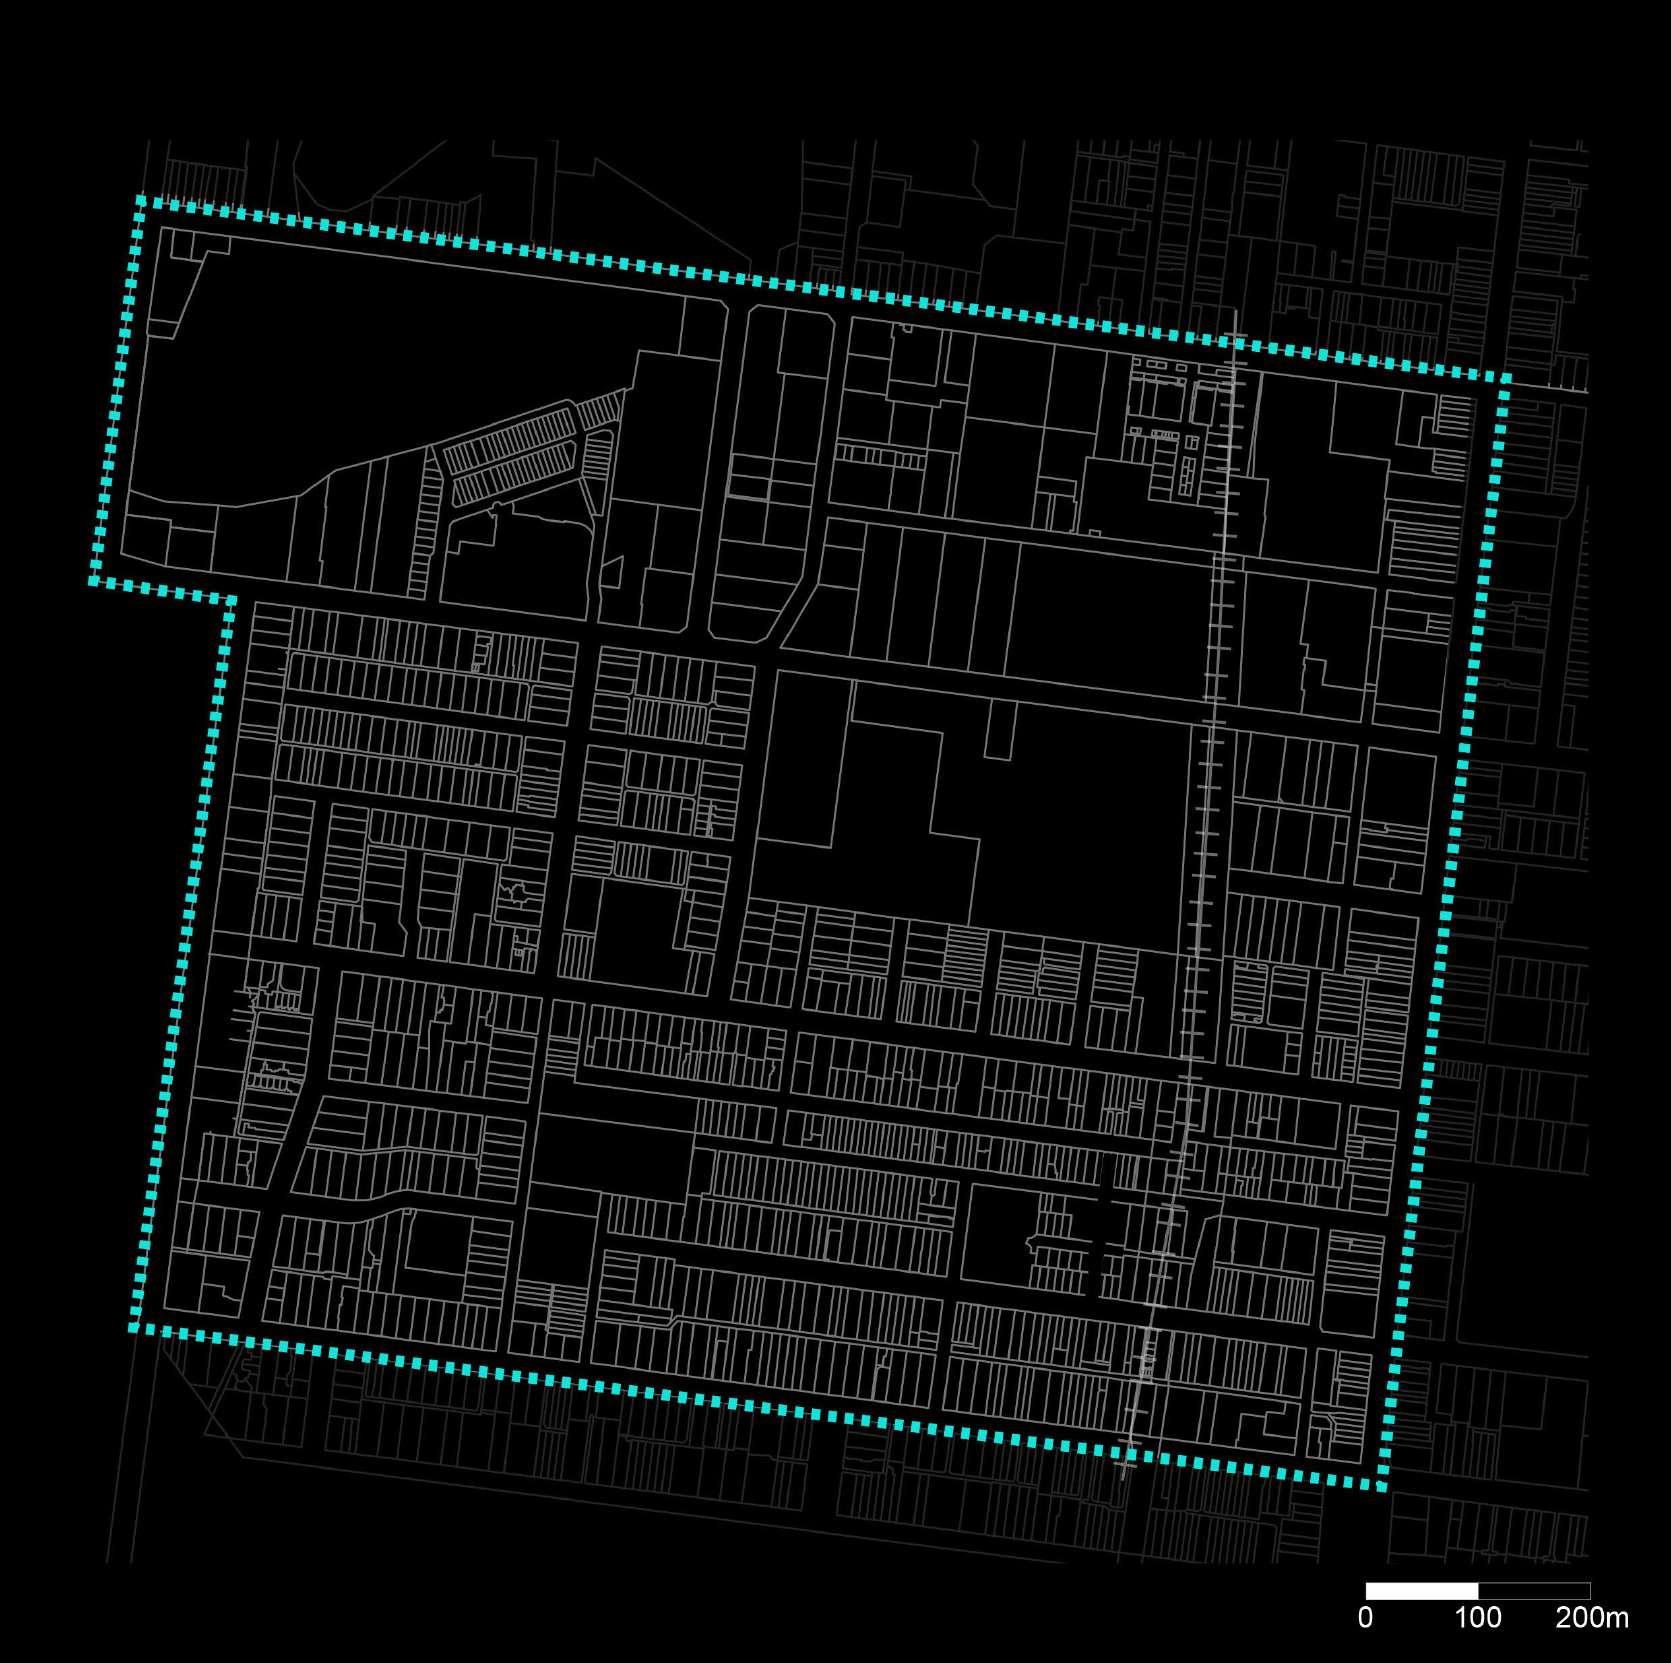
Mapping Linkages & Connections
Poor linkages exist between the residential zones, green spaces, industrial and transit zones. This increases travel time and demands the use of vehicles.
Wide crossing junctions create hinderance for pedestrians due to incoming vehicular traffic - especially at Dawson Street due to the presence of institutional campus in vicinity.
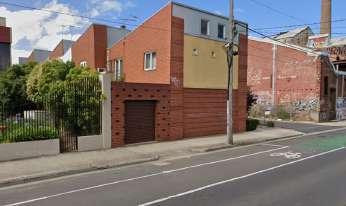
No interaction between the public and private realm due to closed off building facades causing minimal urban activity and potential for urban interaction between pedestrians and interior spaces.
Source: Max Massingham
Source: Google Earth
Source: Max Massingham
Source: Google Earth

Map depicting connections and linkages with problem intersections
Source: Vic Government Open Data, https://www.data.vic.gov.au/ , Google Earth, Self on-site Assessment Edited by: Purnima Menon
Mapping for Safety Analysis
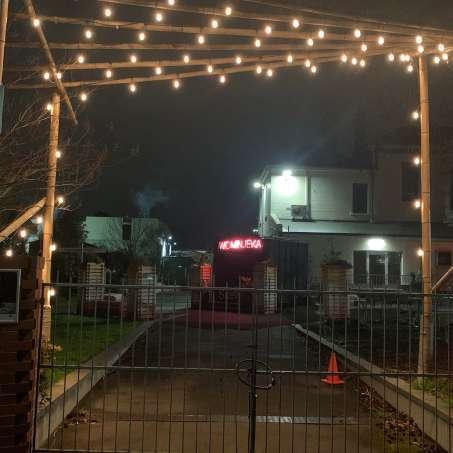
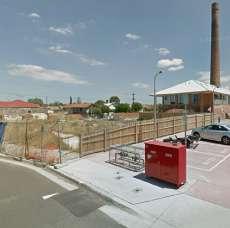
Alleyways characterise with little to no lighting indicate that the area and is likely to increase the chances of criminal activities and generate unsafe zones for residents.
Areas with more lighting and open-ness have been linked to safe and happy zones.
Areas lacking sufficient lighting, have been considered unsafe and unhappy zones and as per the crime statistics shown, with the Brunswick site having an increased crime rate since 2021.
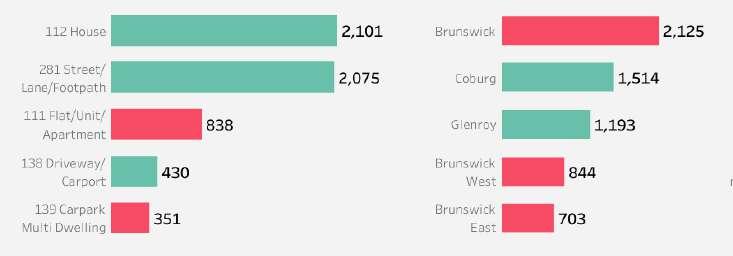
Crime statistics of Moreland Suburbs - Year Ending March 2022
Source: Crime Statistics Agency, Latest crime data by area https://www.crimestatistics.vic.gov.au/crime-statistics/latest-crime-data-by-area
Legend
Streetlights at a distance of about 20m
Streetlights at a distance of approx. 150m-200m


Streetlights present at large distance/ no lighting
Dead end Zones with no/minimal lighting
Unhappy Zones
Happy Zones
Source: Google Maps, CROWDSPOT - Happy and sad places
People reported feeling happy & rejuvinated at Temple Park due to shaded trees and open spaces.
Source:
People reported feeling unsafe at vacant plots and at the skywalk area at Phoenix St due to minimal lighting at night.
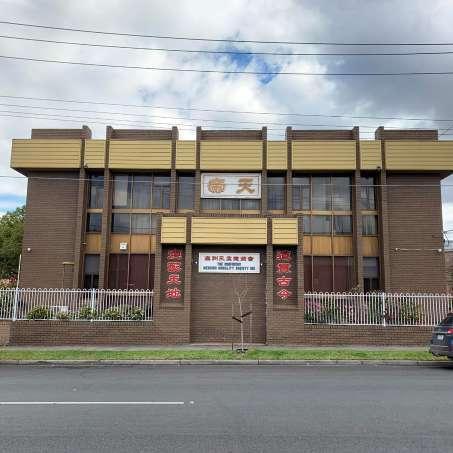
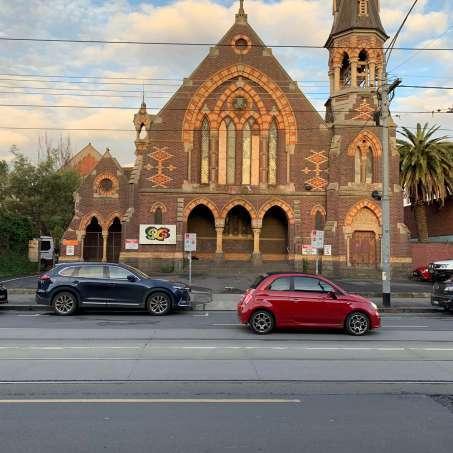
Creative & Cultural Expression
The historic & current diversity gives rise to the varied community buildings on site. Both Old [buildings of faith] and New [educational and art].