43_45_47_49.qxp_Grid 17/01/2019 11:09 Page 43
PG Retail Barometer
Strictly Come Retailing So how will 2018 be remembered in the UK’s history books? There was the Beast from the East, which created Christmas card perfect snowy scenes, but was massively disruptive to business. However this was trumped by another ‘B word’ with the grey cloud of Brexit omnipresent, resulting in consumer and commercial uncertainty. Sure there was some sunshine – a long hot summer, the fairytale Royal wedding of Harry and Meghan, Gareth Southgate raising spirits through England’s World Cup performance, while Strictly Come Dancing added some special sparkle as Stacey Dooley danced her way into the nation’s hearts and souls. PG spins the ‘glitter ball’ on how 2018 stacked up for indies by revealing the findings of the PG Retail Barometer, the only annual survey into the health and wealth of the independent card retailer. How’s Business Been?
The PG Retail Barometer is an annual survey of independent greeting card retailers. In a change from previous years, this latest survey includes both independent retailers who are Cardgains members (accounting for 1,000 rooftops) as well as those who are not a member of the buying group. All surveys were completed by December 10.
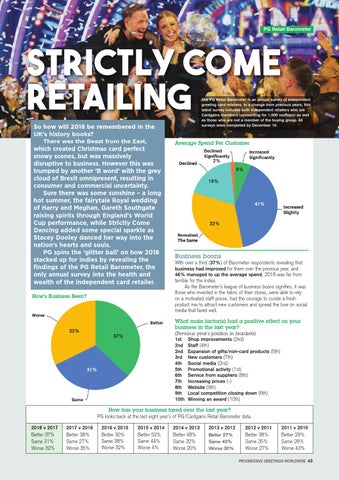
Average Spend Per Customer
2% 6% 19%
41%
32%
Business boons With over a third (37%) of Barometer respondents revealing that business had improved for them over the previous year, and 46% managed to up the average spend, 2018 was far from terrible for the indies. As the Barometer’s league of business boons signifies, it was those who invested in the fabric of their stores, were able to rely on a motivated staff posse, had the courage to curate a fresh product mix to attract new customers and spread the love on social media that fared well.
What main factor(s) had a positive effect on your business in the last year?
32%
(Previous year’s position in brackets)
37%
1st 2nd 2nd 3rd 4th 5th 6th 7th 8th 9th 10th
31%
Shop improvements (2nd) Staff (4th) Expansion of gifts/non-card products (5th) New customers (7th) Social media (2nd) Promotional activity (1st) Service from suppliers (8th) Increasing prices (-) Website (9th) Local competition closing down (6th) Winning an award (10th)
How has your business fared over the last year? PG looks back at the last eight year’s of PG/Cardgains Retail Barometer data. 2018 v 2017 Better 37% Same 31% Worse 32%
2017 v 2016 Better 38% Same 27% Worse 35%
2016 v 2015 Better 30% Same 38% Worse 32%
2015 v 2014 Better 52% Same 44% Worse 4%
2014 v 2013 Better 48% Same 32% Worse 20%
2013 v 2012 Better 27% Same 43% Worse 30%
2012 v 2011 Better 38% Same 35% Worse 27%
2011 v 2010 Better 29% Same 28% Worse 43%
PROGRESSIVE GREETINGS WORLDWIDE
43