20-23 Retail Barometer 2020.qxp_Grid 27/03/2020 16:03 Page 1
The 2020 Retail Barometer readings
Here’s some good news! Encouragingly, providing a decent base for business this year, nearly two thirds of independent cookshop and housewares retailers fared better or remained the same in 2019 compared to their trade in 2018. A great pride in coming up with ways of serving their customer communities with exceptional, personal service stood them in good stead in the last year, as did having the gumption to commit to new products and facilitate the move to more sustainable living. These are just some of the enlightening findings of the Retail Barometer, the annual survey into the health and wealth of cookshop and housewares retailers organised by Progressive Housewares and HousewaresNews.net in conjunction with Bira. PH delves deeper into this important research, which, for the last 15 years has provided an invaluable benchmark for retailers and suppliers alike.
It’s
personal Inset: Independent cookshop and housewares stockists are proud of their exceptionally high standards of customer service. (Photo: Anastasia Gepp, Pixabay)
HOLDING UP
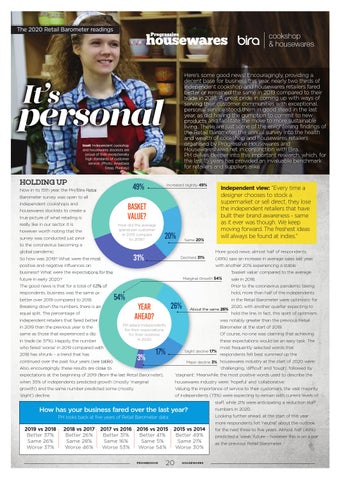
Increased slightly 49%
49%
Now in its 15th year, the PH/Bira Retail Barometer survey was open to all independent cookshops and housewares stockists to create a true picture of what retailing is really like in our sector. It is however worth noting that the survey was conducted just prior to the coronavirus becoming a global pandemic. So how was 2019? What were the most positive and negative influences on business? What were the expectations for the future in early 2020? The good news is that for a total of 63% of respondents, business was the same or better over 2019 compared to 2018. Breaking down the numbers, there is an equal split. The percentage of independent retailers that fared better in 2019 than the previous year is the same as those that experienced a dip in trade (ie 37%). Happily, the number who fared ‘worse’ in 2019 compared with 2018 has shrunk – a trend that has continued over the past four years (see table). Also, encouragingly, these results are close to expectations at the beginning of 2019 (from the last Retail Barometer), when 35% of independents predicted growth (mostly ‘marginal growth’) and the same number predicted some (mostly ‘slight’) decline.
BASKET VALUE?
20%
Same 20%
Independent view: “Every time a designer chooses to stock a supermarket or sell direct, they lose the independent retailers that have built their brand awareness - same as it ever was though. We keep moving forward. The freshest ideas will always be found at indies.”
More good news: almost half of respondents (49%) saw an increase in average sales last year, with another 20% experiencing a stable ‘basket value’ compared to the average Marginal Growth 54% sale in 2018. Prior to the coronavirus pandemic taking hold, more than half of the independents in the Retail Barometer were optimistic for 2020, with another quarter expecting to About the same 26% hold the line. In fact, this spirit of optimism was notably greater than the previous Retail Barometer at the start of 2019. Of course, no-one was claiming that achieving these expectations would be an easy task. The most frequently selected words that Slight decline 17% respondents felt best summed up the Major decline 3% housewares industry at the start of 2020 were: ‘challenging, ‘difficult’ and ‘tough’, followed by ‘stagnant’. Meanwhile, the most positive words used to describe the housewares industry were: ‘hopeful’ and ‘collaborative.’ Valuing the importance of service to their customers, the vast majority of independents (73%) were expecting to remain with current levels of staff, while 21% were anticipating a reduction staff numbers in 2020. How has your business fared over the last year? Looking further ahead, at the start of this year PH looks back at five years of Retail Barometer data: more respondents felt ‘neutral’ about the outlook 2019 vs 2018 2018 vs 2017 2017 vs 2016 2016 vs 2015 2015 vs 2014 for the next three to five years. Almost half (49%) Better 37% Better 26% Better 31% Better 41% Better 49% predicted a ‘weak’ future – however this is on a par Same 26% Same 28% Same 16% Same 5% Same 21% as the previous Retail Barometer.
31%
Declined 31%
54%
26%
year ahead?
3%
Worse 37%
Worse 46%
Worse 53%
17%
Worse 54%
PROGRESSIVE
20
Worse 30% HOUSEWARES