Unit 6, Lesson 10: Graphing Systems of Linear Inequalities
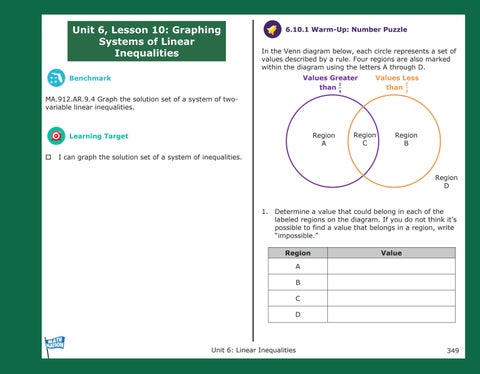
6.10.1 Warm-Up: Number Puzzle In the Venn diagram below, each circle represents a set of values described by a rule. Four regions are also marked within the diagram using the letters A through D. Values Greater 𝟏𝟏 than
Benchmark
𝟒𝟒
MA.912.AR.9.4 Graph the solution set of a system of twovariable linear inequalities.
Region A
Learning Target
Values Less 𝟐𝟐 than 𝟑𝟑
Region C
Region B
I can graph the solution set of a system of inequalities.
Region D
1.
Determine a value that could belong in each of the labeled regions on the diagram. If you do not think it’s possible to find a value that belongs in a region, write “impossible.” Region
Value
A B C D
Unit 6: Linear Inequalities
349